. 2023 May 11;12(10):1367.
doi: 10.3390/cells12101367.

The RhoA-ROCK1/ROCK2 Pathway Exacerbates Inflammatory Signaling in Immortalized and Primary Microglia

Affiliations

The RhoA-ROCK1/ROCK2 Pathway Exacerbates Inflammatory Signaling in Immortalized and Primary Microglia

Elliot J Glotfelty et al. Cells. .

Abstract

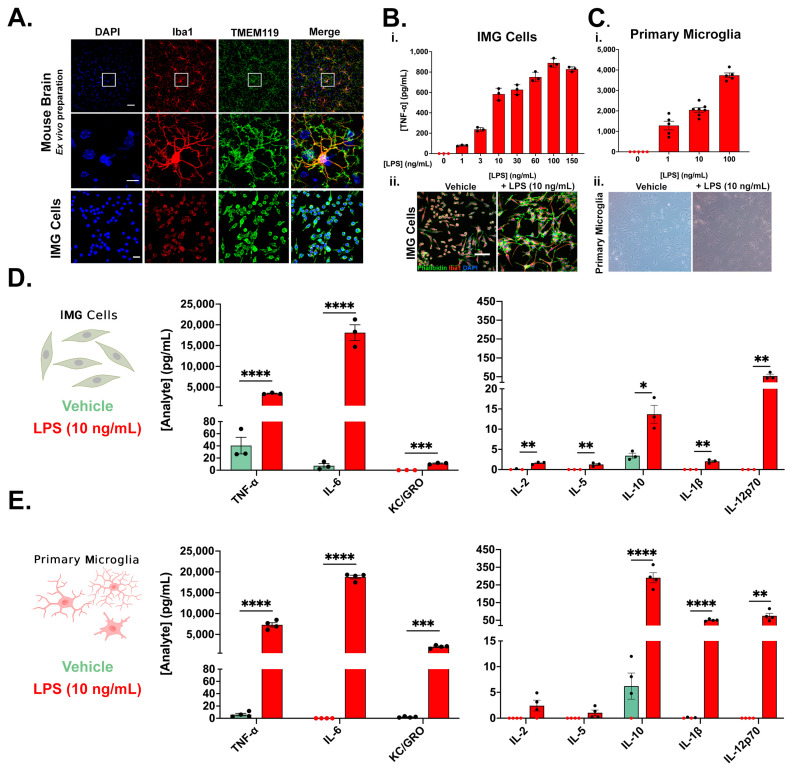
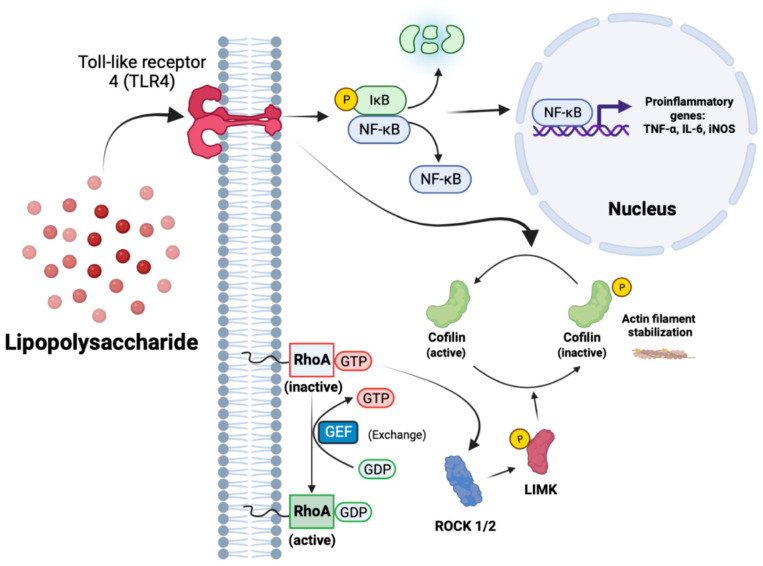
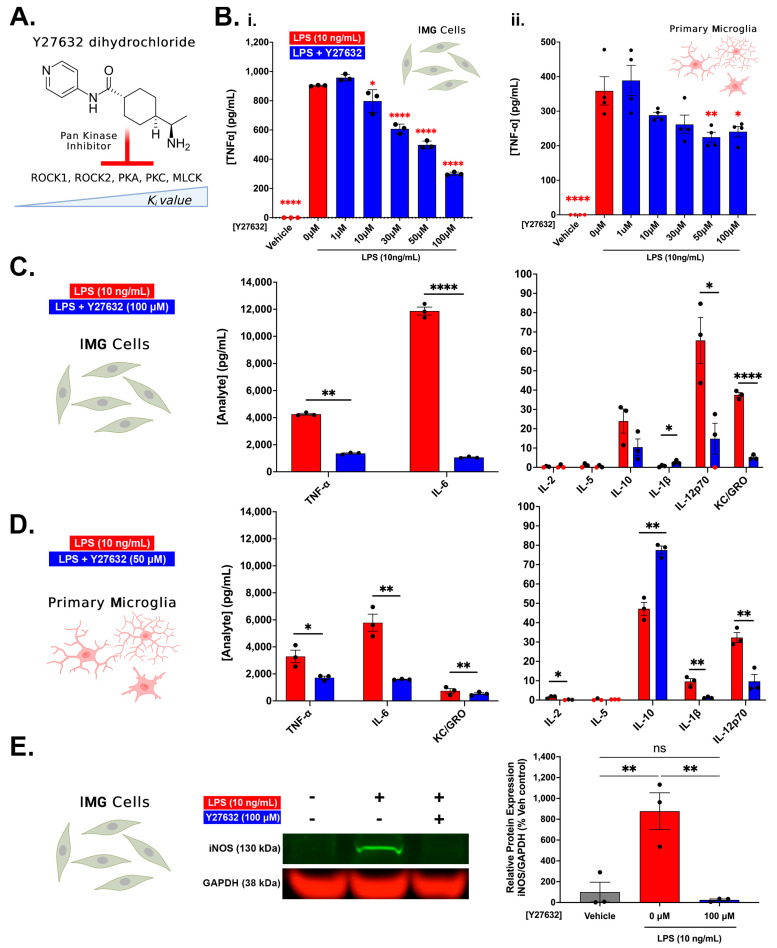
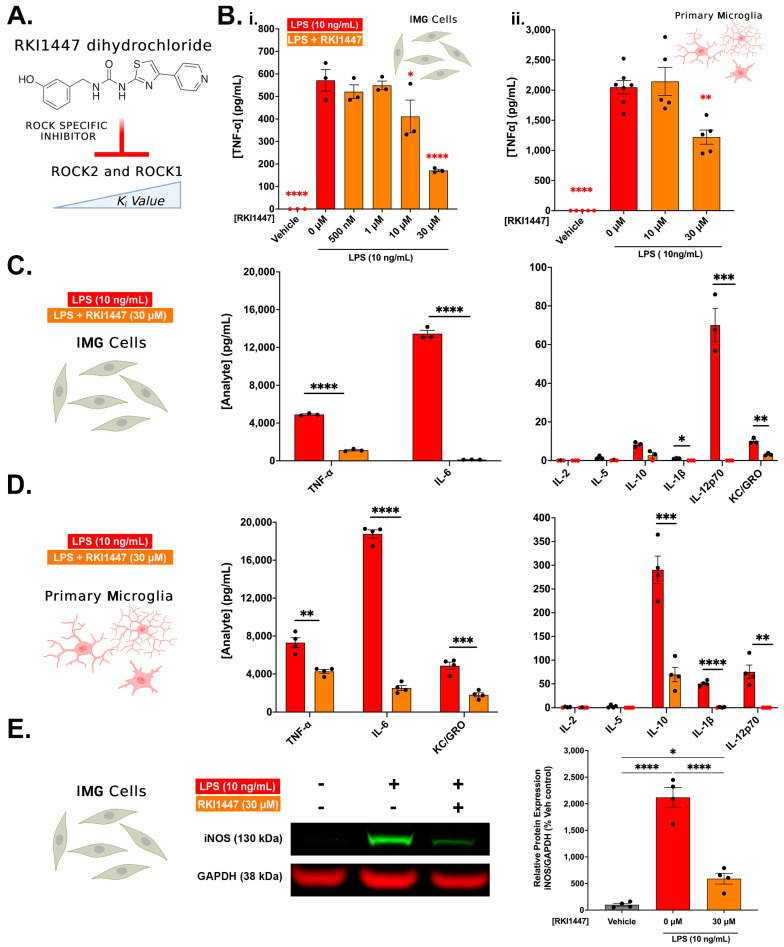
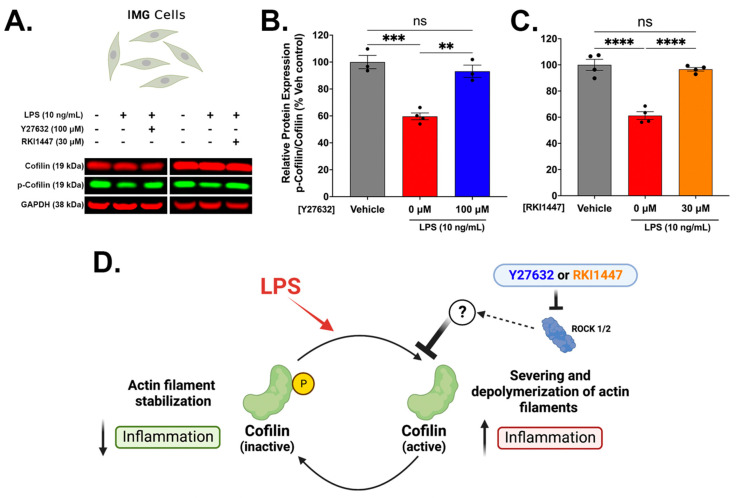
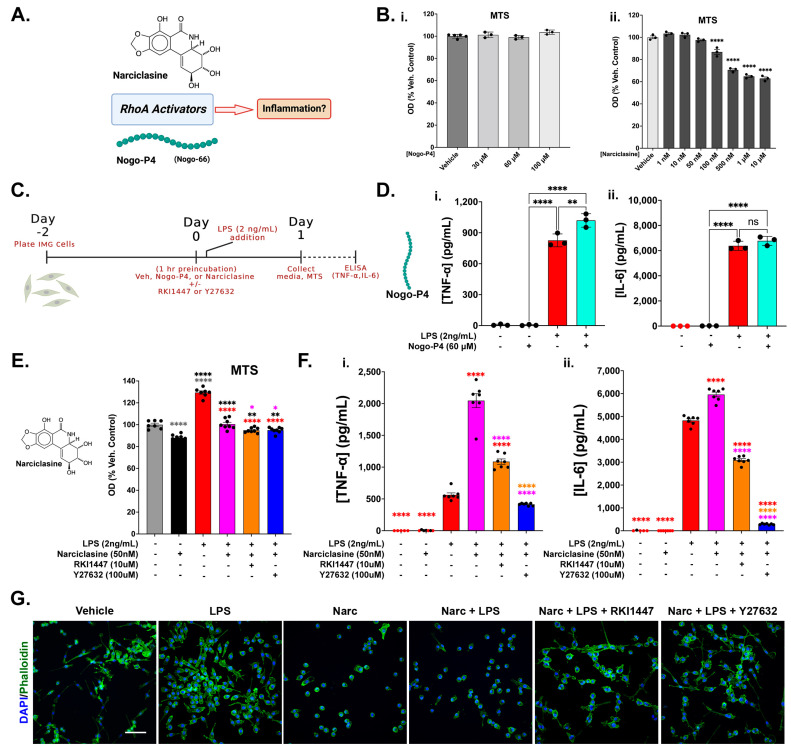
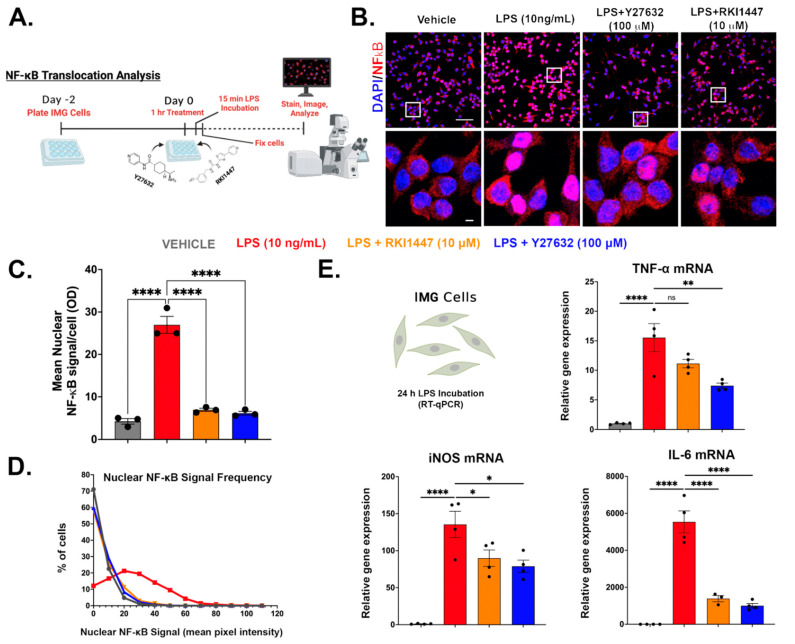
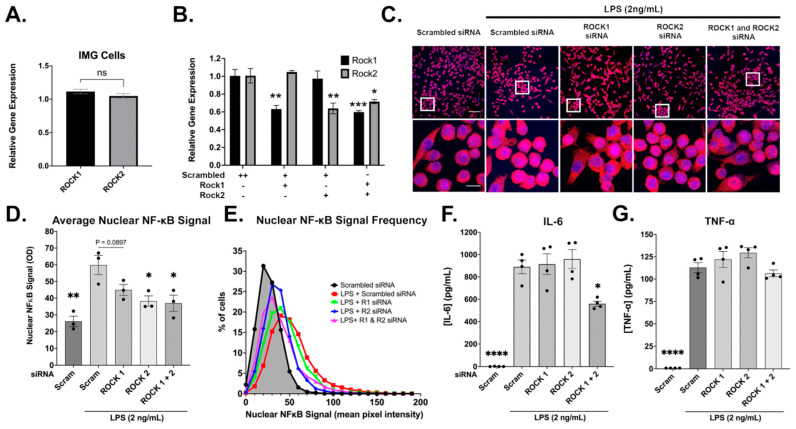
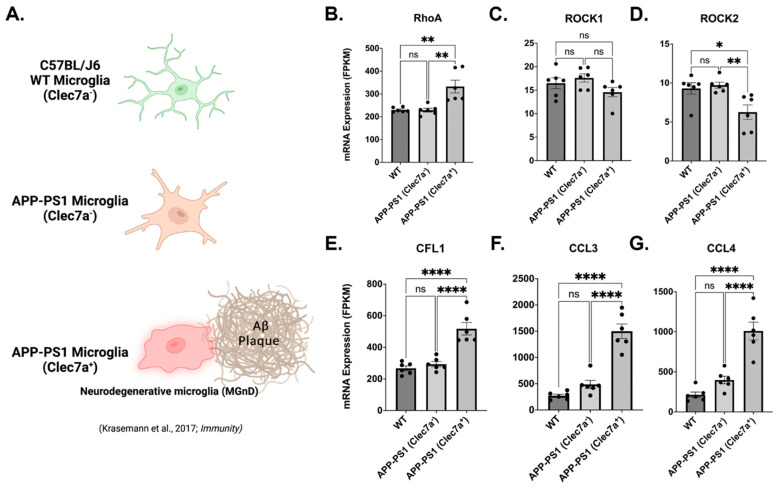
Neuroinflammation is a unifying factor among all acute central nervous system (CNS) injuries and chronic neurodegenerative disorders. Here, we used immortalized microglial (IMG) cells and primary microglia (PMg) to understand the roles of the GTPase Ras homolog gene family member A (RhoA) and its downstream targets Rho-associated coiled-coil-containing protein kinases 1 and 2 (ROCK1 and ROCK2) in neuroinflammation. We used a pan-kinase inhibitor (Y27632) and a ROCK1- and ROCK2-specific inhibitor (RKI1447) to mitigate a lipopolysaccharide (LPS) challenge. In both the IMG cells and PMg, each drug significantly inhibited pro-inflammatory protein production detected in media (TNF-α, IL-6, KC/GRO, and IL-12p70). In the IMG cells, this resulted from the inhibition of NF-κB nuclear translocation and the blocking of neuroinflammatory gene transcription (iNOS, TNF-α, and IL-6). Additionally, we demonstrated the ability of both compounds to block the dephosphorylation and activation of cofilin. In the IMG cells, RhoA activation with Nogo-P4 or narciclasine (Narc) exacerbated the inflammatory response to the LPS challenge. We utilized a siRNA approach to differentiate ROCK1 and ROCK2 activity during the LPS challenges and showed that the blockade of both proteins may mediate the anti-inflammatory effects of Y27632 and RKI1447. Using previously published data, we show that genes in the RhoA/ROCK signaling cascade are highly upregulated in the neurodegenerative microglia (MGnD) from APP/PS-1 transgenic Alzheimer's disease (AD) mice. In addition to illuminating the specific roles of RhoA/ROCK signaling in neuroinflammation, we demonstrate the utility of using IMG cells as a model for primary microglia in cellular studies.

Keywords: NF-κB; ROCK inhibitors; ROCK1; ROCK2; RhoA; microglia; neuroinflammation.


Conflict of interest statement

The authors declare no conflict of interest.

Figures

Figure 1
Figure 1
Immortalized mouse microglia (IMG cells) recapitulate features of primary microglia (PMg). (A) IMG cells express Iba1 and TMEM119, canonical markers of resident microglia of the mouse brain. The mouse brain images in the middle row are zoomed insets of the top row images, indicated by the white boxes in the image directly above. IMG cells (B(i)) (n = 3/group) and PMg (C(i)) (n = 5 or 7/group) secrete TNF-α in a dose-response manner to increasing doses of LPS 24 h after application. Additionally, representative morphological changes induced by a 10 ng/mL LPS challenge are similar between IMG cells ((B(ii))—via immunochemical staining) and PMg ((C(ii))—via light phase contrast microscopy). (D,E) Further analysis of the vehicle (0 ng/mL LPS)- and LPS (10 ng/mL)-treated cells from B revealed similar cytokine expression profiles in IMG cells (D) and PMg (E). LPS induces a significant increase in the production of TNF-α, IL-6, KC/GRO, IL-10, IL-1β, and IL-12p70 in both IMG cells (D) and PMg (E). Unpaired t-tests were used to compare vehicle vs. LPS-treated samples (* = p < 0.05, ** = p < 0.01, *** = p < 0.001, and **** = p < 0.0001); error bars represent mean ± SEM. Samples with analyte concentrations below assay detection limit are depicted in red and are assumed equivalent to 0 pg/mL to allow for statistical analysis. Brain microglia and IMG cells in (A) (scale bar = 20 μm); inset of single microglial cells in (A) (scale bar = 10 μm); IMG cells in (B(ii)) (scale bar = 50 μm). All ELISA experiments were normalized to MTS viability assays.
Figure 2
Figure 2
LPS (TLR4)-mediated inflammation and its interplay with RhoA activation and the downstream ROCK signaling pathways. LPS triggers the liberation of NF-κB from IκB, allowing for the NF-κB nuclear translocation and initiation of pro-inflammatory gene transcription. LPS also triggers the dephosphorylation of cofilin, which is the terminus of the RhoA/ROCK signaling pathway. Some of the effects of RhoA/ROCK signaling on inflammation remain elusive.
Figure 3
Figure 3
Pan kinase inhibition via Y27632 dihydrochloride reduces TLR4-initiated inflammatory response in IMG cells and PMg. (A) Chemical structure for Y27632 dihydrochloride. (B) Against an LPS challenge (10 ng/mL), TNF-α presence in media from IMG cells ((B(i)), n = 3/group) and PMg ((B(ii)), n = 4/group) decreases in a dose-response manner to increasing doses of Y27632. (C) Multiplex analyte analysis of Y27632 (100 μM) pre-treated IMG cells from (B) confirms significant reductions in TNF-α as well as the pro-inflammatory cytokine/chemokines IL-6, KC/GRO, and IL-12p70 when compared to LPS treatment alone. Y27632-pre-treated IMG cells show a minor, albeit significant, increase in the production of IL-1β. (D) Similar trends in Y27632 (50 μM)-pre-treated PMg from (B) (n = 3/group) were observed in the multi-analyte analysis. Significant TNF-α reductions were confirmed with equal or greater magnitude decreases in IL-6, IL-2, IL-1β, and IL-12p70 also observed. The anti-inflammatory cytokine IL-10 shows significant increases in the 50 μM pre-treated PMg. Whole-cell IMG cell lysates probed via Western Blot for iNOS (normalized to GAPDH protein) (E) show modulation of iNOS protein with LPS treatment and pretreatment with Y27632 (100 μM). Analyte samples with concentrations below the assay detection limit are shown as red data points and are assumed equivalent to 0 pg/mL to allow for the statistical analysis. In (B,E), one-way ANOVA with Dunnett’s comparison (vs. 0 μM Y27632) and Tukey’s comparison, respectively, were used. In (C,D), unpaired t-tests were used to compare LPS-treated vs. Y27632-pre-treated cells. Error bars represent mean ± SEM; (ns = not significant, * = p < 0.05, ** = p < 0.01, and **** = p < 0.0001). All ELISA experiments were normalized to MTS viability assays). Although the multiplex assay used in (C,D) also measured IL-4 and IFN-γ, no measurable analyte was observed and, hence, is not shown.
Figure 4
Figure 4
ROCK1 and ROCK2 inhibition via RKI1447 dihydrochloride is sufficient to block TLR4-initiated inflammatory response in IMG cells and PMg. (A) The chemical structure for the ROCK1 and ROCK2 specific inhibitor RKI1447 dihydrochloride is shown. (B) Against an LPS (10 ng/mL) challenge, TNF-α detected in in media from IMG cells ((B(i)), n = 3/group) and PMg ((B(ii)), n = 5 or 7/group) decreases in a dose-response manner to increasing pretreatment doses of RKI1447. (C,D) Multiplex analyte analysis of 30 μM pre-treated IMG cells from (B) confirms significant reductions in TNF-α as well as the pro-inflammatory cytokine/chemokines IL-6, KC/GRO, IL-12p70, IL-1β and the anti-inflammatory IL-10. (D) Similar trends in 30 μM pre-treated PMg from (B) (n = 3/group) were observed in the multiplex analyte analysis, confirming significant TNF-α reductions, along with significant decreases in IL-6, KC/GRO, IL-12p70, IL-1β, and the anti-inflammatory IL-10. Whole-cell IMG cell lysates probed via Western blotting for iNOS (normalized to GAPDH protein) (E) show significant increases in protein with LPS treatment and significant decreases in cells pre-treated with RKI1447. In (B,E), one-way ANOVA using Dunnett’s comparisons (vs. 0 μM RKI1447) and Tukey’s comparisons, respectively, were used. In (C,D), unpaired t-tests were used to compare LPS-treated vs. RKI1447-pre-treated cells. Analyte samples with concentrations below the assay detection limit are shown in red and are assumed equivalent to 0 pg/mL to allow for statistical analysis. Error bars represent mean ± SEM; (* = p < 0.05, ** = p < 0.01, *** = p < 0.001, and **** = p < 0.0001). All ELISA experiments were normalized to MTS viability assays. Although the multiplex assay used in (C,D) also measured IL-4 and IFN-γ, no measurable analyte was observed and hence is not shown.
Figure 5
Figure 5
Y27632 or RKI1447 pretreatment in IMG cells blocks the dephosphorylation of cofilin. (A) Representative Western blots of whole-cell lysates of IMG cells 24 h after 10 ng/mL LPS challenge, with or without pretreatment of either Y27632 (100 μM) or RKI1447 (30 μM). Lysates were probed for p-cofilin (Ser-3), total cofilin, and GAPDH. (B,C) Quantification of the ratio of p-cofilin-to-cofilin in LPS vs. LPS + Y27632 (100 μM) (n = 3 or 4/group) (B) and LPS vs. RKI1447 (30 μM) (n = 4/group) (C). In both experiments, LPS significantly reduced the ratio of p-cofilin (inactive cofilin)-to-total cofilin. Y27632 and RKI1447 pretreatments restore the ratio to vehicle levels. (D) Schematic of cofilin activity induced by LPS challenge and inhibitory effects of Y27632 and RKI1447. One-way ANOVA with Tukey’s multiple comparisons was used for statistical analysis, with error bars representing mean ± SEM; ns = not significant, ** = p < 0.01, *** = p < 0.001, and **** = p < 0.0001.
Figure 6
Figure 6
RhoA activation in IMG cells is not sufficient to induce an inflammatory response but exacerbates that response in the presence of a submaximal LPS challenge. (A) Narciclasine (Narc) and Nogo-P4 are RhoA activators. (B) MTS assays of IMG cells treated with Nogo-P4 (i) and Narc (ii) were used to assess the toxicity of various concentrations of each peptide/compound (n = 3/group). (C) Schematic of experimental setup for D-G. (D) TNF-α (i) and IL-6 (ii) production in IMG cells treated with Nogo-P4, LPS, and Nogo-P4 + LPS combination. (n = 3/group). (E) MTS viability assay for Narc (50 nM) ± LPS (2 ng/mL) and Narc (50 nM) + LPS (2 ng/mL) + Y27632 (100 μM) or RKI1447 (10 μM). (n = 7 or 8/group). MTS OD values from (E) are the same as the samples analyzed in (F) and were used to normalize data in (i) and (ii). (F) TNF-α and IL-6 ELISA data from the same treatments shown in (E). (G) Representative confocal images (40× magnification) of IMG cells stained for phalloidin (filamentous actin) and DAPI from all treatment groups from (E,F) (scale bar = 50 μm). One-way ANOVA was used for (B,DF), with Dunnett’s and Tukey’s multiple comparison tests used, respectively, for the statistical analysis. Analyte samples with concentrations below the assay detection limit are shown in red and are assumed equivalent to 0 pg/mL to allow for statistical analysis. Error bars represent mean ± SEM. (ns = not significant, * = p < 0.05, ** = p < 0.01, and **** = p < 0.0001, with the color of the asterisks corresponding to the comparison group in (E,F)).
Figure 7
Figure 7
Y27632 and RKI1447 block NF-κB nuclear translocation and pro-inflammatory gene production in IMG cells. (A) Schematic of experimental timeline for (BD). (B) Representative confocal images of NF-κB immunoreactivity (red) and DAPI (nuclei, blue) in IMG cells following LPS (10 ng/mL) challenge ± pretreatment of RKI1447 (10 μM) or Y27632 (100 μM). White boxes represent insets shown in the bottom panel. (C) Average nuclear NF-κB signal per cell for treatments shown in B (n = 3). (D) All cells analyzed in C were combined into a single histogram to represent the overall treatment effect. (E) Inflammatory gene production (TNF-α, IL-6, and iNOS) in IMG cells at 24 h post-LPS treatment (10 ng/mL) was reduced by RKI1447 (10 μM) and Y27632 (100 μM) pretreatment (n = 3 or 4/group). One-way ANOVAs were used in (C,D) using Tukey’s and Dunnett’s (vs. LPS treatment) multiple comparison tests, respectively. Error bars represent mean ± SEM (ns = not significant, * = p < 0.05, ** = p < 0.01, and **** = p < 0.0001).
Figure 8
Figure 8
Both ROCK1 and ROCK2 inhibition may be necessary to block LPS-initiated inflammatory response. (A) ROCK1 and ROCK2 expression in IMG cells (normalized to β-actin expression). (B) ROCK1 and ROCK2 siRNAs are highly specific, significantly reducing their target genes (n = 3/group). (C) Representative confocal images of NF-κB immunoreactivity (red) and DAPI (blue) in IMG cells following pretreatment with 5 pmol (10 pmol total in each treatment) of their respective siRNA (ROCK1 + Scrambled, ROCK2 + Scrambled, ROCK 1 + ROCK 2, or Scrambled + Scrambled) ± LPS (2 ng/mL). The white boxes in the top panel are shown full size in the bottom panel. (D) Average nuclear NF-κB signal per cell for treatments shown in B (n = 3). (E) All cells analyzed in C were combined into a single histogram to represent the overall treatment effect. Media from treatment groups were analyzed for IL-6 (F) and TNF-α (G). ROCK1 and ROCK2 siRNA treatment significantly reduced IL-6 protein production from the IMG cells. For the comparisons in B, two-way ANOVAs with Tukey’s multiple comparison tests were used, and in (D,F,G), one-way ANOVAs with Dunnett’s (vs. Scrambled + LPS treatment) multiple comparison tests were used for statistical analyses. Error bars represent mean ± SEM (ns = not significant, * = p < 0.05, ** = p < 0.01, *** = p < 0.001, and **** = p < 0.0001).
Figure 9
Figure 9
Neurodegenerative microglia (MGnD) from aged (9 mo) APP/PS1 Alzheimer’s disease mice upregulate key inflammatory and RhoA signaling genes. Data from [41]. (A) WT microglia (from C57BL/J6 mice), Clec7a microglia (from APP/PS1 mice), and Clec7a+ neurodegenerative microglia (MGnD) (from APP/PS1 mice) differ in morphology. MGnD is associated with neuritic amyloid-β plaques, while Clec7a microglia from the same mice do not. (BE) Expression of fundamental genes involved in the RhoA signaling pathway (RHOA, ROCK1, ROCK2, CFL1) and (F,G) pro-inflammatory regulators (CCL3 and CCL4) are shown from the aforementioned microglia subtypes (n = 6/group). One-way ANOVAs were used with Tukey’s multiple comparison tests. Error bars represent mean ± SEM (ns = not significant, * = p < 0.05, ** = p < 0.01, and **** = p < 0.0001).

References

    1. Sierra A., Paolicelli R.C., Kettenmann H. Cien Años de Microglía: Milestones in a Century of Microglial Research. Trends Neurosci. 2019;42:778–792. doi: 10.1016/j.tins.2019.09.004. - DOI - PubMed
    1. Tang Y., Le W. Differential Roles of M1 and M2 Microglia in Neurodegenerative Diseases. Mol. Neurobiol. 2016;53:1181–1194. doi: 10.1007/s12035-014-9070-5. - DOI - PubMed
    1. Paolicelli R.C., Sierra A., Stevens B., Tremblay M.-E., Aguzzi A., Ajami B., Amit I., Audinat E., Bechmann I., Bennett M., et al. Microglia states and nomenclature: A field at its crossroads. Neuron. 2022;110:3458–3483. doi: 10.1016/j.neuron.2022.10.020. - DOI - PMC - PubMed
    1. Sastre A.A., Montoro M.L., Gálvez-Martín P., Lacerda H.M., Lucia A., Llavero F., Zugaza J.L. Small GTPases of the Ras and Rho Families Switch on/off Signaling Pathways in Neurodegenerative Diseases. Int. J. Mol. Sci. 2020;21:6312. doi: 10.3390/ijms21176312. - DOI - PMC - PubMed
    1. Roser A.-E., Tönges L., Lingor P. Modulation of Microglial Activity by Rho-Kinase (ROCK) Inhibition as Therapeutic Strategy in Parkinson’s Disease and Amyotrophic Lateral Sclerosis. Front. Aging Neurosci. 2017;9:94. doi: 10.3389/fnagi.2017.00094. - DOI - PMC - PubMed

Publication types

LinkOut - more resources