. 2023 May 17;12(10):1417.
doi: 10.3390/cells12101417.

Immunomodulatory Macrophages Enable E-MNC Therapy for Radiation-Induced Salivary Gland Hypofunction

Affiliations

Immunomodulatory Macrophages Enable E-MNC Therapy for Radiation-Induced Salivary Gland Hypofunction

Ryo Honma et al. Cells. .

Abstract

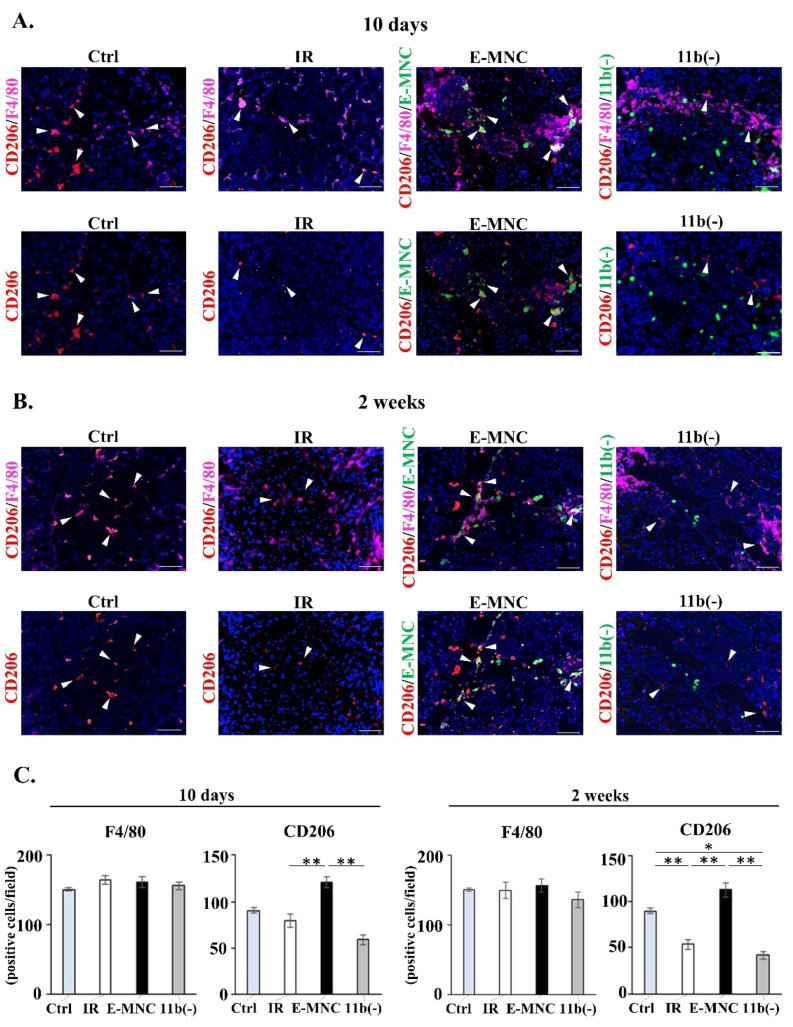
A newly developed therapy using effective-mononuclear cells (E-MNCs) is reportedly effective against radiation-damaged salivary glands (SGs) due to anti-inflammatory and revascularization effects. However, the cellular working mechanism of E-MNC therapy in SGs remains to be elucidated. In this study, E-MNCs were induced from peripheral blood mononuclear cells (PBMNCs) by culture for 5-7 days in medium supplemented with five specific recombinant proteins (5G-culture). We analyzed the anti-inflammatory characteristics of macrophage fraction of E-MNCs using a co-culture model with CD3/CD28-stimulated PBMNCs. To test therapeutic efficacy in vivo, either E-MNCs or E-MNCs depleted of CD11b-positive cells were transplanted intraglandularly into mice with radiation-damaged SGs. Following transplantation, SG function recovery and immunohistochemical analyses of harvested SGs were assessed to determine if CD11b-positive macrophages contributed to tissue regeneration. The results indicated that CD11b/CD206-positive (M2-like) macrophages were specifically induced in E-MNCs during 5G-culture, and Msr1- and galectin3-positive cells (immunomodulatory macrophages) were predominant. CD11b-positive fraction of E-MNCs significantly inhibited the expression of inflammation-related genes in CD3/CD28-stimulated PBMNCs. Transplanted E-MNCs exhibited a therapeutic effect on saliva secretion and reduced tissue fibrosis in radiation-damaged SGs, whereas E-MNCs depleted of CD11b-positive cells and radiated controls did not. Immunohistochemical analyses revealed HMGB1 phagocytosis and IGF1 secretion by CD11b/Msr1-positive macrophages from both transplanted E-MNCs and host M2-macrophages. Thus, the anti-inflammatory and tissue-regenerative effects observed in E-MNC therapy against radiation-damaged SGs can be partly explained by the immunomodulatory effect of M2-dominant macrophage fraction.

Keywords: cell therapy; macrophage; peripheral blood mononuclear cells; radiation-induced damage; salivary gland.


Conflict of interest statement

The authors declare no competing financial interests or personal relationships that could influence this research.

Figures

Figure 1
Figure 1
Schematic diagram of 5G-culture. Cultured PBMNCs were enriched in a population of CD11b-positive cells (M1- and specifically induced M2-macrophage-like cells).
Figure 2
Figure 2
Characteristics of human E-MNCs. (A) Phase contrast images of MNCs. White arrows indicate round-shaped macrophage-like cells. Scale bar: 200 µm. (B) Analysis with flow cytometry. FSC/SSC gated cells, and M1; CD11b+/CD206, M2; CD11b+/CD206+ macrophages among PBMNCs (day 0) and E-MNCs (day 7). (C) Flow cytometric analysis of FSC/SSC gated cells, and M1; CD11b+/CD206, M2; CD11b+/CD206+ macrophages among CD11b-positive and -negative cell fractions after sorting CD11b-postive cells of E-MNCs with MACS. (D) mRNA expression in CD3/CD28-stimulated PBMNCs after co-culture with E-MNCs and CD11b-positive cells and CD11b-negative cells (* p < 0.05, ** p < 0.01). (E) Phagocytosis assay with fluorescent beads. Flow cytometric analysis of FITC-expressing cells at 0, 1, 2, and 3 h after addition of fluorescent beads (right panel) in FSC/SSC gated cells of E-MNCs (left panel). (F) Phagocytosis assay with fluorescent beads. Phase-contrast and fluorescence microscopic images of macrophage-like round- and spindle-shaped cells among E-MNCs at 1 h. Green: fluorescent beads; blue: DAPI. Scale bar: 20 µm.
Figure 3
Figure 3
Characteristics of mouse E-MNCs. (A) Analysis of flow cytometry. M2; CD11b+/CD206+, M2c; CD11b+/Msr1+, and M2c; CCR2/galectin3+ macrophages among PBMNCs and E-MNCs. (B) Analysis of the characters of CD11b-positive E-MNCs. Double immunofluorescence staining of CD11b cells (green) for CD206, Msr1, or IGF1 (red). Blue: DAPI; negative Ctrl (control), no primary antibody. Scale bar: 50 µm.
Figure 4
Figure 4
Transplantation of E-MNCs or CD11b-negative E-MNCs into a prevention model. (A) Analysis of flow cytometry. M1; CD11b+/CD206) and M2; CD11b+/CD206+ macrophage fractions among PBMNCs, E-MNCs, CD11b-positive cells (red box area in E-MNCs), and CD11b-negative cells (yellow box area in E-MNCs), respectively. (B) Changes in saliva production (salivary flow rate; SFR) at 1, 2, 5, 9, and 13 weeks post-IR in each group. Lower graphs are scatter diagrams of SFR at specific time point (5, 9, and 13 weeks post-IR) for all groups (* p < 0.05, ** p < 0.01). (C) Concentrations of salivary EGF and HGF at 9 and 13 weeks post-IR (* p < 0.05, ** p < 0.01).
Figure 5
Figure 5
Fibrosis in submandibular glands after irradiation. (A) Histological analysis of submandibular glands at 9 weeks post-IR. Each panel shows representative images. Upper panels: HE staining; lower panels: Masson’s trichrome staining in each group. Fibrosis areas are stained blue. Scale bar: 200 µm. (B) Fibrosis area per field (%) in submandibular glands at 9 weeks (* p < 0.05, ** p < 0.01). (C) Histological analysis of submandibular glands at 13 weeks post-IR. Each panel shows representative images. Upper panels: HE staining; lower panels: Masson’s trichrome staining in each group in each group. Fibrosis areas are recognized as blue. Scale bar: 200 µm. (D) Percentage (%) of fibrosis area per field in submandibular glands at 13 weeks (* p < 0.05).
Figure 6
Figure 6
Gene expression in submandibular glands. (A,B) Expression of mRNAs of genes associated with proinflammation (IL-1β, IL-6, TLR2, TLR4), anti-inflammation (IL-10, CD206), tissue regeneration (IGF1), and fibrosis (TGFβ) in submandibular glands of nontreated (IR), E-MNC-treated, and CD11b(−)-treated mice at 10 days (A) and 2 weeks (B) of IR (* p < 0.05, ** p < 0.01).
Figure 7
Figure 7
Detection of M2-macrophages in submandibular glands at initial stages after transplantation. (A,B) Double-stained images of F4/80 (pink) and CD206 (red) (upper panel) and single-stained images of CD206 (red) (lower panel) in tissues at 10 days (A) and 2 weeks (B) in each group. White arrow: F4/80+/CD206+ M2-macrophages. Green: transplanted E-MNCs or CD11b(−) cells. Blue: DAPI. Scale bar: 50 µm. (C) Graphs show the number of F4/80- and CD206-expressing cells in submandibular glands at 10 days and 2 weeks post-IR (* p < 0.05, ** p < 0.01).
Figure 8
Figure 8
Detection of HMGB1 clearance in submandibular glands in the initial stages after transplantation. ((A,C) upper panel) Detection of released HMGB1 (red) in submandibular glands at 10 days (A) and 2 weeks (C) post-IR. Green: transplanted E-MNCs or CD11b(−) cells. Blue: DAPI. Scale bar: 50 µm. ((A,C) lower panel) Detection of Msr1-positive cells (M2c-macrophages) (pink) in submandibular glands at 10 days (A) and 2 weeks (C) post-IR. White arrow: Msr1-positive donor (EGFP+) cells. Green: transplanted E-MNCs or CD11b(−) cells. Blue: DAPI. Scale bar: 50 µm. (B,D) Merged images of HMGB1 (red) and Msr1 (pink) staining (yellow box areas in (A,C)) in E-MNC-injected SGs at 10 days (B) and 2 weeks (D) post-transplantation. White arrows: HMGB1+/Msr1+/EGFP+ E-MNCs. Blue: DAPI. Scale bar: 50 µm. (E) Graphs show the number of Msr1-positive cells in submandibular glands at 10 days or 2 weeks post-IR (* p < 0.05, ** p < 0.01). (F) Graph shows the concentration of HMGB1 in glands at 5 weeks (* p < 0.05, ** p < 0.01).
Figure 9
Figure 9
IGF1 production in phagocytic M2-macrophages in the initial stages after transplantation. (A,B) Detection of IGF1—(red) and Msr1 (pink)—expressing cells in gland tissues at 10 days (A) and 2 weeks (B) post-IR. Green: transplanted E-MNCs or CD11b(−) cells. White arrows: IGF1+/Msr1+/EGFP+ E-MNCs. Blue: DAPI. Scale bar: 50 µm. (C) Graphs show the number of IGF1-expressing cells in submandibular glands at 10 days or 2 weeks (* p < 0.05, ** p < 0.01).
Figure 10
Figure 10
C-Kit/Sca-1 expressions in gland tissues at 2 weeks of IR. (A) c-Kit (green)/Sca-1 (red) expressions in each group. White arrows: c-Kit+/Sca-1+ (ductal stem/progenitor) cells. Blue: DAPI. Scale bar: 50 µm. (B) Number of c-Kit/Sca-1-expressing cells in each group (* p < 0.05, ** p < 0.01).
Figure 11
Figure 11
Transplantation of E-MNCs or CD11b-negative E-MNCs into an established model of radiation injury to salivary glands. (A) Changes in saliva production (SFR) at 2, 5, 9, and 13 weeks post-IR in each group. Lower figures, scatter diagram of SFR of each specimen in all groups at 9 and 13 weeks (* p < 0.05, ** p < 0.01). (B,C) Histological analysis of submandibular glands at 9 weeks (B) and 13 weeks (C) post-IR. Each panel shows representative images. Upper panels: HE staining; and lower panels: Masson’s trichrome staining in each group. Areas of fibrosis are stained blue. Scale bar: 200 µm. (D) Percentage of fibrosis area per field in gland tissues at 9 weeks after IR (* p < 0.05, ** p < 0.01). (E) Percentage of fibrosis area per field in gland tissues at 13 weeks of IR (* p < 0.05).
Figure 12
Figure 12
Schematic diagram of the suggested mechanism of E-MNC treatment. CD11b-positive cells among E-MNCs might contribute to convert the condition of damaged tissue from a proinflammation to an anti-inflammation and promote tissue regeneration by mediating DAMP clearance and IGF1 production in cooperation with host macrophages.

References

    1. Vissink A., Burlage F.R., Spijkervet F.K.L., Jansma J., Coppes R.P. Prevention and treatment of the consequences of head and neck radiotherapy: A Critical Review. Oral. Biol. Med. 2003;14:213–225. - PubMed
    1. Dirix P., Nuyts S., Van den Bogaert W. Radiation-induced xerostomia in patients with head and neck cancer: A literature review. Cancer. 2006;107:2525–2534. doi: 10.1002/cncr.22302. - DOI - PubMed
    1. Rogers S.N., Ahad S.A., Murphy A.P. A structured review and theme analysis of papers published on ‘quality of life’ in head and neck cancer: 2000–2005. Oral. Oncol. 2007;43:843–868. doi: 10.1016/j.oraloncology.2007.02.006. - DOI - PubMed
    1. Jensen S.B., Vissink A., Limesand K.H., Reyland M.E. Salivary Gland Hypofunction and Xerostomia in Head and Neck Radiation Patients. J. Natl. Cancer Inst. Monogr. 2019;53:95–106. doi: 10.1093/jncimonographs/lgz016. - DOI - PubMed
    1. Mercadante V., Al Hamad A., Lodi G., Poter S., Fedele S. Interventions for the management of radiotherapy-induced xerostomia and hyposalivation: A systematic review and meta-analysis. Oral. Oncol. 2017;66:64–74. doi: 10.1016/j.oraloncology.2016.12.031. - DOI - PubMed

Publication types

LinkOut - more resources