Review
. 2023 May 25;50(3):163-173.
doi: 10.1159/000530458. eCollection 2023 Jun.

Big Data in Transfusion Medicine and Artificial Intelligence Analysis for Red Blood Cell Quality Control

Affiliations
Review

Big Data in Transfusion Medicine and Artificial Intelligence Analysis for Red Blood Cell Quality Control

Marcelle G M Lopes et al. Transfus Med Hemother. .

Abstract

Background: "Artificial intelligence" and "big data" increasingly take the step from just being interesting concepts to being relevant or even part of our lives. This general statement holds also true for transfusion medicine. Besides all advancements in transfusion medicine, there is not yet an established red blood cell quality measure, which is generally applied.

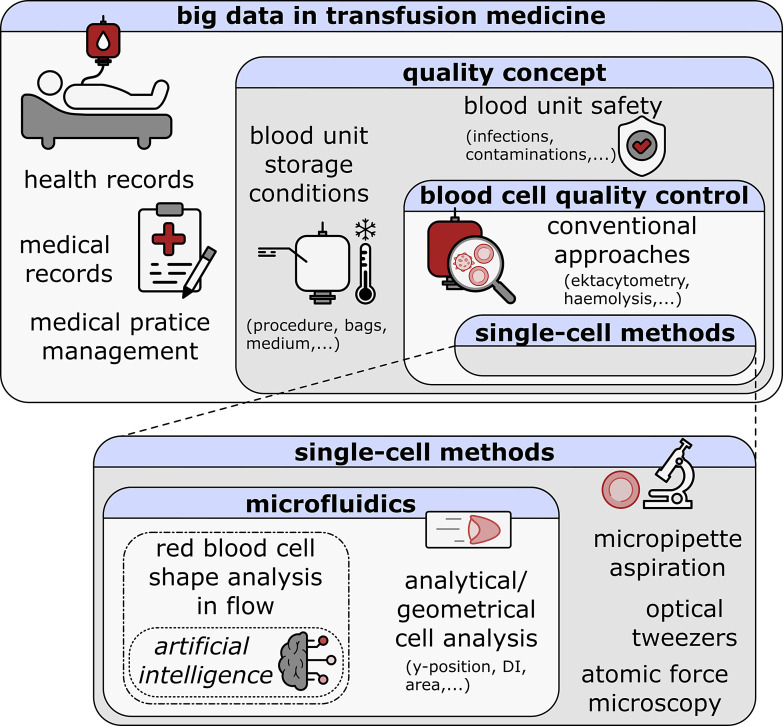
Summary: We highlight the usefulness of big data in transfusion medicine. Furthermore, we emphasize in the example of quality control of red blood cell units the application of artificial intelligence.

Key messages: A variety of concepts making use of big data and artificial intelligence are readily available but still await to be implemented into any clinical routine. For the quality control of red blood cell units, clinical validation is still required.

Keywords: Erysense; Personalized transfusion; Red blood cell quality; Storage lesion.


Conflict of interest statement

M.L. and S.Q. are employees of Cysmic GmbH, the manufacturer of Erysense, used for data generation presented in this study. In addition, S.R., G.S., S.Q., and L.K. are shareholders of Cysmic GmbH. H.E. and C.W. have no conflicts of interest to declare.

Figures

Fig. 1.
Fig. 1.
Schematic overview of big data in transfusion medicine. The Matryoshka-structured rectangles represent the concept of this review.
Fig. 2.
Fig. 2.
Metabolomics analyses of REDS-III samples . a An overview of the study design. b A breakdown of the number of patients enrolled in this arm of the study at four different blood centers (BCW; ITxM, Pittsburgh; ARC at Yale; University of California at San Francisco and BSRI). c The heat map shows the results from unsupervised hierarchical clustering of 599 samples based on metabolic phenotypes. A total of 242, 180, and 177 samples were predicted to belong to storage day 10, 23, and 42 categories, with only 8 samples misclassified as storage day 23 belonging to the day 10 and day 42 groups. d Partial least square discriminant analysis in dataset done after unblinding showing sample clustering based on storage time across principal component 1 (explaining 9.1% of the total variance). Of note, a clear subcluster was observed across PC2 (10.5% of the total variance. Color code: red – day 10 samples; green – day 23 samples; blue – day 42 samples. This figure is reproduced from D’Alessandro et al. . BCW, Blood Center of Wisconsin; ITxM, Institute for Transfusion Medicine; ARC, American Red Cross; BSRI, Blood Systems Research Institute.
Fig. 3.
Fig. 3.
Correlation between single RBC properties and parameters related to transfusion efficiency. a shows the change in transfusion-induced hemoglobin plotted against the percentage of low deformable cells for a total of 51 transfusions of 24 beta-thalassemia major patients. The hemoglobin concentration was determined immediately prior to and 10 min after completion of the transfusion. The correlation coefficient is R = −0.48, and the significance level is p = 0.0006. This panel is reproduced from Barshtein et al. . b shows the change of transfusion-induced skin blood flow vs. median RBC elongation ratio. The skin blood flow was determined with a Laser Doppler Imager (Aimago EAsyLDI, Switzerland) on the patient’s wrist immediately prior to and 10 min after completion of the transfusion. The correlation coefficient is R = 0.82, and the significance level is p = 0.00009. This panel is reproduced from Barshtein et al. .
Fig. 4.
Fig. 4.
Standard and artificial intelligence (AI)-based analysis of single-cell microfluidic flow behavior of stored RBCs. a Representative images of a croissant-shaped RBC (top) and a slipper-shaped RBC (bottom) in a microfluidic capillary with a height of H = 8 µm and width of W = 11 µm recorded by the Erysense technology. Based on these images, standard flow analysis can determine the RBC velocity, projection area, y-position, and deformability index DI. b Histogram and probability density functions (pdf) of the normalized RBC y-position for two donors at week one and week six after storage. c Characteristic healthy, pathological, and other RBC shapes during capillary flow. d AI-based assessment of RBCs during flow. RBC shape phase diagrams, i.e., the fraction of the RBC shape classes shown in c as a function of the RBC velocity for the same donors and points in time as for b. e Comparison of the standard (top) and AI-based (bottom) evaluation of donor-dependent changes in the RBC microcapillary flow behavior. Dashed black lines correspond to linear fits. Gray areas indicate an estimate of a 95% prediction interval. In the standard approach, the y-peak ratio describes the ratio between centered and off-centered RBCs concerning the channel center in the y-direction based on probability density functions (pdfs) at velocities between 7 mm/s and 10 mm/s. For the AI approach, the y-axis of e shows the logarithm of the fraction of pathological RBC shapes based on the shape phase diagrams of d. f Comparison of the coefficient of determination for the linear fits shown in e. Dashed lines connect data points for the same donor analyzed with the standard and the AI approach. This figure was reproduced from data presented by Recktenwald et al. .

References

    1. Landsteiner K. [Agglutination phenomena of normal human blood]. Wien Klin Wochenschr. 1901;113(20-21):768–9. - PubMed
    1. Bruun-Rasmussen P, Kragh Andersen P, Banasik K, Brunak S, Johansson PI. Intervening on the storage time of RBC units and its effects on adverse recipient outcomes using real-world data. Blood. 2022;139(25):3647–54. 10.1182/blood.2022015892. - DOI - PMC - PubMed
    1. Bruun-Rasmussen P, Andersen PK, Banasik K, Brunak S, Johansson PI. Estimating the effect of donor sex on red blood cell transfused patient mortality: a retrospective cohort study using a targeted learning and emulated trials-based approach. Eclinicalmedicine. 2022;51:101628. 10.1016/j.eclinm.2022.101628. - DOI - PMC - PubMed
    1. Pendry K. The use of big data in transfusion medicine. Transfus Med. 2015;25(3):129–37. 10.1111/tme.12223. - DOI - PubMed
    1. Reisman M. EHRs: the challenge of making electronic data useable and interoperable. P T. 2017;42(9):572–5. - PMC - PubMed