. 2021:9:737374.
doi: 10.3389/fphy.2021.737374. Epub 2021 Sep 16.

Multidimensional MRI for Characterization of Subtle Axonal Injury Accelerated Using an Adaptive Nonlocal Multispectral Filter

Affiliations

Multidimensional MRI for Characterization of Subtle Axonal Injury Accelerated Using an Adaptive Nonlocal Multispectral Filter

Dan Benjamini et al. Front Phys. 2021.

Abstract

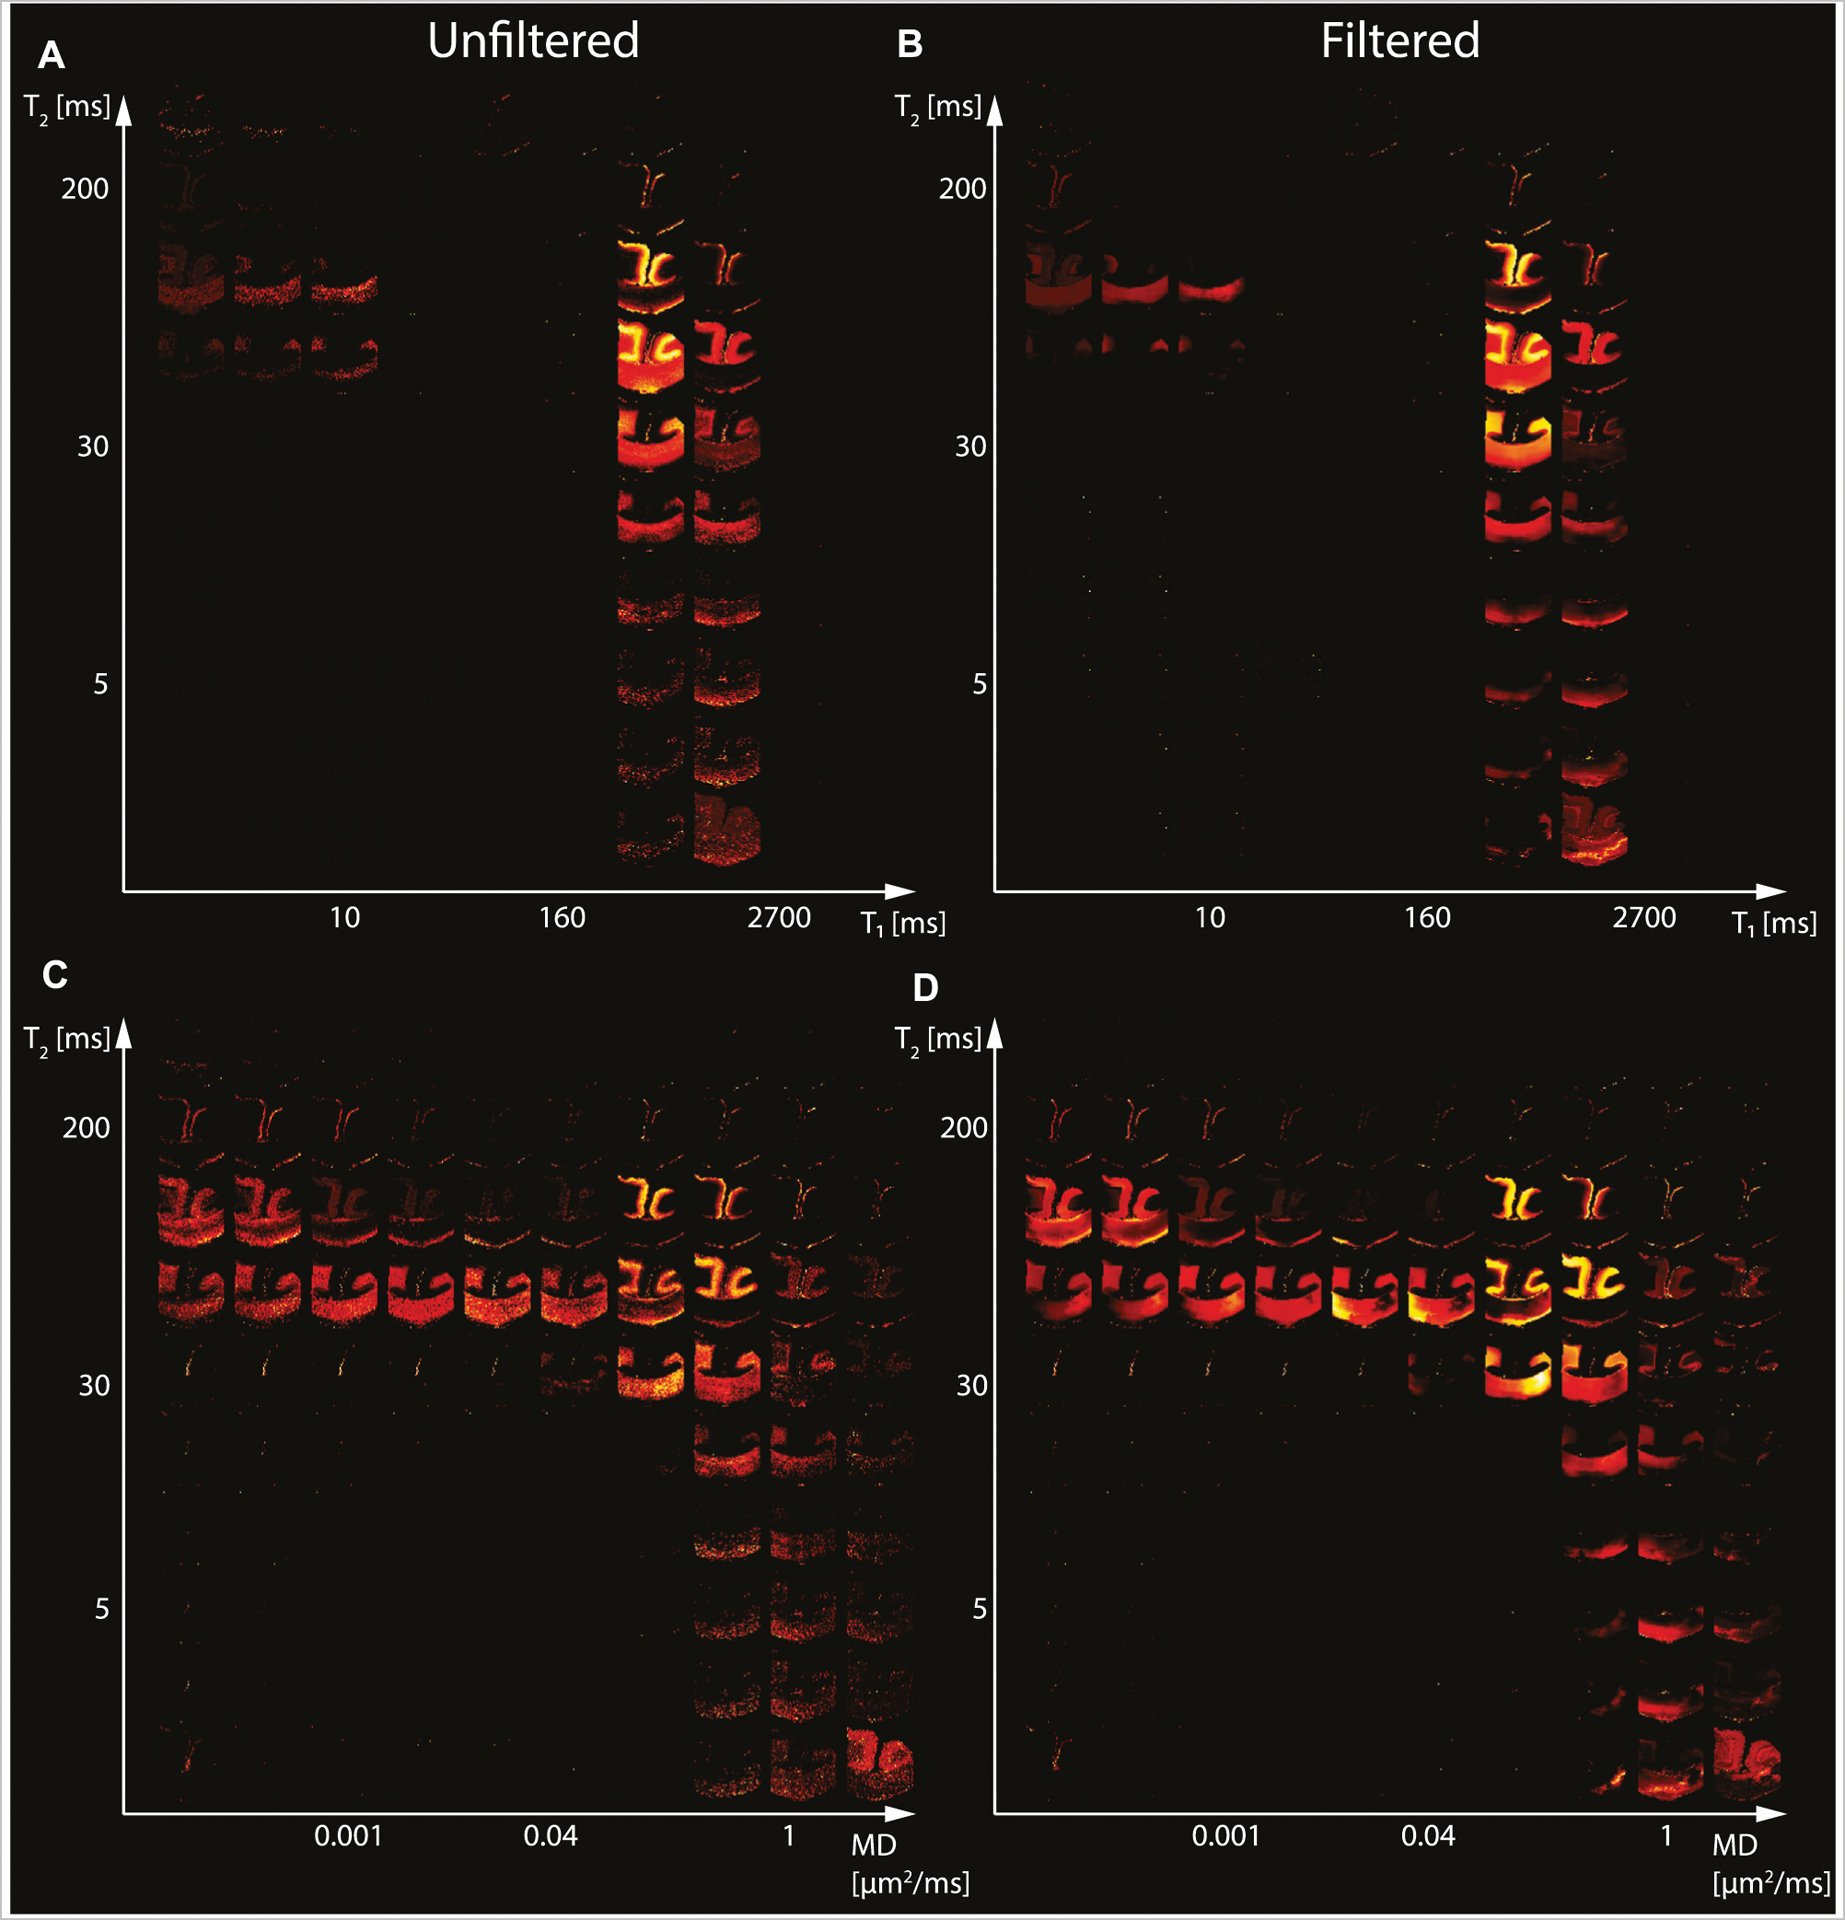
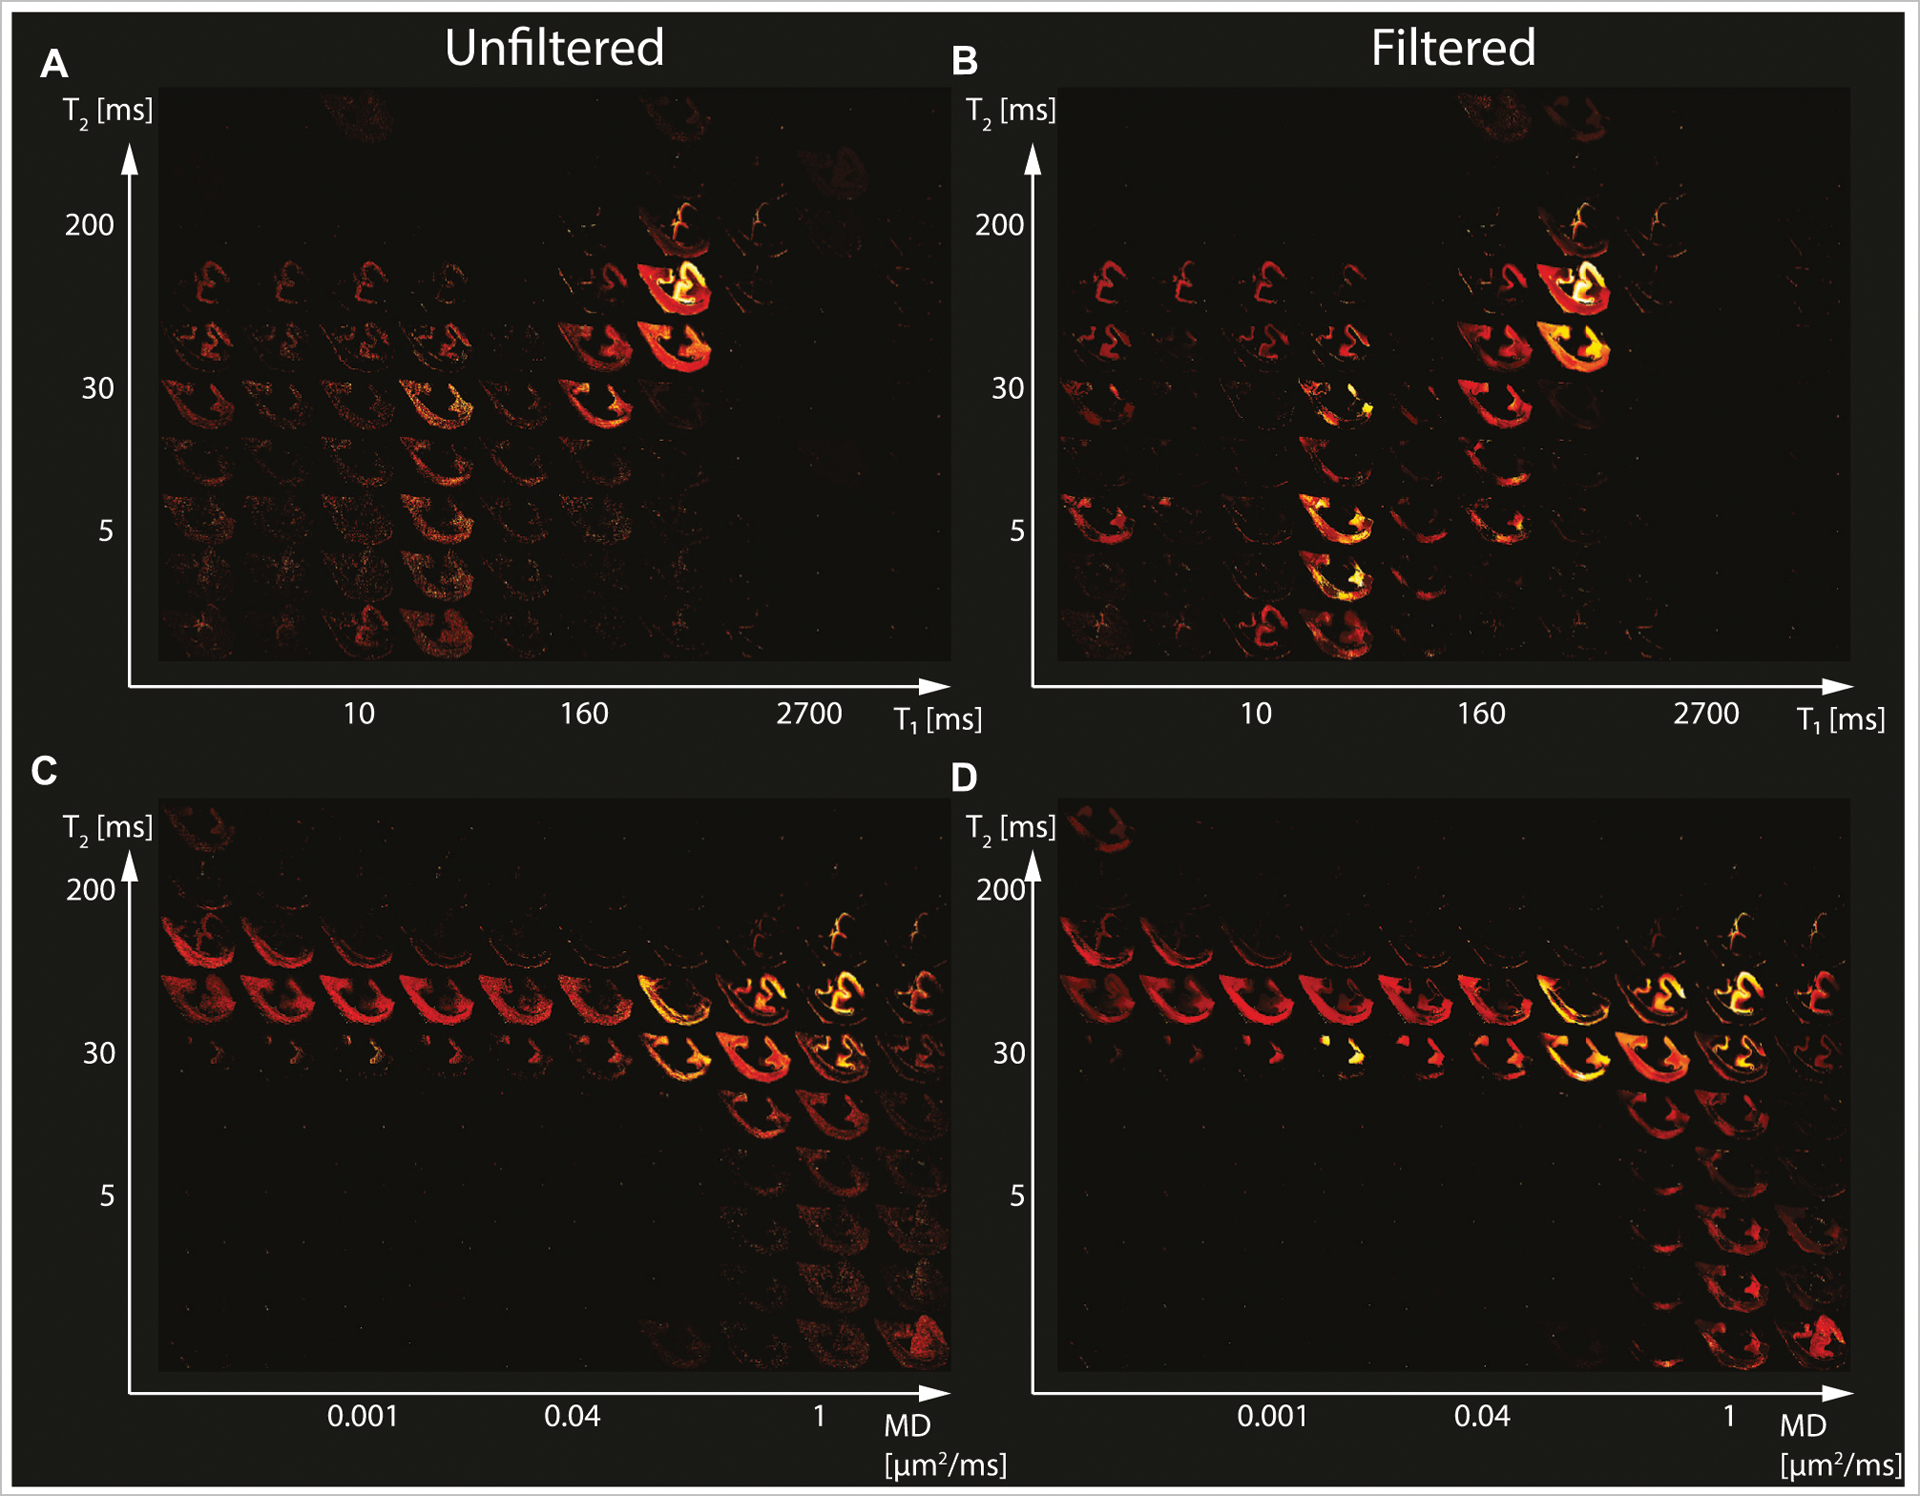
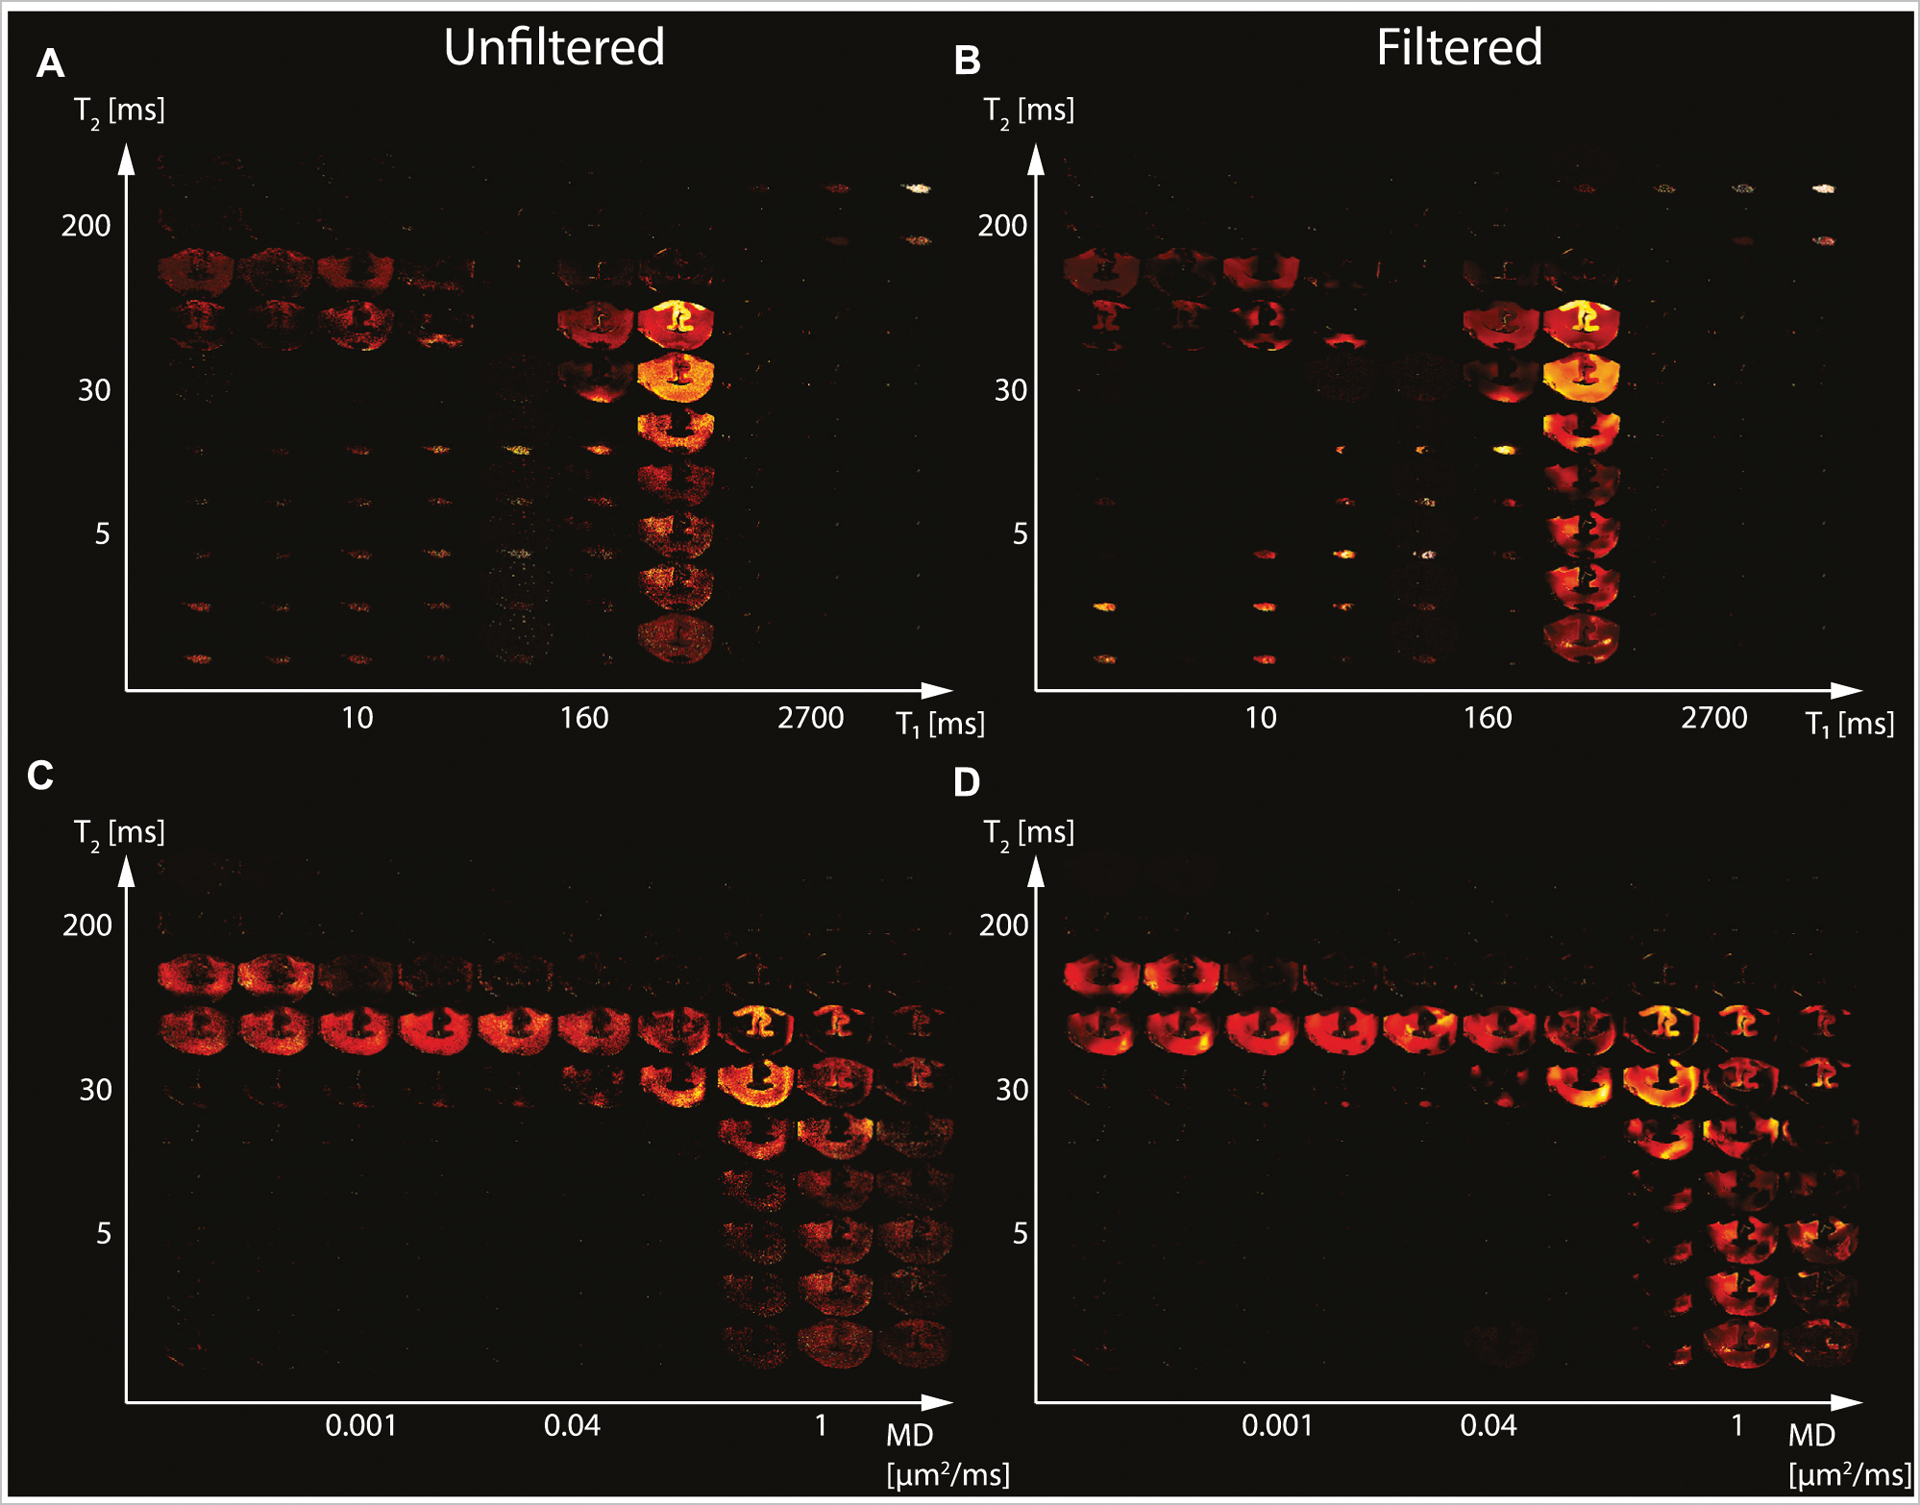
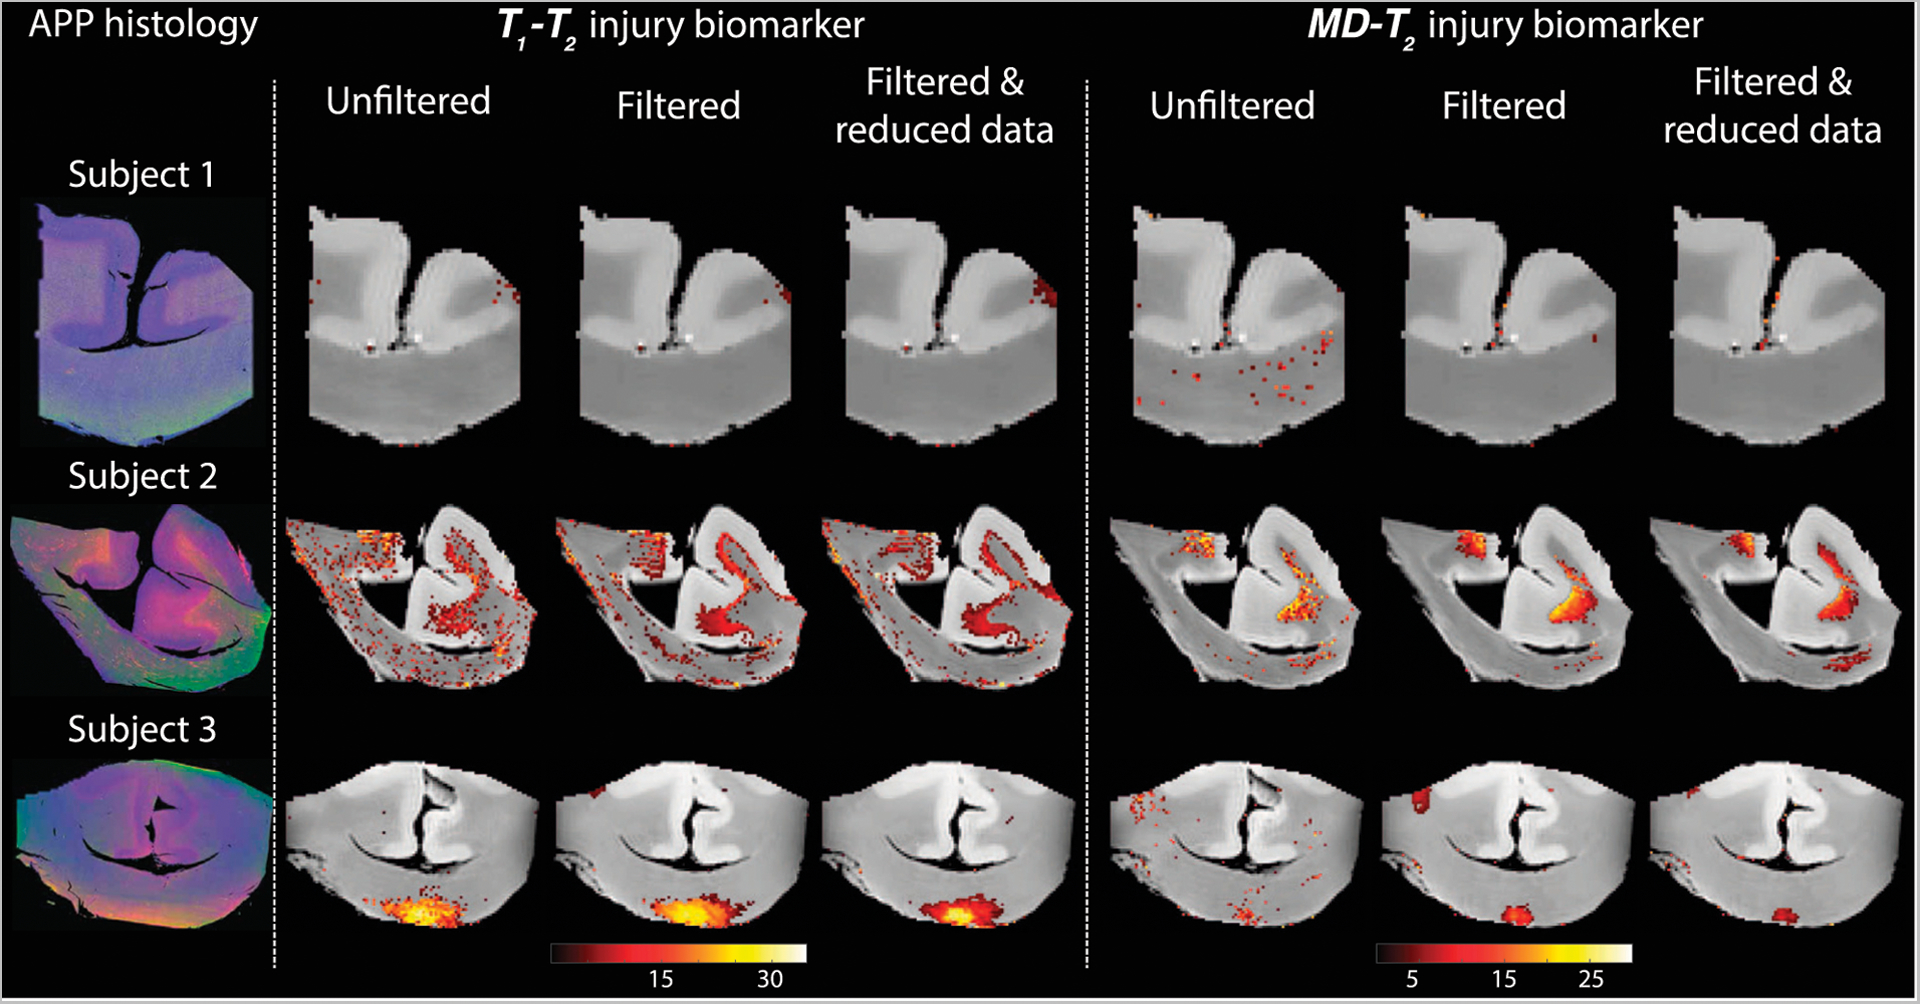
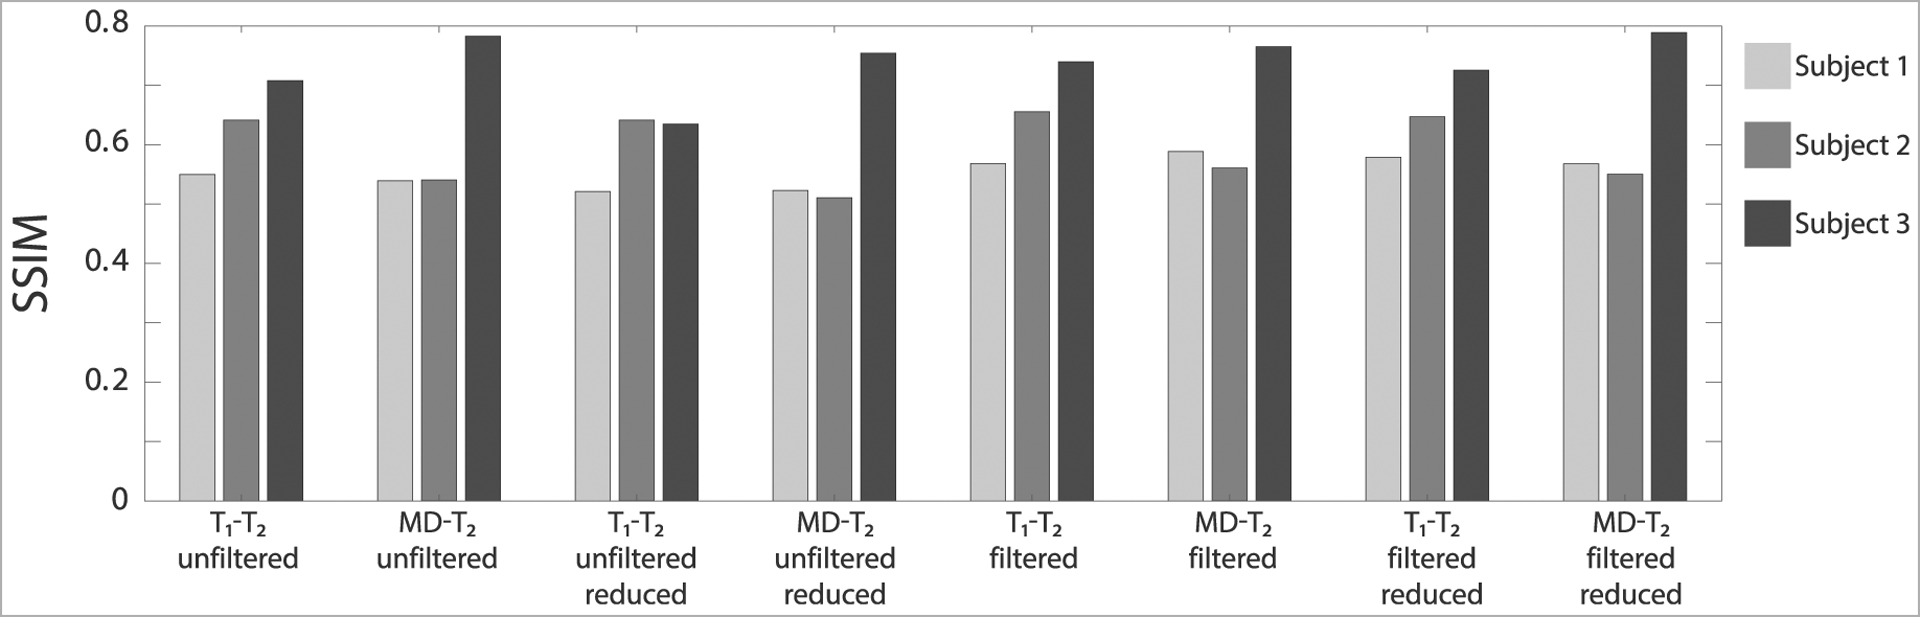
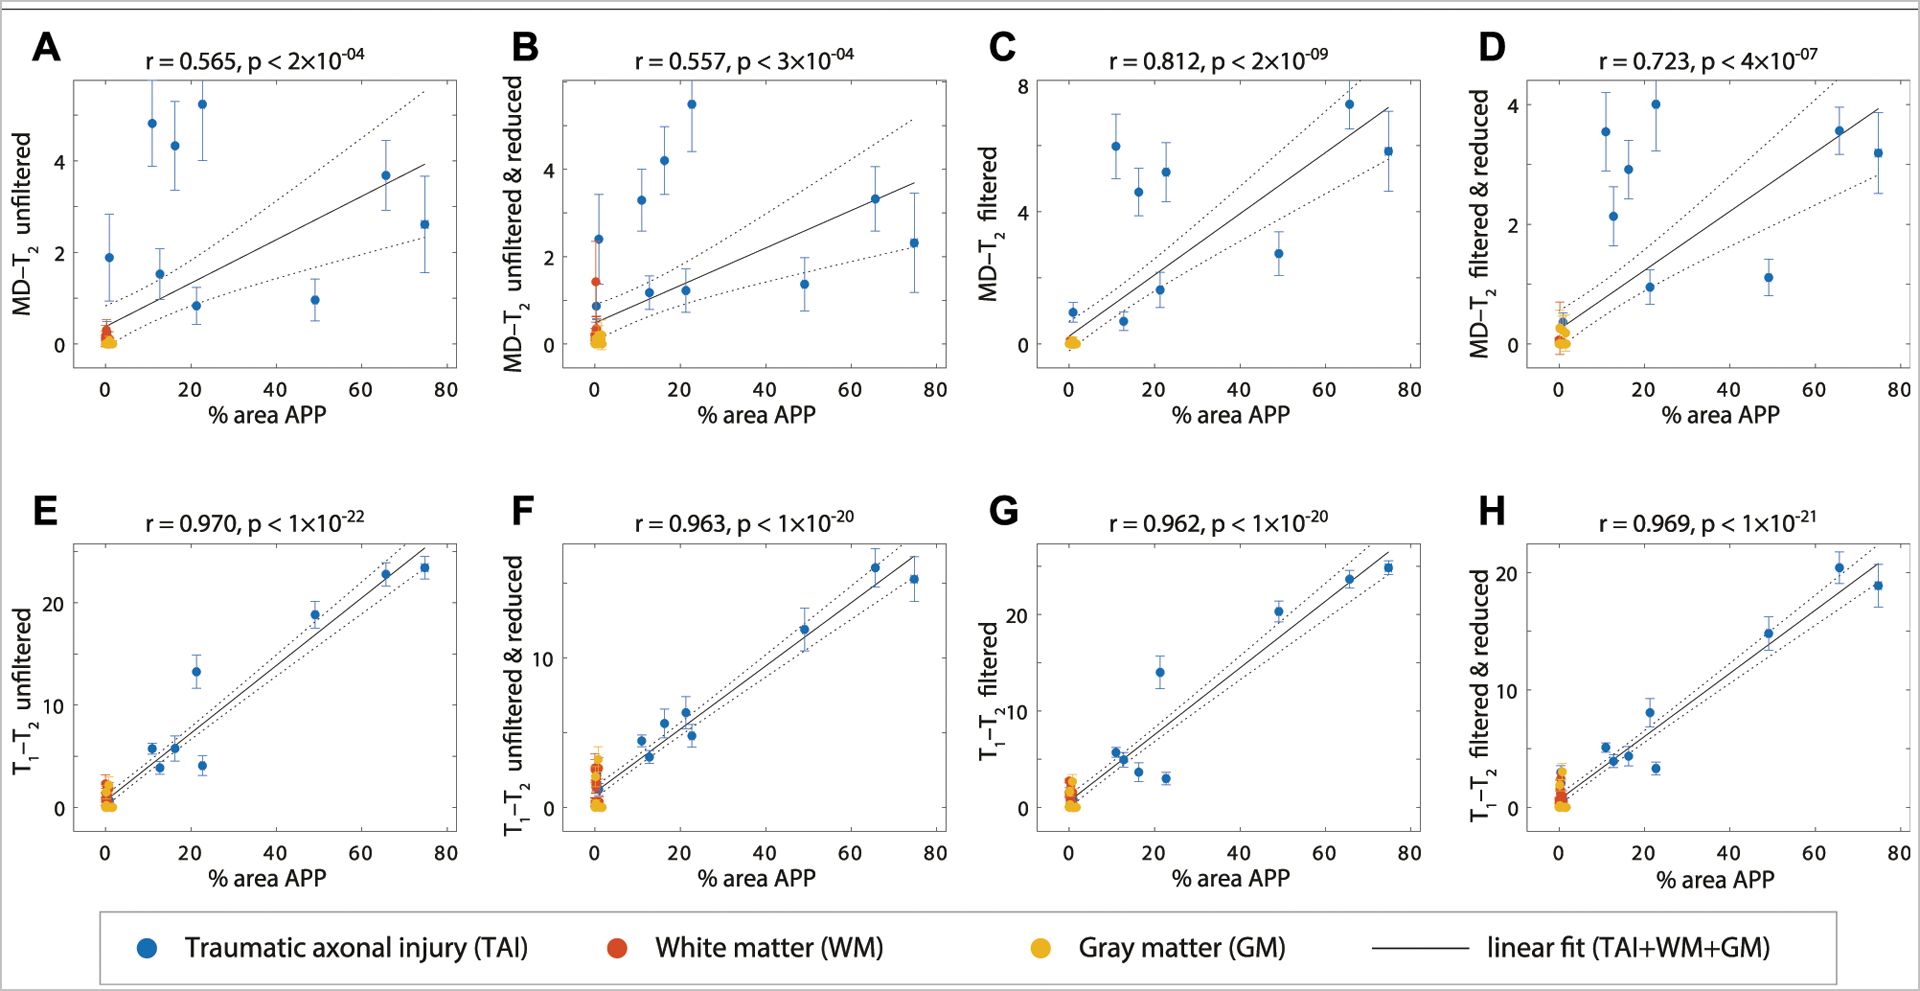
Multidimensional MRI is an emerging approach that simultaneously encodes water relaxation (T1 and T2) and mobility (diffusion) and replaces voxel-averaged values with subvoxel distributions of those MR properties. While conventional (i.e., voxel-averaged) MRI methods cannot adequately quantify the microscopic heterogeneity of biological tissue, using subvoxel information allows to selectively map a specific T1-T2-diffusion spectral range that corresponds to a group of tissue elements. The major obstacle to the adoption of rich, multidimensional MRI protocols for diagnostic or monitoring purposes is the prolonged scan time. Our main goal in the present study is to evaluate the performance of a nonlocal estimation of multispectral magnitudes (NESMA) filter on reduced datasets to limit the total acquisition time required for reliable multidimensional MRI characterization of the brain. Here we focused and reprocessed results from a recent study that identified potential imaging biomarkers of axonal injury pathology from the joint analysis of multidimensional MRI, in particular voxelwise T1-T2 and diffusion-T2 spectra in human Corpus Callosum, and histopathological data. We tested the performance of NESMA and its effect on the accuracy of the injury biomarker maps, relative to the co-registered histological reference. Noise reduction improved the accuracy of the resulting injury biomarker maps, while permitting data reduction of 35.7 and 59.6% from the full dataset for T1-T2 and diffusion-T2 cases, respectively. As successful clinical proof-of-concept applications of multidimensional MRI are continuously being introduced, reliable and robust noise removal and consequent acquisition acceleration would advance the field towards clinically-feasible diagnostic multidimensional MRI protocols.

Keywords: MRI; NESMA; axonal injury; diffusion; multidimensional; multispectral nonlocal filtering; relaxation; traumatic brain injury.


Conflict of interest statement

Conflict of Interest: The authors declare that the research was conducted in the absence of any commercial or financial relationships that could be construed as a potential conflict of interest.

Figures

FIGURE 1 |
FIGURE 1 |
Maps of 2D probability density functions (i.e., 2D normalized spectra) from Subject 1 (control) of (A) unfiltered and (B) filtered subvoxel T1-T2 values reconstructed on a 10 × 10 grid of subvoxel T1 values (horizontal axes) and subvoxel T2 values (vertical axes), and maps of (C) unfiltered and (D) filtered subvoxel MD-T2 values reconstructed on a 10 × 10 grid of subvoxel MD values (horizontal axes) and subvoxel T2 values (vertical axes).
FIGURE 2 |
FIGURE 2 |
Maps of 2D probability density functions (i.e., 2D normalized spectra) from Subject 2 (TBI) of (A) unfiltered and (B) filtered subvoxel T1-T2 values reconstructed on a 10 × 10 grid of subvoxel T1 values (horizontal axes) and subvoxel T2 values (vertical axes), and maps of (C) unfiltered and (D) filtered subvoxel MD-T2 values reconstructed on a 10 × 10 grid of subvoxel MD values (horizontal axes) and subvoxel T2 values (vertical axes).
FIGURE 3 |
FIGURE 3 |
Maps of 2D probability density functions (i.e., 2D normalized spectra) from Subject 3 (TBI) of (A) unfiltered and (B) filtered subvoxel T1-T2 values reconstructed on a 10 × 10 grid of subvoxel T1 values (horizontal axes) and subvoxel T2 values (vertical axes), and maps of (C) unfiltered and (D) filtered subvoxel MD-T2 values reconstructed on a 10 × 10 grid of subvoxel MD values (horizontal axes) and subvoxel T2 values (vertical axes).
FIGURE 4 |
FIGURE 4 |
Histological images and multidimensional MR-derived injury biomarker maps of three representative cases, and under different conditions (left to right: unfiltered, filtered, and filtered and reduced data). Deconvolved histological APP images (co-registered with the MRI) are shown on the left panel, red = APP stain (top to bottom: control, and two TBI cases). All multidimensional injury maps were thresholded at 10% of the maximal intensity and overlaid on grayscale proton density images. Multidimensional injury maps of Subject 1 (control) show absent of significant injury under all experimental conditions. Multidimensional injury maps of Subject 2 (TBI) show substantial injury along the white-gray matter interface under all experimental conditions. Multidimensional injury maps of Subject 3 (TBI) show substantial injury at the bottom of the CC under all experimental conditions.
FIGURE 5 |
FIGURE 5 |
The structural similarity index (SSIM) values between the injury biomarker images under the different experimental conditions (e.g., T1-T2 unfiltered, MD-T2 filtered reduced data) and the co-registered APP density histological image as reference. The three bars at each condition represent the different Subjects (blue = Subject 1, red = Subject 2, and yellow = Subject 3).
FIGURE 6 |
FIGURE 6 |
APP density (% area) from 36 tissue regions (APP-positive regions from each TBI case, WM and GM regions), and its correlation with injury biomarker parameter under different experimental conditions. Individual data points represent the mean ROI value from each post-mortem tissue sample. Scatterplots of the mean (with 95% confidence interval error bars) % area APP and (A) MD-T2 unfiltered (B) MD-T2 unfiltered and reduced (C) MD-T2 filtered (D) MD-T2 filtered and reduced (E) T1-T2 unfiltered (F) T1-T2 unfiltered and reduced (G) T1-T2 filtered, and (H) T1-T2 filtered and reduced, show positive and significant correlation with APP density.

References

    1. English AE, Whittall KP, Joy MLG, and Henkelman RM. Quantitative Two-Dimensional Time Correlation Relaxometry. Magn Reson Med (1991) 22: 425–34. doi:10.1002/mrm.1910220250 - DOI - PubMed
    1. Hürlimann MD, Flaum M, Venkataramanan L, Flaum C, Freedman R, and Hirasaki GJ. Diffusion-relaxation Distribution Functions of Sedimentary Rocks in Different Saturation States. Magn Reson Imaging (2003) 21: 305–10. doi:10.1016/s0730-725x(03)00159-0 - DOI - PubMed
    1. Topgaard D Multidimensional Diffusion MRI. J Magn Reson (2017) 275: 98–113. doi:10.1016/j.jmr.2016.12.007 - DOI - PubMed
    1. Benjamini D, and Basser PJ. Multidimensional Correlation MRI. NMR Biomed (2020) 33:e4226. doi:10.1002/nbm.4226 - DOI - PMC - PubMed
    1. de Almeida Martins JP, and Topgaard D. Two-Dimensional Correlation of Isotropic and Directional Diffusion Using NMR. Phys Rev Lett (2016) 116: 087601. doi:10.1103/PhysRevLett.116.087601 - DOI - PubMed

LinkOut - more resources