. 2023 May 8;4(6):100741.
doi: 10.1016/j.patter.2023.100741. eCollection 2023 Jun 9.

Application of Aligned-UMAP to longitudinal biomedical studies

Affiliations

Application of Aligned-UMAP to longitudinal biomedical studies

Anant Dadu et al. Patterns (N Y). .

Abstract

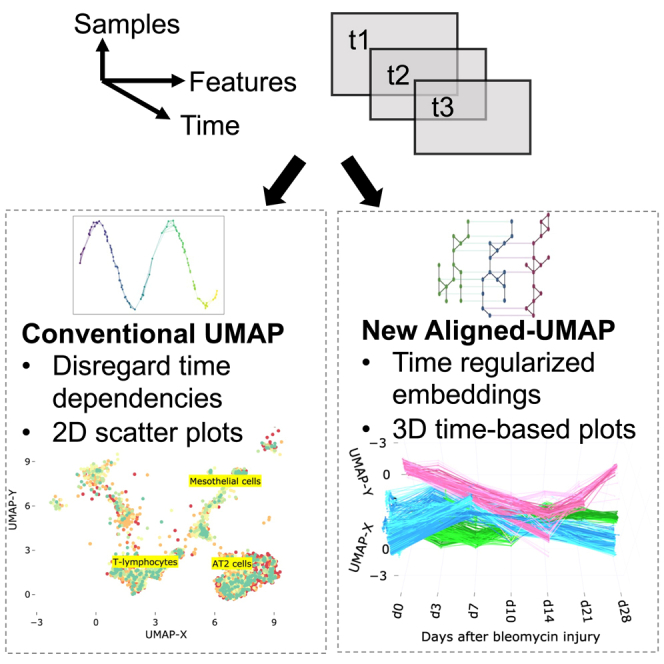
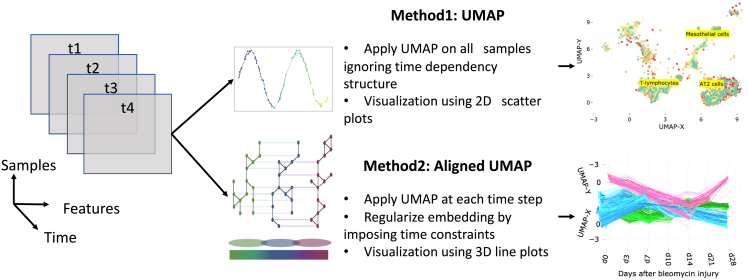
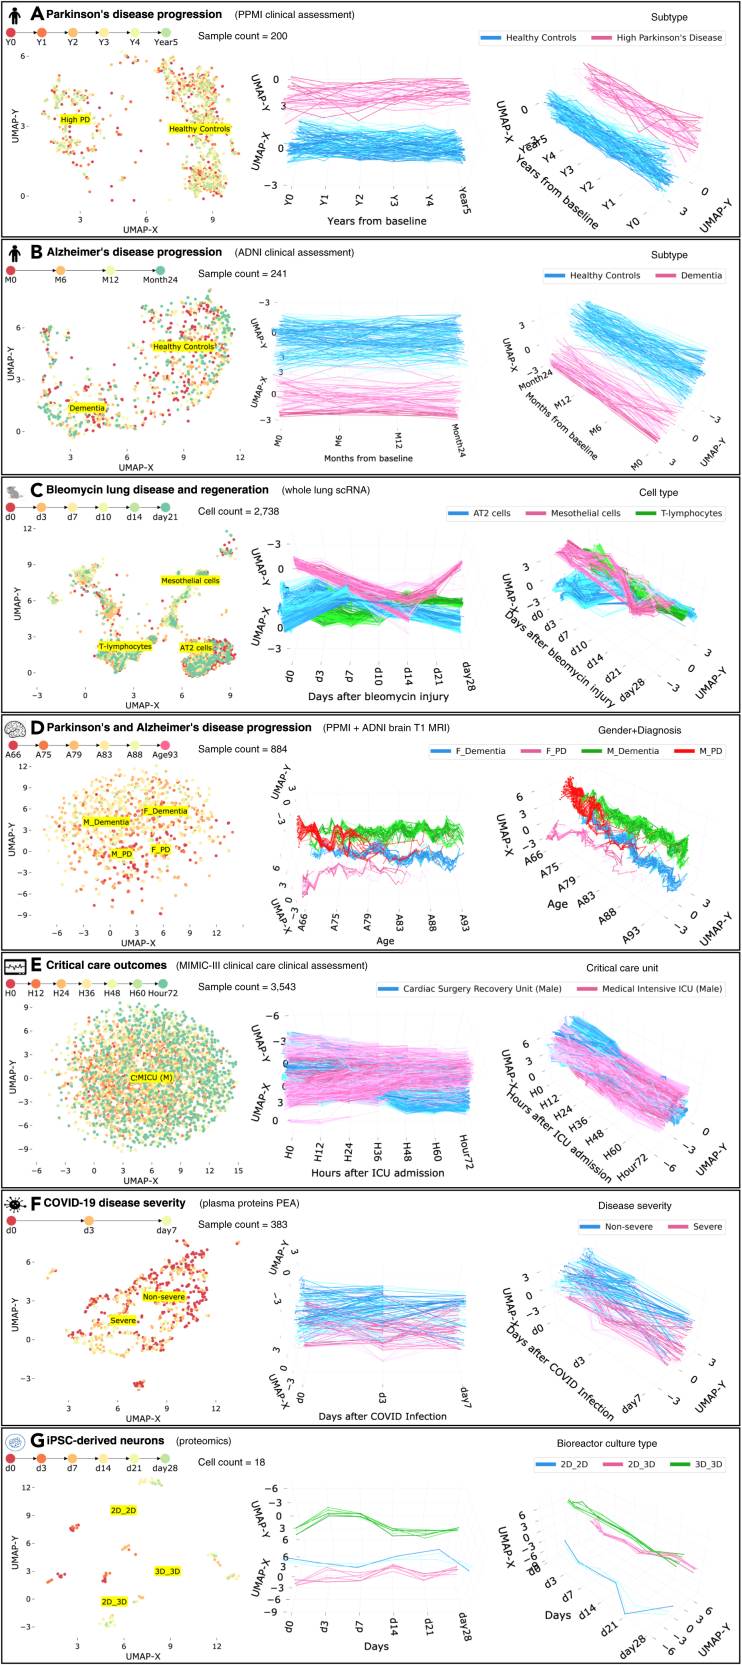
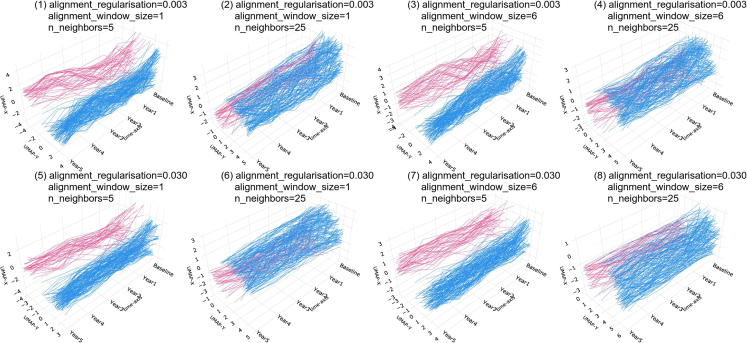
High-dimensional data analysis starts with projecting the data to low dimensions to visualize and understand the underlying data structure. Several methods have been developed for dimensionality reduction, but they are limited to cross-sectional datasets. The recently proposed Aligned-UMAP, an extension of the uniform manifold approximation and projection (UMAP) algorithm, can visualize high-dimensional longitudinal datasets. We demonstrated its utility for researchers to identify exciting patterns and trajectories within enormous datasets in biological sciences. We found that the algorithm parameters also play a crucial role and must be tuned carefully to utilize the algorithm's potential fully. We also discussed key points to remember and directions for future extensions of Aligned-UMAP. Further, we made our code open source to enhance the reproducibility and applicability of our work. We believe our benchmarking study becomes more important as more and more high-dimensional longitudinal data in biomedical research become available.

Keywords: Alzheimer's disease; Parkinson's disease; clinical data; genomics; iPSC; longitudinal data; machine learning; proteomics; time-series; unsupervised learning.


Conflict of interest statement

A.D., H.I., M.A.N., and F.F. declare the following competing financial interests, as their participation in this project was part of a competitive contract awarded to Data Tecnica International, LLC, by the NIH to support open science research. M.A.N. also currently serves on the scientific advisory board for Character Bio and is an advisor to Neuron23, Inc. The study’s funders had no role in the study design, data collection, data analysis, data interpretation, or writing of the report. All authors and the public can access all data and statistical programming code used in this project for the analyses and results generation. F.F. takes final responsibility for the decision to submit the paper for publication.

Figures

None
Graphical abstract
Figure 1
Figure 1
The workflow of analysis and model development
Figure 2
Figure 2
Low-dimensional embeddings by UMAP and Aligned-UMAP dimensionality reduction algorithms on longitudinal biomedical datasets from multiple modalities (A) The distinction between Parkinson’s disease subjects (with rapid progressors) and healthy controls from 122 clinical measurements collected over 5 years from Parkinson’s Progression Markers Initiative (PPMI) study. Measures include MoCA scores and MDS-Unified Parkinson’s Disease Rating Scale scores. (B) Trajectories of dementia and healthy control subjects on 78 clinical measurements collected over 2 years from the Alzheimer’s Disease Neuroimaging Initiative (ADNI) study. Measurements include Mini-Mental State Exam (MMSE) scores and Alzheimer’s Disease Assessment Scale-Cognitive Subscale (ADAS-COG) tests. (C) Aligned-UMAP trajectories show shifts in specific cell types (such as mesothelial and AT2 cells) in gene expression space during the regeneration time course of mice having bleomycin lung injury. (D) Aligned-UMAP embeddings depict aging patterns for patients with dementia and Parkinson’s disease, stratified by gender. (E) Trajectories of the subjects admitted in different critical care units of the MIMIC-III database. Measurements include vital signs such as blood pressure, oxygen levels, and ICD-9 diagnosis codes. (F) Embedding space depicts the severity of COVID-19 disease from 1,463 unique plasma proteins measured by proximity extension assay using the Olink platform. The cutoff at day 3 is visible because of data unavailability at day 7 due to either patient recovery or death. (G) Aligned-UMAP low-dimensional space identified the cell culture environment of iPSC-derived neurons using longitudinal proteomic data for more than 8,000 proteins. Note: we apply the Aligned-UMAP algorithm on the dataset having characteristics shown in Table 1. In this figure, we have demonstrated a subset of classes for better visualization purposes. For more detailed analysis, users can explore our public web application.
Figure 3
Figure 3
Effect of hyperparameters of Aligned-UMAP on the PPMI clinical dataset The alignment regularization is varied for [0.003, 0.03], alignment window size from [1, 6], and number of neighbors from [5, 25]. We could observe that an increase in the number of neighbors increases the size of visible clusters (1, 2). Alignment regularization and alignment window size are parameters of Aligned-UMAP that controls the volatility of trajectories. Higher values for alignment regularization will keep the related embeddings closer (1, 5), and alignment window size captures how far forward and backward across the datasets we look at when doing alignment (1, 3).
Figure 4
Figure 4
Execution time for input datasets of varying sizes (A) Comparison of Aligned-UMAP on multiple datasets. (B) Comparison of Aligned-UMAP with UMAP on whole-lung scRNA dataset. All experiments are conducted on a 128 GB RAM machine utilizing a different number of cores (marker symbol).

References

    1. Jolliffe I.T., Cadima J. Principal component analysis: a review and recent developments. Philos. Trans. A Math. Phys. Eng. Sci. 2016;374:20150202. doi: 10.1098/rsta.2015.0202. - DOI - PMC - PubMed
    1. McInnes L., Healy J., Melville J. UMAP: Uniform manifold approximation and projection for dimension reduction. arXiv. 2018 doi: 10.48550/arXiv.1802.03426. Preprint at. - DOI
    1. Becht E., McInnes L., Healy J., Dutertre C.-A., Kwok I.W.H., Ng L.G., Ginhoux F., Newell E.W. Dimensionality reduction for visualizing single-cell data using UMAP. Nat. Biotechnol. 2018;37:38–44. doi: 10.1038/nbt.4314. - DOI - PubMed
    1. Diaz-Papkovich A., Anderson-Trocmé L., Gravel S. A review of UMAP in population genetics. J. Hum. Genet. 2021;66:85–91. doi: 10.1038/s10038-020-00851-4. - DOI - PMC - PubMed
    1. Koretsky M.J., Alvarado C., Makarious M.B., Vitale D., Levine K., Bandres-Ciga S., Dadu A., Scholz S.W., Sargent L., Faghri F., et al. Genetic risk factor clustering within and across neurodegenerative diseases. medRxiv. 2022 doi: 10.1101/2022.12.01.22282945. Preprint at. - DOI - PMC - PubMed

LinkOut - more resources