. 2023 Jun 20:14:1199374.
doi: 10.3389/fimmu.2023.1199374. eCollection 2023.

Novel microRNAs modulating ecto-5'-nucleotidase expression

Affiliations

Novel microRNAs modulating ecto-5'-nucleotidase expression

Theresa Kordaß et al. Front Immunol. .

Abstract

Introduction: The expression of immune checkpoint molecules (ICMs) by cancer cells is known to counteract tumor-reactive immune responses, thereby promoting tumor immune escape. For example, upregulated expression of ecto-5'-nucleotidase (NT5E), also designated as CD73, increases extracellular levels of immunosuppressive adenosine, which inhibits tumor attack by activated T cells. MicroRNAs (miRNAs) are small non-coding RNAs that regulate gene expression at the post-transcriptional level. Thus, the binding of miRNAs to the 3'-untranslated region of target mRNAs either blocks translation or induces degradation of the targeted mRNA. Cancer cells often exhibit aberrant miRNA expression profiles; hence, tumor-derived miRNAs have been used as biomarkers for early tumor detection.

Methods: In this study, we screened a human miRNA library and identified miRNAs affecting the expression of ICMs NT5E, ENTPD1, and CD274 in the human tumor cell lines SK-Mel-28 (melanoma) and MDA-MB-231 (breast cancer). Thereby, a set of potential tumor-suppressor miRNAs that decreased ICM expression in these cell lines was defined. Notably, this study also introduces a group of potential oncogenic miRNAs that cause increased ICM expression and presents the possible underlying mechanisms. The results of high-throughput screening of miRNAs affecting NT5E expression were validated in vitro in 12 cell lines of various tumor entities.

Results: As result, miR-1285-5p, miR-155-5p, and miR-3134 were found to be the most potent inhibitors of NT5E expression, while miR-134-3p, miR-6859-3p, miR-6514-3p, and miR-224-3p were identified as miRNAs that strongly enhanced NT5E expression levels.

Discussion: The miRNAs identified might have clinical relevance as potential therapeutic agents and biomarkers or therapeutic targets, respectively.

Keywords: CD274; ENTPD1; NT5E/CD73; breast cancer; melanoma; miRNAs.


Conflict of interest statement

The authors declare that the research was conducted in the absence of any commercial or financial relationships that could be construed as a potential conflict of interest.

Figures
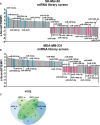
Figure 1
Figure 1
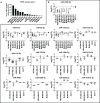
Comprehensive microRNA (miRNA) library screen reveals miRNAs affecting ecto-5′-nucleotidase (NT5E) surface expression in human tumor cell lines. The human melanoma cell line SK-Mel-28 (A) and human breast cancer cell line MDA-MB-231 (B) were transfected with a human miRNA library and changes in NT5E surface expression was measured by flow cytometry 72 h post transfection. The median fluorescence intensity values (MFI) were z-score normalized for each plate. Z-Scores ≥│1.645│ were considered as significant changes. Modulating miRNAs selected for further validation are depicted in turquois (enhancing NT5E expression) and magenta (decreasing NT5E expression). (C) Venn diagram of miRNAs with significant effects on NT5E surface expression in MDA-MB-231 (MB231) and SK-Mel-28 (SK28) cells used for the screen. miRNAs showing significant effects in both cell lines are depicted.
Figure 2
Figure 2
Validation of NT5E downregulating miRNAs by flow cytometry. (A) The basal NT5E surface expression level of cell lines used for the validation of the screen results are listed from high to low expressing cell lines. MFI values were normalized to the respective isotype control. (B) Effect of the selected miRNAs inhibiting NT5E surface expression was confirmed in independent transfection experiments. Each dot represents an independent experiment. Fold changes in MFI were calculated compared to the respective mimic control-1 samples. Mean ± SD are shown. Significance was assessed by one-sample T-test. *p < 0.05; **p < 0.01; ***p < 0.001; ****p < 0.0001.
Figure 3
Figure 3
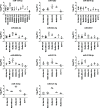
Validation of NT5E upregulating miRNAs by flow cytometry. The effect of the selected NT5E enhancing miRNAs from the library screen was confirmed in independent transfection experiments. Each dot represents an independent experiment. Fold changes in MFI were calculated compared to the respective mimic control-1 samples. Mean ± SD are shown. Significance was assessed by one-sample T-test. *p < 0.05; **p < 0.01; ***p < 0.001; ****p < 0.0001.
Figure 4
Figure 4
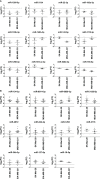
Validation of miRNAs modulating NT5E expression by qPCR. The effect of the selected NT5E inhibiting miRNAs (A) and NT5E enhancing miRNAs (B) from the library screen was confirmed in independent transfection experiments. Each dot represents one experiment. Cell lines were transfected with 50 nM miRNA. NT5E mRNA levels were determined by qPCR 48 h post transfection. Fold changes were calculated compared to the respective mimic control-1 samples. RPL19 was used as the housekeeping gene. Mean ± SD are shown. Significance was assessed by one-sample T-test. *p < 0.05; **p < 0.01; ***p < 0.001; ****p < 0.0001.
Figure 5
Figure 5
NT5E-3′-UTR reporter assay. The capacity of selected NT5E inhibiting miRNAs for direct NT5E 3′-UTR interaction was determined in luciferase reporter assays. Cells were transfected with 25 nM miRNA in a 96-well format, and luciferase activity was measured 24 h later. The effect of miRNAs on luminescence signal intensity with wild-type NT5E 3′-UTR is given in (A). Each dot represents an individual transfection. Fold changes in luminescence signal intensity was calculated compared to the respective mimic control-1 samples. Significance was assessed by one-sample T-test. Effect of site-specific deletions within the respective miRNA binding site was assessed by luciferase reporter assay (B-G). Therefore, SK-Mel-28 cells were transfected with 25 nM miRNAs in a 96-well format. 24 h post transfection luminescence signal intensity was measured. Each dot represents an individual transfection. Luminesce signal was normalized to the level of the control transfections. Mean ± SD are shown. Significance was assessed by unpaired T-test. *p < 0.05; **p < 0.01; ***p < 0.001; ****p < 0.0001.
Figure 6
Figure 6
miRNA mediated upregulation of NT5E surface expression correlates with reduced expression levels of the predicted NT5E repressors. Cancer cells were transfected with 50 nM miRNA, and cells were harvested 48 h after treatment. Triplicates were performed per condition. RNA was isolated and used for microarray profiling. Changes in expression levels of CBX6, CNOT6L, NFATC3, NT5E, and SRSF4 levels are depicted. Mean ± SD are shown. Significance was assessed by One-way Anova with Dunnett’s multiple comparison *p < 0.05; **p < 0.01; ***p < 0.001; ****p < 0.0001.
Figure 7
Figure 7
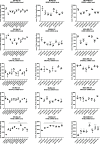
siRNA-mediated knock down of uncovered NT5E repressors recapitulates miRNA-induced amplification of NT5E expression. The effect of the selected NT5E repressors that may mediate miRNA-induced NT5E upregulation was confirmed in independent transfection experiments. Each dot represents an independent experiment. Fold changes in MFIs were calculated compared to the respective mimic control-1 samples. Mean ± SD are shown. Significance was assessed by one-sample T-test. *p < 0.05; **p < 0.01; ***p < 0.001; ****p < 0.0001.
Figure 8
Figure 8
Effect of miRNAs on AMP turnover mediated by NT5E. Cancer cells were transfected with 50 nM miRNA/siRNA. (A) For NT5E-inhibiting miRNAs 400 µM AMP was added to the transfected cells 48 h post transfection. (B) For NT5E-enhancing miRNAs 400 µM AMP was added 72 h post transfection. Supernatant was collected 30 min after AMP supplementation, and the amount of released phosphate was measured using malachite green assay. Technical replicates (–8) were performed per condition and assay. Fold changes were calculated to mimic the control-1 condition of the respective experiment. Each dot represents an independent experiment. Mean ± SD are shown. Significance was assessed by one-sample T-test. *p < 0.05; **p < 0.01; ***p < 0.001; ****p < 0.0001.

References

    1. Lee RC, Feinbaum RL, Ambros V. The c. elegans heterochronic gene Lin-4 encodes small rnas with antisense complementarity to Lin-14. Cell (1993) 75(5):843–54. doi: 10.1016/0092-8674(93)90529-y - DOI - PubMed
    1. Bhaskaran M, Mohan M. Micrornas: history, biogenesis, and their evolving role in animal development and disease. Vet Pathol (2014) 51(4):759–74. doi: 10.1177/0300985813502820 - DOI - PMC - PubMed
    1. Lee CT, Risom T, Strauss WM. Evolutionary conservation of microrna regulatory circuits: an examination of microrna gene complexity and conserved microrna-target interactions through metazoan phylogeny. DNA Cell Biol (2007) 26(4):209–18. doi: 10.1089/dna.2006.0545 - DOI - PubMed
    1. Loh HY, Norman BP, Lai KS, Rahman N, Alitheen NBM, Osman MA. The regulatory role of micrornas in breast cancer. Int J Mol Sci (2019) 20(19). doi: 10.3390/ijms20194940 - DOI - PMC - PubMed
    1. Kozomara A, Birgaoanu M, Griffiths-Jones S. Mirbase: from microrna sequences to function. Nucleic Acids Res (2019) 47(D1):D155–D62. doi: 10.1093/nar/gky1141 - DOI - PMC - PubMed

Publication types