. 2022 Jul 7:2:51.
doi: 10.1038/s43586-022-00131-9.

Volume electron microscopy

Affiliations

Volume electron microscopy

Christopher J Peddie et al. Nat Rev Methods Primers. .

Abstract

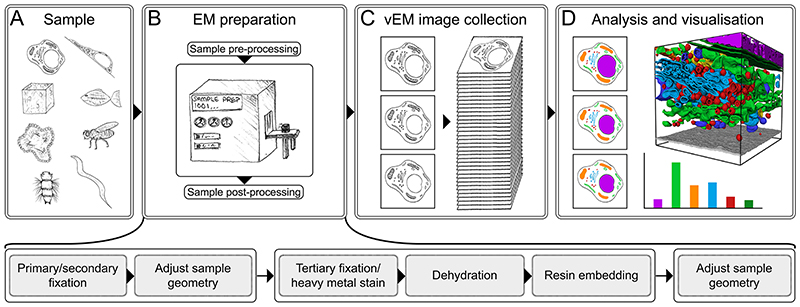
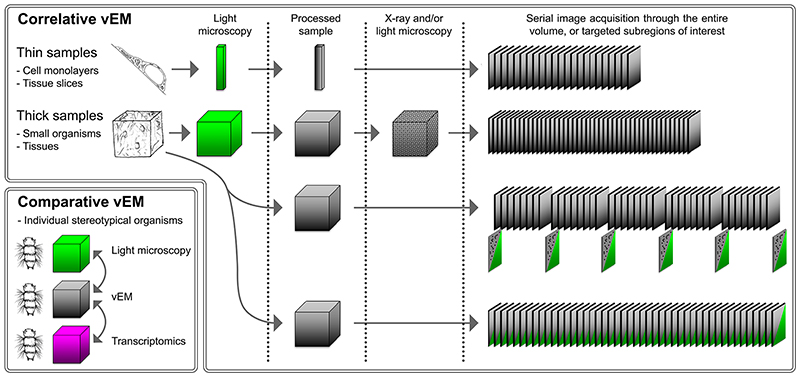
Life exists in three dimensions, but until the turn of the century most electron microscopy methods provided only 2D image data. Recently, electron microscopy techniques capable of delving deep into the structure of cells and tissues have emerged, collectively called volume electron microscopy (vEM). Developments in vEM have been dubbed a quiet revolution as the field evolved from established transmission and scanning electron microscopy techniques, so early publications largely focused on the bioscience applications rather than the underlying technological breakthroughs. However, with an explosion in the uptake of vEM across the biosciences and fast-paced advances in volume, resolution, throughput and ease of use, it is timely to introduce the field to new audiences. In this Primer, we introduce the different vEM imaging modalities, the specialized sample processing and image analysis pipelines that accompany each modality and the types of information revealed in the data. We showcase key applications in the biosciences where vEM has helped make breakthrough discoveries and consider limitations and future directions. We aim to show new users how vEM can support discovery science in their own research fields and inspire broader uptake of the technology, finally allowing its full adoption into mainstream biological imaging.


Conflict of interest statement

Competing Interests K.D.M. has founder’s equity interests in Aratome, LLC (Menlo Park, CA), an enterprise that produces array tomography materials and services. All other authors declare no competing interests.

Figures

Figure 1
Figure 1. A typical vEM workflow.
Properties of the sample, the target structure and research question determine the overall design of a volume electron microscopy (vEM) workflow. A: A wide variety of sample types can be examined, including isolated cells and cell monolayers, individual model organisms (including Danio rerio, Drosophila melanogaster, Caenorhabditis elegans and Platynereis larvae) and model systems such as organoids and tissues. B: The sample undergoes numerous complex preparation steps to produce a specimen optimized for vEM imaging. The sample must first be preserved in as near a native state as possible using chemical or cryogenic fixation methods. In correlative vEM workflows, light microscopy is typically carried out before processing for vEM, either pre fixation or post fixation. The geometry of large samples must be modified to make them compatible with subsequent staining steps owing to limited penetration of reagents. The sample is then exposed to application-specific cocktails of heavy metals, dehydrated and embedded in resin to both introduce electron contrast to the features of interest, and stabilize the sample within the vacuum of the microscope. Once embedded, the samples then undergo a further process of application-specific geometry modification to meet constraints of the target imaging modality. C: All vEM modalities result in a stack of serial images. D: The image volume is then reconstructed, analysed and visualized using a varied mixture of manual, semi-automated and automated algorithms in opensource and commercial software. Imaged volume in panel D adapted from Heinrich et al. .
Figure 2
Figure 2. vEM encompasses a collection of closely related imaging modalities.
Volume electron microscopy (vEM) is a collective term for numerous imaging modalities based on transmission electron microscopy (TEM) and scanning electron microscopy (SEM). Within each modality, overall sample position (dotted box, with a red spot indicating the location of electron beam interaction) and signal generation mechanisms remain broadly similar. For TEM, electrons that pass through the sample are collected by a downstream detector. For SEM, backscattered (BSE) and/or secondary electrons (SE) are generated by electron beam interaction with the sample and recorded using in-chamber or incolumn detectors (pale blue). However, the format of sample and mechanism used for generating serial images vary. For TEM, serial ultra-thin sections of 50-70 nm thickness are typically collected on substrates coated with an electron transparent support film such as formvar-coated copper slot grids (serial section TEM (ssTEM)). 3-D volumes can also be generated by imaging through serial sections of 200-300 nm thickness at multiple tilt angles, back projecting resultant images and reconstructing the volume (serial section electron tomography (ssET)). Alternatively, very extensive collections of serial ultra-thin sections can be imaged using a tape-based support system that feeds directly through the electron column (GridTape TEM). For SEM, options range from sequentially cutting and imaging the sample using a miniaturized in-chamber ultramicrotome (serial blockface SEM (SBF-SEM)) or directly milling from the imaged surface using a gallium ion beam (focused ion beam SEM (FIB-SEM)) or a variety of plasma moieties (pFIB-SEM). Enhancements such as sample bias, modified sample geometry and closed-circuit milling control are integral to some advanced workflows (enhanced FIB-SEM (eFIB-SEM)). Imaging of serial ultra-thin sections collected on a suitable substrate such as silicon wafer or indium tin oxide-coated glass (array tomography), or Kapton tape (array tomography with automated tape-collecting ultramicrotome (ATUM)) can also be achieved using SEM, with either a single electron beam, or parallel electron beamlets.
Figure 3
Figure 3. vEM as a multiscale multimodal imaging technique.
Volume electron microscopy (vEM) continually pushes the boundaries of high-resolution volume imaging. Transmission electron microscopy (TEM)-based imaging modalities (serial section electron tomography (ssET) and serial section TEM (ssTEM)) tend to deliver higher resolutions, whereas scanning electron microscopy (SEM)-based modalities (serial blockface SEM (SBF-SEM), array tomography and focused ion beam SEM (FIB-SEM)) tend to deliver larger volumes. Multimodal workflows, emerging vEM technologies such as GridTape TEM, multibeam SEM (mSEM), enhanced FIB-SEM (eFIB-SEM), plasma FIB-SEM (pFIB-SEM) and FAST-EM, and associated techniques including X-ray microscopy are further extending scales and resolutions over which volume imaging is possible.
Figure 4
Figure 4. Correlative and comparative vEM for function-structure studies.
Volume electron microscopy (vEM) studies frequently use multimodal imaging pipelines. Light microscopy, in particular, can be used to obtain a wide variety of molecular, developmental or functional information from a sample prior to processing for electron microscopy. Light microscopy can also be used to locate a region of interest (ROI) for targeted imaging (correlation for relocation) or to localize molecules to structures (correlation for registration). In thin samples, such as cell monolayers or tissue slices, the final volume is relatively small and correlation between light and electron imaging modalities is more straightforward. For successful correlation in thick samples, intermediate imaging steps are often required such as X-ray and light microscopy, in order to provide a link between low and high-resolution datasets and help to relocate the target area of interest prior to serial image acquisition throughout the target volume. Alternatively, intercalated serial section transmission electron microscopy (ssTEM) data sets can be probed by computational molecular phenotyping , or multiplexed siGOLD immunolabelling (black dots) , thereby providing a wealth of functional information that can be translated across the whole dataset. To further enhance a multiplexed volumetric approach, all sections can be used for each imaging modality, combining immunofluorescence and electron imaging modalities to link functional identification to the underlying tissue ultrastructure . Finally, for small stereotypical organisms such as Platynereis larvae, comparative analysis can be used to draw powerful conclusions for populations by correlating multimodal data from individual organisms .
Figure 5
Figure 5. A typical vEM image analysis pipeline.
In this example, mitochondria have been segmented from an array tomography image stack acquired using multibeam SEM (mSEM) (MitoEM data challenge). The analysis pipeline contained the following steps: mitochondria pixel probabilities and boundaries were predicted with a pretrained UNet, boundary probabilities were subtracted from mitochondria probabilities and connected components applied to achieve an instance segmentation. Size per instance was measured and projected to the image and, finally, the extracted mitochondria volumes were plotted as a histogram. All analysis was performed in three dimensions. An example volume rendering of the instance segmentation is also shown, demonstrating number and complexity of mitochondria in a sub-volume of the data set. Scale bar in mSEM image = 2 μm. mSEM image courtesy of the Lichtman lab at Harvard University.
Figure 6
Figure 6. Examples of multiscale vEM on organelles and cells.
A:Segmentation and analysis of organelle volumes in a HeLa cell data set, acquired using enhanced focused ion beam scanning electron microscopy (eFIB-SEM) ,. Fifteen manually annotated training blocks were produced from a whole cell to train deep learning models to classify different organelles within the volume. Shown are a 3D rendering of one training block (right inset, 1.2 × 1.2 × 0.95 μm), with a single eFIB-SEM slice (top left inset), and annotation of every voxel within this slice (bottom left inset). Scale bars for insets = 200 nm. B-F: Analysis of cell diversity and nervous system evolution in sponges, data sets acquired using FIB-SEM to highlight neuroid-choanocyte interactions . 3D volume of entire choanocyte chamber segmented using machine learning with a neuroid cell, previously identified using light microscopy (violet), and interacting with multiple microvilli within the chamber (B); segmented volume showing the violet neuroid cell, and a second neuroid cell (red) closer to apopylar collar, contacting cilia and microvillar collars of three choanocytes (blue, turquoise and green) and apopylar cells (yellow) (C); higher magnification view of segmented neuroid cell (violet) with filopodia extending into microvillar collar (turquoise) (D); single slice from FIB-SEM data set showing a neuroid cell with secretory vesicles highlighted in cyan. F: Single slice from the same FIB-SEM dataset showing neuroid cell forming a pocket around tip of a choanocyte cilia (yellow) (F). Considered with other structural features, these findings are suggestive of a role for neuroid cells in bacteria and debris clearance and intercellular communication. Scale bars (E, F) = 2 μm. vEM, volume electron microscopy. Panel A adapted from Heinrich et al. . Panels B-F reproduced from Musser et al. .
Figure 7
Figure 7. Examples of multiscale vEM on model organisms and connectomes.
A: Volumetric rendering of a Drosophila melanogaster ventral nerve cord (VNC) data set showing the full extent of all imaged tissue (light grey) and the outline of the VNC neuropil (dark grey), with overall dimensions indicated. Data set acquired using GridTape transmission electron microscopy (TEM). B: All motor neurons in the thoracic segments of the VNC were reconstructed and analysed. Each motor neuron projects an axon to one peripheral nerve, leaving the bounds of the electron microscopy dataset, to innervate muscles. Cell bodies are represented as spheres, coloured along with their projections, in accordance with the target of innervation. C: Volumetric models of Caenorhabditis elegans brain ,, coloured by cell type, and shown at three stages in developmental timeline. The datasets were acquired using both serial section TEM (ssTEM), and single-beam array tomography with automated tape-collecting ultramicrotome (ATUM), and manually reconstructed using CATMAID. D: Wiring diagrams highlighting changes in complexity of connectivity during brain development for eight individuals indicated on the timeline in C. Each circle represents a cell, again coloured in accordance with cell type and target of innervation, and each line represents a connection between two cells with at least one chemical synapse. Vertical axis denotes signalling from sensory perception (top) to motor actuation (bottom). Horizontal axis denotes connectivity similarity; neurons that share partners are positioned more closely. Signal flow and connectivity similarity are based on accumulated connections from all datasets. Although brain geometry does not change substantially during development, with neuron number and position being fairly constant, complexity and relative strengths of synaptic connections evolve significantly during development. vEM, volume electron microscopy. Panels A and B adapted from Phelps et al. . Panels C and D reproduced from Witvliet et al. .
Figure 8
Figure 8. Examples of multiscale vEM in tissues and the clinical setting.
A: Analysis of a 1,500 μm volume of mouse neocortex, generated using array tomography with automated tape-collecting ultramicrotome (ATUM), imaged using single-beam scanning electron microscopy (SEM), and segmented automatically . The segmented volume was mined to study cellular composition and connectivity. The saturated reconstruction volume (left) had a varied composition which could be divided into individual subcategories, including cell types, axons, dendrites, and other unclassified processes. Scale bar = 7 μm. B-D: 3D ultrastructure of a kidney biopsy specimen from a patient with lupus nephritis studied using serial blockface SEM (SBF-SEM) . In this 3,700 μm data set, the glomerular basement membrane was found to be disrupted, with podocyte cytoplasmic processes (yellow) extending into the glomerular basement membrane and mesangial matrix (green) (B). Reconstructed in three dimensions, the podocyte cytoplasmic process (yellow) displayed highly complex topology with multiple spikes extending towards surrounding mesangial cells (blue), forming more than 100 contact sites (red) (C,D). Scale bars = 10 μm. E-G: SBF-SEM analysis of human biopsy samples from patients with immunoglobulin A nephropathy highlighted the disruption of the glomerular basement membrane (red) and penetration of mesangial cellular processes (green) into the urinary space (highlighted by a black arrow with podocyte highlighted in yellow) (E); 3D reconstruction of the penetrating mesangial cell (F) revealed multiple contact sites with podocytes within the urinary space (red) (G). Scale bar = 1 μm. H-J: To study the 3D organization of patient- derived hepatoblastoma xenografts, SBF-SEM was used 267: one SBF-SEM data set (H) was used to develop a semi-automatic segmentation procedure, revealing 182 tumour cells (I) and 113 nuclei (J) within the volume, from which bioarchitectural parameters could be extracted to further study tumour tissue architecture. Scale bar = 20 μm. vEM, volume electron microscopy. Panel A reproduced from Kasthuri et al. . Panels B-D reproduced from Takaki et al. . Panels E-G reproduced from Nagai et al. . Panels H-J reproduced from de Senneville et al. .

References

    1. Abbott LF, et al. The Mind of a Mouse. Cell. 2020;182:1372–1376. doi: 10.1016/j.cell.2020.08.010. - DOI - PubMed
    1. Guerin CJ, Lippens S. Correlative light and volume electron microscopy (vCLEM): How community participation can advance developing technologies. J Microsc. 2021;284:97–102. doi: 10.1111/jmi.13056. - DOI - PMC - PubMed
    1. Peddie CJ, Schieber NL. In: Correlative Imaging: Focusing on the Future. Collinson Lucy, Verkade Paul., editors. John Wiley & Sons Ltd; 2020. pp. 37–66.
    1. Hayat MA. Principles and Techniques of electron microscopy: biological applications. Cambridge University Press; 2000. pp. 45–61.
    1. Titze B, Genoud C. Volume scanning electron microscopy for imaging biological ultrastructure. Biology of the Cell. 2016;108:307–323. doi: 10.1111/boc.201600024. - DOI - PubMed

LinkOut - more resources