. 2023 Jan 18;14(4):334-342.
doi: 10.1136/flgastro-2022-102366. eCollection 2023.

Satellite liver transplant centres significantly improve transplant assessment outcomes for patients with chronic liver disease but not hepatocellular carcinoma: a retrospective cohort study

Affiliations

Satellite liver transplant centres significantly improve transplant assessment outcomes for patients with chronic liver disease but not hepatocellular carcinoma: a retrospective cohort study

Oliver D Tavabie et al. Frontline Gastroenterol. .

Abstract

Introduction: Liver transplantation (LT) remains integral to the management of end-stage chronic liver disease (CLD). However, referral thresholds and assessment pathways remain poorly defined. Distance from LT centre has been demonstrated to impact negatively on patient outcomes resulting in the development of satellite LT centres (SLTCs). We aimed to evaluate the impact of SLTCs on LT assessment in patients with CLD and hepatocellular carcinoma (HCC).

Methods: A retrospective cohort study was undertaken including all patients with CLD or HCC assessed for LT at King's College Hospital (KCH) between October 2014 and October 2019. Referral location, social, demographic, clinical and laboratory data were collected. Univariable and multivariable analyses (MVA) were performed to assess the impact of SLTCs on patients being accepted as LT candidates and contraindications being identified.

Results: 1102 and 240 LT assessments were included for patients with CLD and HCC, respectively. MVA demonstrated significant associations with; patients living greater than 60 min from KCH/SLTCs and LT candidacy acceptance in CLD, and less deprived patients and LT candidacy acceptance in HCC. However, neither variable was associated with identification of LT contraindications. MVA demonstrated that referrals from SLTCs were more likely to result in acceptance of LT candidacy and less likely to result in a contraindication being identified in CLD. However, such associations were not demonstrated in HCC.

Conclusion: SLTCs improve LT assessment outcomes in CLD but not HCC reflecting the standardised HCC referral pathway. Developing a formal regional LT assessment pathway across the UK would improve equity of access to transplantation.

Keywords: alcoholic liver disease; cirrhosis; health service research; hepatocellular carcinoma; liver transplantation.


Conflict of interest statement

Competing interests: None declared.

Figures
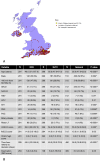
Figure 1
Figure 1
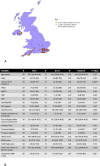
Comparison of referrals of patients with CLD for transplant assessment from SLTCs, KCH and the rest of the network. (A) Map demonstrating location of patients with CLD referred for transplant assessment and their proximity to SLTCs and KCH. (B) Comparison of patients with CLD referred for transplant assessment from KCH, SLTCs and the rest of the network. Results from Kruskall-Wallis tests presented as median (IQR). Results from χ2 tests presented as number (%). Significant designated by * (after correction for false discovery). AIH, autoimmune hepatitis; ARLD, alcohol related liver disease; CLD, chronic liver disease; HBV, hepatitis B virus; HCV, hepatitis C virus; IMD, Index of Multiple Deprivation; KCH, King’s College Hospital; LT, liver transplantation; MELD model for end-stage liver disease; NAFLD, non-alcoholic fatty liver disease; PBC, primary biliary cholangitis; PSC, primary sclerosing cholangitis; SLTCs, satellite liver transplantation centres; UKELD, UK Model for End-Stage Liver Disease.
Figure 2
Figure 2
Comparison of referrals of patients with HCC for transplant assessment from SLTCs, KCH and the rest of the network. (A) Map demonstrating location of patients with HCC referred for transplant assessment and their proximity to SLTCs and KCH. (B) Comparison of patients with HCC referred for transplant assessment from KCH, SLTCs and the rest of the network. Results from Kruskall-Wallis tests presented as median (IQR). Results from χ2 tests presented as number (%). Significant designated by * (after correction for false discovery). AIH, autoimmune hepatitis; ARLD, alcohol related liver disease; CLD, chronic liver disease; HBV, hepatitis B virus; HCV, hepatitis C virus; IMD, Index of Multiple Deprivation; KCH, King’s College Hospital; MELD model for end-stage liver disease; NAFLD, non-alcoholic fatty liver disease; PBC, primary biliary cholangitis; PSC, primary sclerosing cholangitis; SLTCs, satellite liver transplantation centres; TACE, transarterial chemoembolisation; UKELD, UK Model for End-Stage Liver Disease.
Figure 3
Figure 3
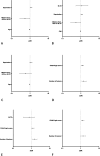
OR plots of variables associated with patients with CLD being accepted as an LT candidate or found to have a contraindication to transplantation. (A) OR plot of variables associated with being listed for transplant across the whole CLD cohort (n=1097, AUC 0.73 (95% CI 0.70 to 0.76) p<0.0001*, pseudo r2=0.14, HL Statistic 9.60 (p=0.29), log-likelihood ratio 169.30 (p<0.0001*)). (B) Sensitivity analysis of (A) model with KCH patients excluded (n=806, AUC 0.72 (95% CI 0.68 to 0.75) p<0.0001*, pseudo r2=0.13, HL Statistic 4.45 (p=0.81), log-likelihood ratio 107.60 (p<0.0001*)).(C) OR plot of variables associated with being listed for transplant in patients with ARLD (n=378, AUC 0.70 (95% CI 0.65 to 0.75) p<0.0001*, pseudo r2=0.12, HL statistic 8.39 (p=0.40), log-likelihood ratio 49.48 (p<0.0001*)). (D) Sensitivity analysis of (C) model with KCH patients excluded (n=337, AUC 0.71 (95% CI 0.65 to 0.76) p<0.0001*, pseudo r2=0.13, HL statistic 13.75 (p=0.09), log-likelihood ratio 46.22 (p<0.0001*)). (E) OR plot of variables associated with contraindications to transplant across the whole CLD cohort (n=1097, AUC 0.72 (95% CI 0.68 to 0.75) p<0.0001*, pseudo r2=0.10, HL statistic 2.40 (p=0.97), log-likelihood ratio 106.60 (p<0.0001*)). (F) Sensitivity analysis of (E) model with KCH patients excluded (n=806, AUC 0.69 (95% CI 0.65 to 0.74) p<0.0001*, pseudo r2=0.08, HL statistic 2.46 (p=0.96), log-likelihood ratio 68.72 (p<0.0001*)). See online supplemental tables 5 and 6 for more information. AIH, autoimmune hepatitis; ARLD, alcohol-related liver disease; AUC, area under the curve; CLD, chronic liver disease; HBV, hepatitis B virus; HCV, hepatitis C virus; IMD, Index of Multiple Deprivation; KCH, King’s College Hospital; MELD model for end-stage liver disease; NAFLD, non-alcoholic fatty liver disease; PBC, primary biliary cholangitis; PSC, primary sclerosing cholangitis; SLTCs, satellite liver transplantation centres.
Figure 4
Figure 4
OR plots of variables associated with patients with HCC being accepted as an LT candidate or found to have a contraindication to transplantation. (A) OR plot of variables associated with being listed for transplant across the whole HCC cohort (n=210, AUC 0.65 (95% CI 0.57 to 0.73) p<0.0001*, pseudo r2=0.06, HL Statistic 6.89 (p=0.55), log-likelihood ratio 12.85 (p=0.005*)). (B) SLTCs inserted as a variable into Figure 4A model (n=210, AUC 0.65 (95% CI 0.57 to 0.73) p<0.0001*, pseudo r2=0.06, HL Statistic 3.11 (p=0.93), log-likelihood ratio 12.95 (p=0.01*)). (C) Sensitivity analysis of (A) model removing KCH patients (n=152, AUC 0.65 (95% CI 0.55 to 0.75) p<0.0001*, pseudo r2=0.05, HL statistic 4.14 (p=0.84), log-likelihood ratio 7.92 (p=0.04*)). (D) OR plot of variables associated with contraindications to transplant across the whole HCC cohort (n=239, AUC 0.63 (0.55–0.72) p<0.0001*), pseudo r2=0.06, HL statistic 6.07 (p=0.64), log-likelihood ratio 12.95 (p=0.002*)). (E) SLTCs inserted as a variable into (D) model (n=239, AUC 0.63 (95% CI 0.55 to 0.72) p<0.0001*, pseudo r2=0.06, HL Statistic 6.55 (p=0.59), log-likelihood ratio 13.59 (p=0.004*)). (F) Sensitivity analysis of (D) model removing KCH patients (n=181, AUC 0.65 (95% CI 0.56 to 0.75) p<0.0001*, pseudo r2=0.07, HL statistic 3.86 (p=0.87), log-likelihood ratio 10.88 (p=0.004*). See online supplemental table 8 for more information. AUC, area under the curve; HCC, hepatocellular carcinoma; KCH, King’s College Hospital; SLTCs, satellite liver transplantation centres.

References

    1. Williams R, Aspinall R, Bellis M, et al. . Addressing liver disease in the UK: a blueprint for attaining excellence in health care and reducing premature mortality from lifestyle issues of excess consumption of alcohol, obesity, and viral hepatitis. Lancet 2014;384:1953–97. 10.1016/S0140-6736(14)61838-9 - DOI - PubMed
    1. Karlsen TH, Sheron N, Zelber-Sagi S, et al. . The EASL-Lancet liver Commission: protecting the next generation of Europeans against liver disease complications and premature mortality. Lancet 2022;399:61–116. 10.1016/S0140-6736(21)01701-3 - DOI - PubMed
    1. D'Amico G, Garcia-Tsao G, Pagliaro L. Natural history and prognostic indicators of survival in cirrhosis: a systematic review of 118 studies. J Hepatol 2006;44:217–31. 10.1016/j.jhep.2005.10.013 - DOI - PubMed
    1. Arnold M, Rutherford MJ, Bardot A, et al. . Progress in cancer survival, mortality, and incidence in seven high-income countries 1995-2014 (ICBP SURVMARK-2): a population-based study. Lancet Oncol 2019;20:1493–505. 10.1016/S1470-2045(19)30456-5 - DOI - PMC - PubMed
    1. O'Grady JG. Network and satellite arrangements in liver disease. Frontline Gastroenterol 2013;4:187–90. 10.1136/flgastro-2012-100267 - DOI - PMC - PubMed

LinkOut - more resources