Review
. 2023 Sep;10(26):e2302131.
doi: 10.1002/advs.202302131. Epub 2023 Jul 6.

Genetically Engineered-Cell-Membrane Nanovesicles for Cancer Immunotherapy

Affiliations
Review

Genetically Engineered-Cell-Membrane Nanovesicles for Cancer Immunotherapy

Qinzhen Cheng et al. Adv Sci (Weinh). 2023 Sep.

Abstract

The advent of immunotherapy has marked a new era in cancer treatment, offering significant clinical benefits. Cell membrane as drug delivery materials has played a crucial role in enhancing cancer therapy because of their inherent biocompatibility and negligible immunogenicity. Different cell membranes are prepared into cell membrane nanovesicles (CMNs), but CMNs have limitations such as inefficient targeting ability, low efficacy, and unpredictable side effects. Genetic engineering has deepened the critical role of CMNs in cancer immunotherapy, enabling genetically engineered-CMN (GCMN)-based therapeutics. To date, CMNs that are surface modified by various functional proteins have been developed through genetic engineering. Herein, a brief overview of surface engineering strategies for CMNs and the features of various membrane sources is discussed, followed by a description of GCMN preparation methods. The application of GCMNs in cancer immunotherapy directed at different immune targets is addressed as are the challenges and prospects of GCMNs in clinical translation.

Keywords: cancer immunotherapy; cell membrane nanovesicles (CMNs); genetic engineering; genetically engineered-cell-membrane nanovesicles (GCMNs); immune targets.


Conflict of interest statement

The authors declare no conflict of interest.

Figures

Figure 1
Figure 1
Surface engineering of cell membrane nanovesicles (CMNs) via genetic engineering or chemical modification. PD‐1: programmed cell death protein 1; OVA: ovalbumin; TIGIT: T cell immunoreceptor with immunoglobulin and ITIM domain; aPD‐1: anti‐programmed‐cell‐death‐protein 1 antibody; SIRPα: signal regulatory protein alpha.
Figure 2
Figure 2
Properties of genetically engineered cell membrane nanovesicles (GCMNs) retained from original cells. MSCs: mesenchymal stem cells.
Figure 3
Figure 3
General preparation process of GCMNs.
Figure 4
Figure 4
Application of GCMNs in immunotherapy. GCMNs have shown promising application in cancer immunotherapy by acting on immune targets and stimulating immune responses. GCMNs can achieve effective immune responses through A) blocking of programmed cell death protein 1 (PD‐1)–PD‐L1 signaling: GCMNs overexpressing PD‐1 competitively bind to PD‐L1 and effectively block PD‐1–PD‐L1 signaling; B) blocking CD47–signal regulatory protein alpha (SIRPα) signaling: GCMNs overexpressing SIRPα competitively bind to CD47 and effectively block CD47–SIRPα signaling; C) regulating the tumor microenvironment (TME): GCMNs can regulate the TME by acting on special targets such as by expressing hyaluronidase to degrade hyaluronic acid (HA), thus destroying TEM composition; D) other strategies such as GCMNs overexpressing T cell immunoreceptor with immunoglobulin and ITIM domain (TIGIT) and blocking TIGIT–CD155 signaling. DC: dendritic cell.
Figure 5
Figure 5
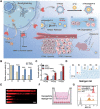
Anticancer genetically engineered cell membrane nanovesicles fabricated by overexpressing PD‐1. A) PD‐1 was introduced into RAW 264.7 cells using lentiviral vector and the cell membrane was coextruded with PLGA/RAPA to obtain PD‐1‐MM@PLGA/RAPA. B) DiR signals in isolated mice brains at different time points after intravenous (i.v.) injection of PD‐1‐MM@PLGA/DiR. C) Representative fluorescence images of PLGA/DiR and PD‐1‐MM@PLGA/DiR at 24 h after i.v. injection. D) Survival rates of mice treated with glucose, PLGA/RAPA, MM@PLGA/RAPA, and PD‐1‐MM@PLGA/RAPA. E) Population of CD8+ cytotoxic T lymphocytes within the cancer. F) Quantification of TNFα, IFNγ, and IL‐2. Reproduced with permission.[ 32 ] Copyright 2022, American Chemical Society.
Figure 6
Figure 6
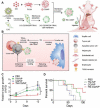
Anticancer genetically engineered cell membrane nanovesicles fabricated by overexpressing anti‐PD‐1. A) Preparation of CPI‐444–aPD‐1‐scFv‐NVs and anticancer mechanism of CPI‐444–aPD‐1‐scFv‐NVs. Reproduced with permission.[ 77 ] Copyright 2022, Tsinghua University Press. B) Preparation of ASPIRE. C) Survival rates and tumor growth curves in mice under different treatments. Reproduced with permission.[ 23a ] Copyright 2022, Springer Nature Limited.
Figure 7
Figure 7
Anticancer genetically engineered cell membrane nanovesicles fabricated by overexpressing anti‐PD‐L1 (aPD‐L1). A) Preparation of aPD‐L1 NVs–indocyanine green (ICG) and antigen–antibody integrator (AAI). Following intravenous injection of aPD‐L1 NVs–ICG, the photosensitized agent was delivered to the tumor by targeting PD‐L1. The primary tumor was laser irradiated to induce reprogramming. Subsequently, subcutaneous injection of AAI in mice enhanced the antitumor immune response. B) Survival rates with different treatments. C) Rates of mature DCs in mouse lymph nodes after the last dose for 3 days. D) Percentage of CD8+ T cells in the distal secondary tumor after the last dose for 3 days. Reproduced with permission.[ 23b ] Copyright 2022, Springer Nature.
Figure 8
Figure 8
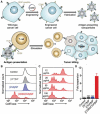
Anticancer genetically engineered cell membrane nanovesicles fabricated by overexpressing SIRPα. A) Preparation of Fus‐CVs. B) Anticancer mechanism of Fus‐CVs. C) Fluorescence images of phagocytosis assays. Scale bar, 100 µm. D) Quantitative analysis of 4T1 cell phagocytosis by RAW264.7 cells at different culture concentrations. Reproduced with permission.[ 85 ] Copyright 2021, Wiley‐VCH.
Figure 9
Figure 9
Anticancer genetically engineered cell membrane nanovesicles fabricated by CD47 knockout. A) Preparation of DBE@CCNPs and anticancer mechanism of DBE@CCNPs. Tumor B) volume and C) weight profiles after the various treatments in different groups. D) Tumor images after the various treatments in different groups. Scale bar, 1 cm. Reproduced with permission.[ 87 ] Copyright 2022, Elsevier.
Figure 10
Figure 10
Anticancer genetically engineered cell membrane nanovesicles fabricated by expressing mHAase. A) The preparation and antitumor mechanism of mHAase@nP18. B) Enzyme activity profiles of mHAase and HAase in serum at 37 °C for 6, 12, 24, and 36 h (n = 3). C) HAase activity of HAase on vesicles and release responding to MMP‐2 (n = 3). D) Schematic diagram of ECM‐like capillary models. E) Confocal laser‐scanning microscopy of nP18 diffusion in ECM‐simulation gels, a) mHAase@nP18 + MMP‐2; b) HAase + nP18; c) mHAase@nP18; d) nP18 + MMP‐2; e) nP18. Red (P18). F) The Transwell‐based TME model. G) Flow cytometry plots showing nP18 penetration of HepG2 cells after the various treatments. Reproduced with permission.[ 92 ] Copyright 2022, Wiley‐VCH.
Figure 11
Figure 11
Anticancer genetically engineered cell membrane nanovesicles fabricated by expressing KR. A) The preparation and anticancer mechanism of Lp‐KR‐CCM‐A. B) Viability of cancer cells treated with phosphate‐buffered saline (PBS) or different groups with or without laser irradiation for 1 h. C) In vitro reactive oxygen species (ROS) generation induced by Lp‐KR‐CCM‐A upon laser irradiation for 20 min. Scale bars, 50 µm. Reproduced with permission.[ 95 ] Copyright 2019, American Chemical Society.
Figure 12
Figure 12
Anticancer genetically engineered cell membrane nanovesicles fabricated to express transferrin (Tf). A) The preparation of Tf@IR820–DHA. B) In vivo near‐infrared fluorescence imaging of tumors in mice upon injection of different treatments via the tail vein after 3, 6, and 12 h. C) Ex vivo fluorescence imaging of tumors and major organs after 6 h of treatment. D) The corresponding fluorescence intensity of tumors and major organs after 6 h of treatment (n = 3). Reproduced with permission.[ 99 ] Copyright 2022, American Chemical Society.
Figure 13
Figure 13
A–G) Preparation of mimovirus vesicle with azide motifs (MVVs—N3) for cancer diagnosis. Reproduced with permission.[ 101 ] Copyright 2020, Wiley‐VCH.
Figure 14
Figure 14
Anticancer genetically engineered cell membrane nanovesicles fabricated by expressing OVA and CD80. A) The preparation and anticancer mechanism of [CD80/OVA] (NPs). B,C) Fluorescent signal dilution of CD8+ T cells in a population of OT‐I splenocytes after incubation with different groups (B) or [CD80/OVA] NPs at various concentrations (C) for 3 days. D) Fold expansion of CD8+ T cells in a population of OT‐I splenocytes after incubation with different groups for 4 days (n = 3). Reproduced with permission.[ 65 ] Copyright 2020, Wiley‐VCH.
Figure 15
Figure 15
Anticancer genetically engineered cell membrane nanovesicles fabricated by expressing TRAIL. A,B) Preparation and antitumor mechanism of TM–CQ/NPs. C) Tumor growth curves in mice with different treatments. D) Survival rates in nude mice with different treatments (n = 4 or 5). Reproduced with permission.[ 105 ] Copyright 2022, Elsevier.
Figure 16
Figure 16
Anticancer genetically engineered cell membrane nanovesicles fabricated to express TIGIT. A,B) Preparation and anticancer mechanism of O‐TPNVs. C) Recurrent cancer growth curves after different treatments (n = 6). D) Survival rates in mice after different treatments (n = 6). E) Weight of recurrent cancers after different treatments (n = 4). Reproduced with permission.[ 110 ] Copyright 2022, American Association for the Advancement of Science.
Figure 17
Figure 17
Anticancer genetically engineered cell membrane nanovesicles fabricated to express IL‐15/IL‐15Rα. A) The preparation and anticancer mechanism of IL‐15/IL‐15Rα NVs–PD‐1/PD‐L1 inhibitor 1. B) Recurrent cancer growth curves after different treatments (n = 5). C) Weight of recurrent tumors after different treatments (n = 10). D) Survival rates in mice after different treatments (n = 4). Reproduced with permission.[ 113 ] Copyright 2022, Elsevier.

References

    1. Miller K. D., Siegel R. L., Lin C. C., Mariotto A. B., Kramer J. L., Rowland J. H., Stein K. D., Alteri R., Jemal A., Ca‐Cancer J. Clin. 2016, 66, 271. - PubMed
    1. a) Sharma P., Allison J. P., Science 2015, 348, 56; - PubMed
    2. b) Tan S. Z., Li D. P., Zhu X., Biomed. Pharmacother. 2020, 124, 109821. - PubMed
    1. a) Yong T. Y., Wei Z. H., Gan L., Yang X. L., Adv. Mater. 2022, 34, 2201054; - PubMed
    2. b) Chen D. S., Mellman I., Immunity 2013, 39, 1. - PubMed
    1. Pardoll D. M., Nat. Rev. Cancer 2012, 12, 252. - PMC - PubMed
    1. a) Brahmer J. R., Tykodi S. S., Chow L. Q. M., Hwu W. J., Topalian S. L., Hwu P., Drake C. G., Camacho L. H., Kauh J., Odunsi K., Pitot H. C., Hamid O., Bhatia S., Martins R., Eaton K., Chen S. M., Salay T. M., Alaparthy S., Grosso J. F., Korman A. J., Parker S. M., Agrawal S., Goldberg S. M., Pardoll D. M., Gupta A., Wigginton J. M., N. Engl. J. Med. 2012, 366, 2455; - PMC - PubMed
    2. b) Zhao Z. Y., Dong S. M., Liu Y., Wang J. X., Ba L., Zhang C., Cao X. Y., Wu C. J., Yang P. P., ACS Nano 2022, 16, 20400; - PubMed
    3. c) Kraehenbuehl L., Weng C. H., Eghbali S., Wolchok J. D., Merghoub T., Nat. Rev. Clin. Oncol. 2022, 19, 37. - PubMed

Publication types

LinkOut - more resources