. 2023 Jul 21;133(3):271-287.
doi: 10.1161/CIRCRESAHA.121.320324. Epub 2023 Jul 6.

p53 Regulates the Extent of Fibroblast Proliferation and Fibrosis in Left Ventricle Pressure Overload

Affiliations

p53 Regulates the Extent of Fibroblast Proliferation and Fibrosis in Left Ventricle Pressure Overload

Xiaoyi Liu et al. Circ Res. .

Abstract

Background: Cardiomyopathy is characterized by the pathological accumulation of resident cardiac fibroblasts that deposit ECM (extracellular matrix) and generate a fibrotic scar. However, the mechanisms that control the timing and extent of cardiac fibroblast proliferation and ECM production are not known, hampering the development of antifibrotic strategies to prevent heart failure.

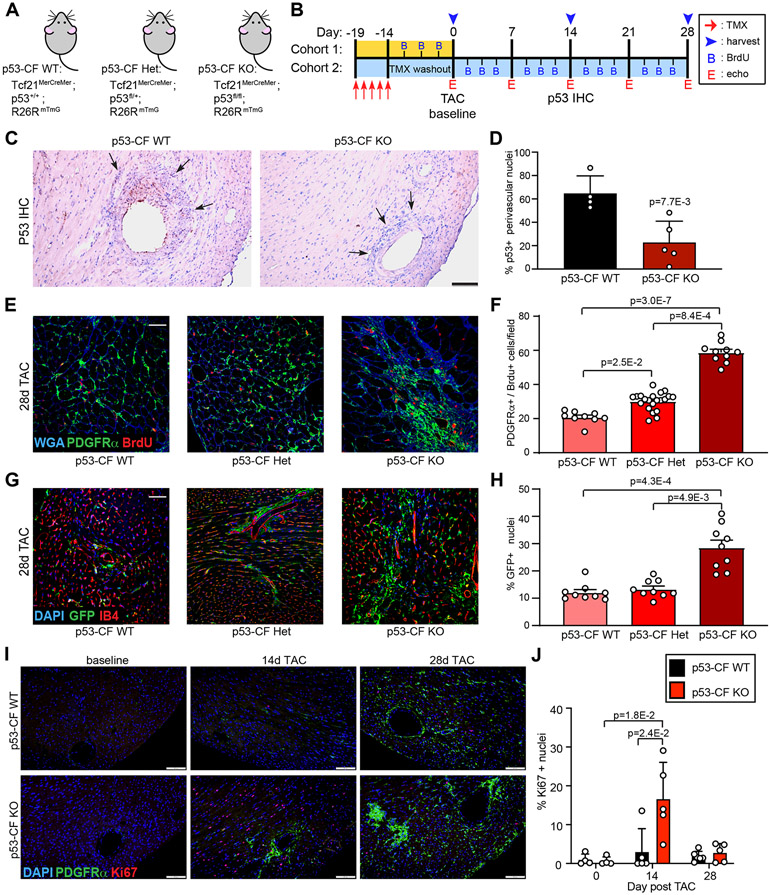
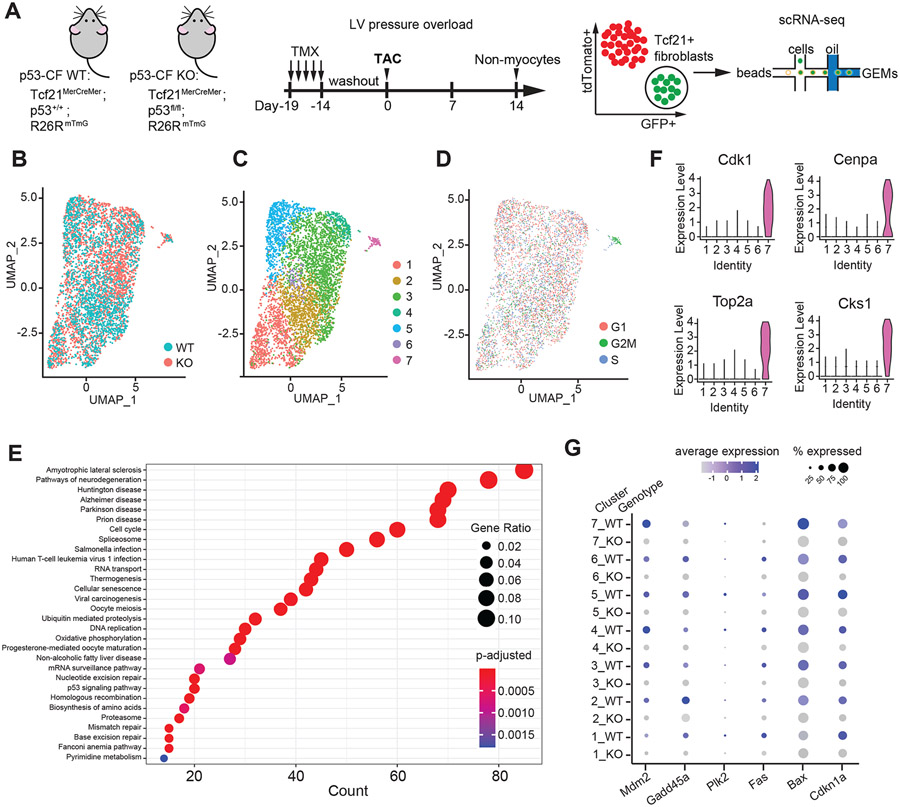
Methods: We used the Tcf21 (transcription factor 21)MerCreMer mouse line for fibroblast-specific lineage tracing and p53 (tumor protein p53) gene deletion. We characterized cardiac physiology and used single-cell RNA-sequencing and in vitro studies to investigate the p53-dependent mechanisms regulating cardiac fibroblast cell cycle and fibrosis in left ventricular pressure overload induced by transaortic constriction.

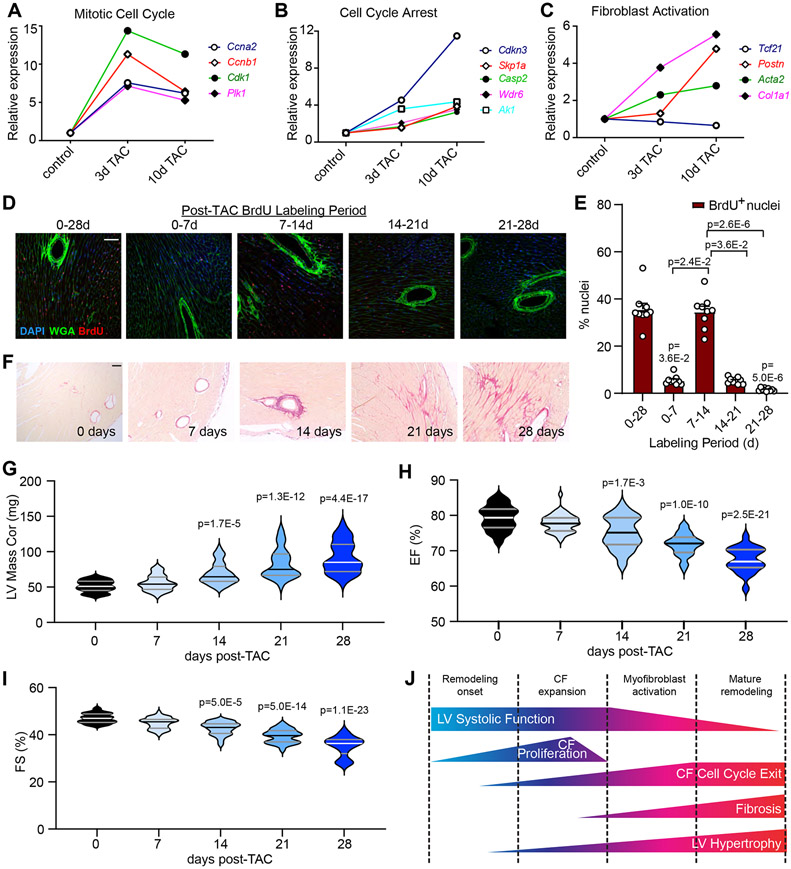
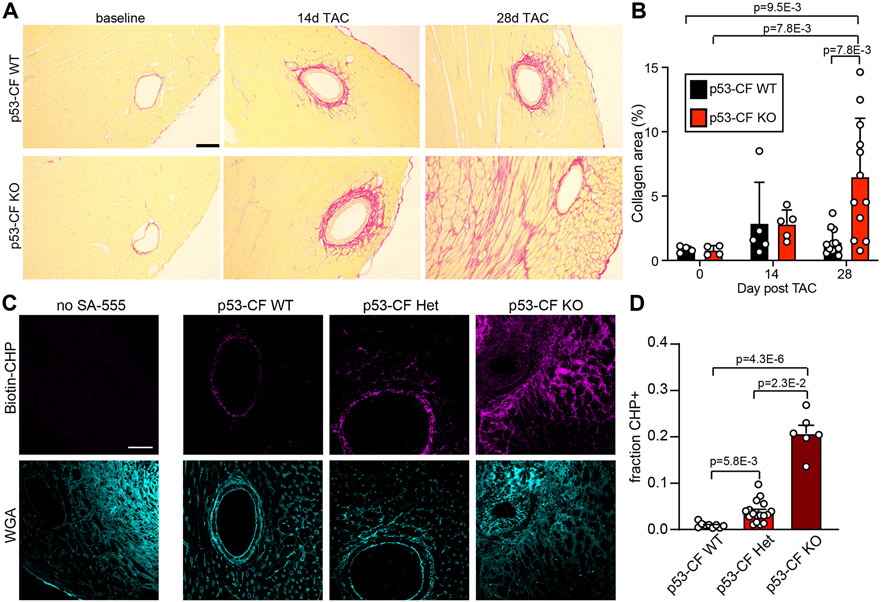
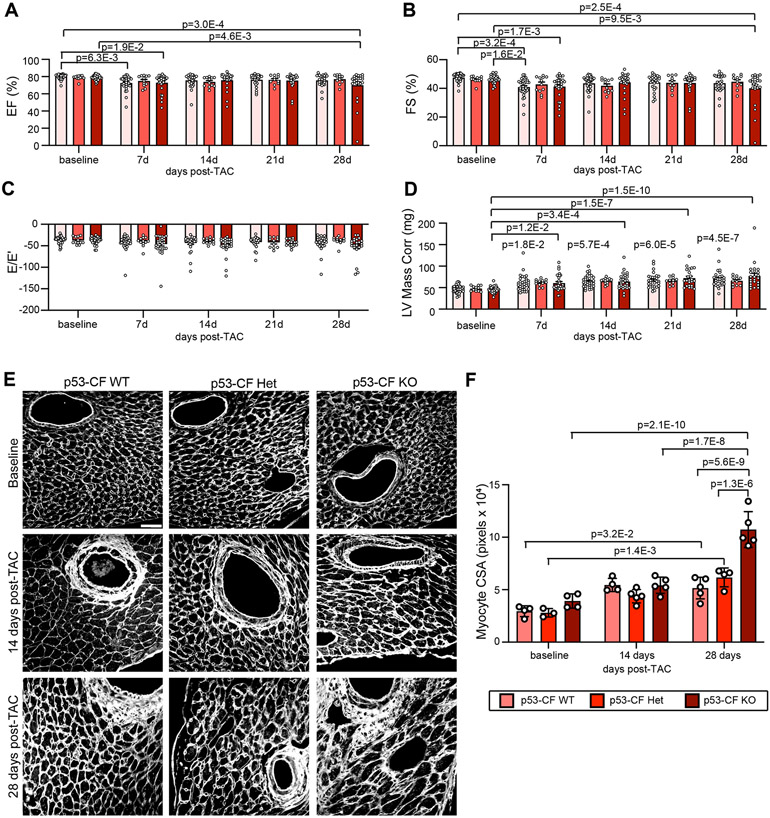
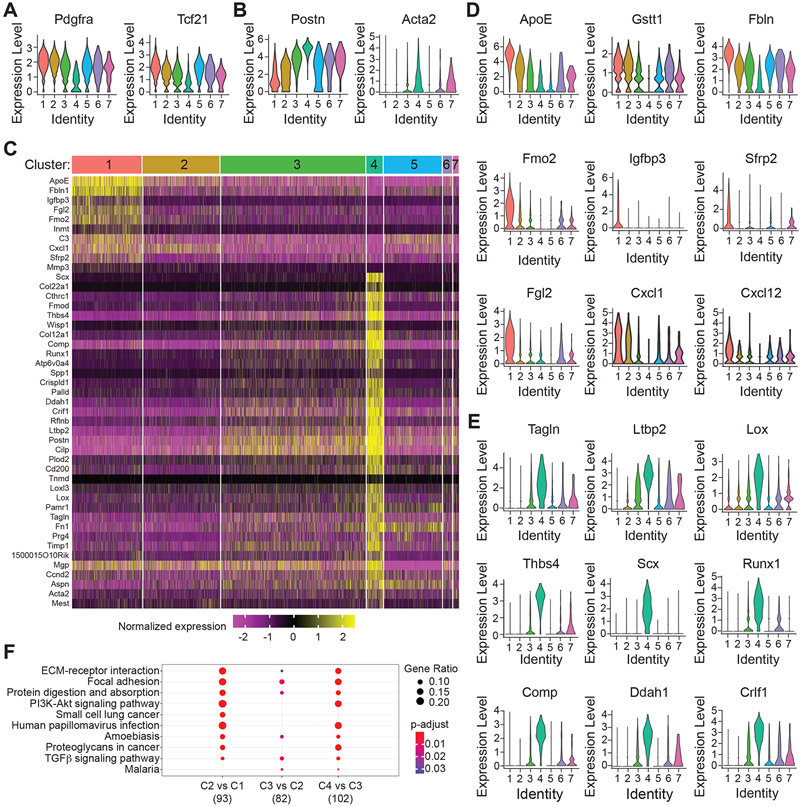
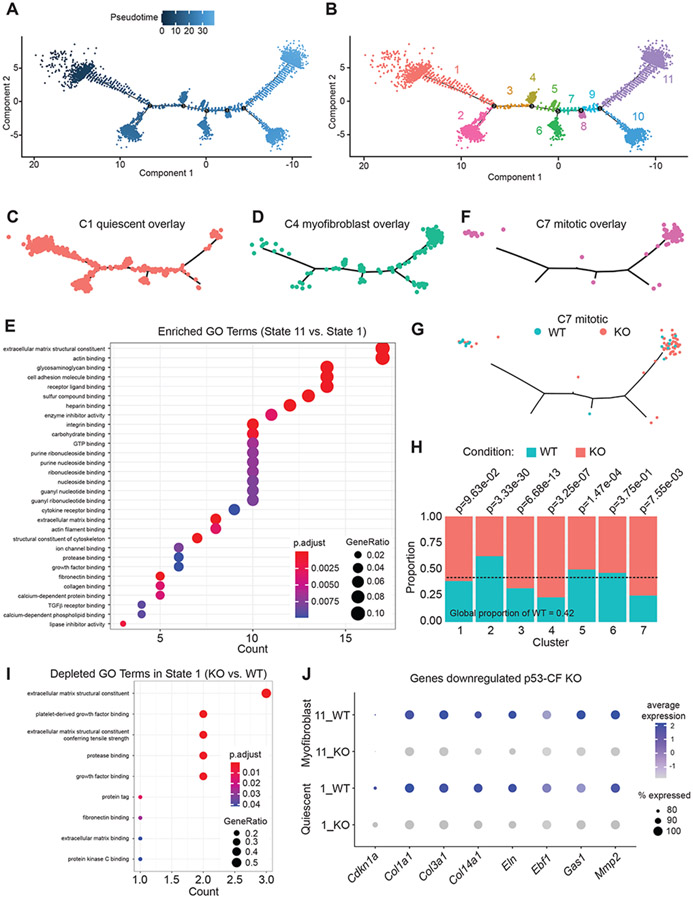
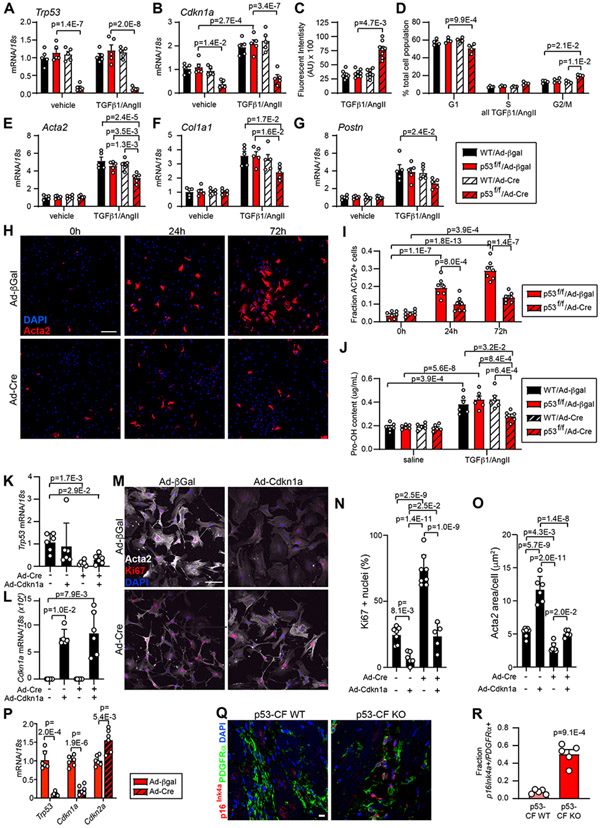
Results: Cardiac fibroblast proliferation occurs primarily between days 7 and 14 following transaortic constriction in mice, correlating with alterations in p53-dependent gene expression. p53 deletion in fibroblasts led to a striking accumulation of Tcf21-lineage cardiac fibroblasts within the normal proliferative window and precipitated a robust fibrotic response to left ventricular pressure overload. However, excessive interstitial and perivascular fibrosis does not develop until after cardiac fibroblasts exit the cell cycle. Single-cell RNA sequencing revealed p53 null fibroblasts unexpectedly express lower levels of genes encoding important ECM proteins while they exhibit an inappropriately proliferative phenotype. in vitro studies establish a role for p53 in suppressing the proliferative fibroblast phenotype, which facilitates the expression and secretion of ECM proteins. Importantly, Cdkn2a (cyclin-dependent kinase inhibitor 2a) expression and the p16Ink4a-retinoblastoma cell cycle control pathway is induced in p53 null cardiac fibroblasts, which may eventually contribute to cell cycle exit and fulminant scar formation.

Conclusions: This study reveals a mechanism regulating cardiac fibroblast accumulation and ECM secretion, orchestrated in part by p53-dependent cell cycle control that governs the timing and extent of fibrosis in left ventricular pressure overload.

Keywords: extracellular matrix; fibroblasts; fibrosis; heart; mice.


Conflict of interest statement

Disclosures None.

Figures

Figure 1.
Figure 1.. Acute transcriptional response of cardiac fibroblasts to left ventricle pressure overload.
A-C) Cardiac fibroblasts were isolated from C57BL/6J mice at baseline or at the indicated time after TAC surgery and subjected to RNA-sequencing. Relative expression of select genes that indicate active cell cycle (A), cell cycle exit (B), and fibroblast activation (C). n=6 control; n=3 3-day TAC; n=3 10-day TAC. D) Mice were subjected to TAC surgery, and injected with BrdU for the indicated time periods prior to heart isolation at 28days post-TAC. Representative images of histological sections from hearts of indicated treatment stained with an antibody directed against BrdU (red), wheat germ agglutinin to mark cell membranes (WGA, green), and DAPI to mark nuclei (blue). E) Quantification of BrdU incorporation from (D) as a percentage of total nuclei. Data is represented as Mean +/− SEM. Data points indicate results from individual mice analyzed by Kruskal-Wallis test followed by Dunn’s test to calculate pairwise comparisons. n=9 per timepoint. F) Hearts were isolated from mice at the indicated timepoints post TAC and stained with Picrosirius Red to visualize collagen. G-I) Serial echocardiographic assessment of left ventricle (LV) mass (G), LV ejection fraction (EF%) (H), and LV fractional shortening (FS%) (I). Violin plots depict data distribution of n=40 individual mice per timepoint analyzed by Kruskal-Wallis test followed by Dunn’s test to calculate pairwise comparisons. J) Schematic describing the timing of various aspects of LV remodeling in pressure overload. Scale bar = 50μm (D), 100 μm (F).
Figure 2.
Figure 2.. p53 deletion stimulates cardiac fibroblast proliferation.
A, B) Schematic indicating genotype of mice used in study (A) and experimental timeline (B) of tamoxifen (TMX) injection, TAC surgery, BrdU injections, echocardiography, and tissue harvest. C) Heart sections were obtained from mice of the indicated genotype at 14 days post-TAC, and stained with an antibody directed against p53 (brown staining). D) Quantification of p53+ perivascular mesenchymal cells from (C) analyzed by 2-sided T-test. n= 4 (p53-CF WT) and 5 (p53-CF KO). E) Heart sections were obtained from mice of the indicated genotype at 28 days post-TAC. Representative images of sections that were stained with WGA and antibodies directed against PDGFRα and BrdU. F) Quantification of BrdU incorporation into PDGFRα+ cells from images in (E). n=9 (p53-CF WT), 21 (p53-CF HET), 10 (p53-CF KO); G) Heart sections were obtained from mice of indicated genotype at 28 days post-TAC. Representative images of sections that were incubated with antibodies directed against GFP (green fibroblasts), and stained with isolectin-B4 (IB4, red endothelial cells) and DAPI (blue, nuclei). H) Quantification of GFP+ cells identified in (G). n=9 per genotype. I) Heart sections were obtained from p53-CF WT or p53-CF KO mice at indicated times. Representative images of sections that were incubated with antibodies directed against Ki67 (red), PDGFRα (green), and DAPI (blue, nuclei). J) Quantification of Ki67+ nuclei identified in (I). All data points indicate results from individual mice, and data is represented as Mean +/− SEM. Data in F, H, J is analyzed by Kruskal-Wallis test followed by Dunn’s test to calculate pairwise comparisons. Scale bar = 100μm (C); 50μm (E, G); 200μm (I).
Figure 3.
Figure 3.. p53 deletion in fibroblasts leads to an exaggerated fibrotic response in left ventricle pressure overload.
A) Heart sections were obtained from mice of indicated genotype at baseline, 14 days, or 28 days post-TAC, and stained with PicroSirius Red to visualize collagen fibrils. B) Quantification of PicroSirius Red staining from images in (A). For each genotype, n= 4 (day 0); n=5 (day 14); n=12 (day 28). C) Heart sections were obtained from mice of indicated genotype at 28 days post-TAC. Representative images of sections stained with Biotin-conjugated collagen hybridizing peptide (CHP, purple) to visualize denatured collagen as an indicator of active tissue remodeling, and wheat germ agglutinin (WGA, blue) to label cell membranes. D) Quantification of CHP staining from images in (C). n=9 (WT), 17 (HET), 8 (KO). Data is represented as Mean +/− SEM. Datapoints indicate results from individual mice. Data in is analyzed by Kruskal-Wallis test followed by Dunn’s test to calculate pairwise comparisons. Scale bar = 150μm (A) or 50μm (C).
Figure 4.
Figure 4.. Left ventricle pressure overload-induced changes in cardiac physiology upon fibroblast specific p53 deletion.
A-D) Serial echocardiography was performed in mice of indicated genotype at baseline (0d) and 7, 14, 21, and 28 days (d) post-TAC to measure left ventricle (LV) ejection fraction (EF%) (A), LV fractional shortening (FS%) (B), diastolic function (E/E’ shown in C) and LV Mass (D). Data is represented as Mean +/− SEM. Datapoints indicate results from individual mice. Data is analyzed by two-way repeated measures ANOVA with Geisser-Greenhouse correction. E) Heart sections were obtained from mice of indicated genotype at baseline, 14 days post-TAC, or 28 days post-TAC. Representative images are shown of sections that were stained with wheat germ agglutinin (WGA) to visualize cardiomyocyte cell membranes. Scale bar = 40μm. F) Cardiomyocyte cross-sectional area (CSA) was quantified from images in (E). Results in (F) reflect at least ~300-400 cardiomyocytes per mouse. Data is represented as Mean +/− SEM. Data points indicate the average CSA across 3 images for an individual mouse. Data in (F) is analyzed by Kruskal-Wallis test followed by Dunn’s test to calculate pairwise comparisons. n=3-5 mice per condition. Scale bar = 40μm
Figure 5.
Figure 5.. Single cell RNA-sequencing reveals highly proliferative population of cardiac fibroblasts.
A) Schematic indicating genotype of mice used in study, and experimental timeline of tamoxifen (TMX) injection, TAC surgery and Tcf21-lineage fibroblast isolation for single cell RNA-sequencing. B-D) Uniform Manifold Approximation and Projection (UMAP) of single Tcf21-lineage cell transcriptomes from p53-CF WT (1659 cells) and KO (3158 cells) mice obtained 14 days post-TAC, represented by genotype (B), cell identity (C) and cell cycle phase (D). Cluster 7 is defined by cells in G2/M phase of the cell cycle. E) Dot plot visualization of Gene ontology (GO) biological processes that are enriched in cluster 7, revealing p53-dependent neurological disorders, cellular senescence, and proliferation related processes. F) Expression of genes that define the highly proliferative cluster 7, depicted by violin plots. G) Dot plot visualization of gene expression for candidate p53 target genes sorted by genotype and cluster number. Color scale represents relative expression across all cells within a particular cluster, and size of dot represents the % of cells within cluster that express the indicated gene.
Figure 6.
Figure 6.. Single cell RNA-sequencing defines cardiac fibroblast phenotypes and the transition from quiescent to activated myofibroblast.
A, B) The expression of markers of the quiescent (A) and activated (B) fibroblast phenotype is represented as violin plots across all fibroblast clusters. C) Hierarchical clustering reveals the genes that define the identity of cluster 1 (quiescent) and cluster 4 (myofibroblast). D, E) Violin plots display the expression of representative genes that define quiescent cluster 1 cells (D) and activated cluster 4 cells (E). F) Dot plot visualization of GO terms that are enriched based on comparison between indicated clusters. Data reveals a stepwise progression from quiescent to activated myofibroblast traversing clusters 1, 2, 3, and 4.
Figure 7.
Figure 7.. p53 deletion in fibroblasts alters developmental trajectory in left ventricle pressure overload.
A, B) Monocle generated developmental trajectory (A) reveals the distribution of 11 cell states across pseudotime (B). C-D) The integration of cell identities within pseudotime reveals the association of cell state 1 with quiescent C1 fibroblasts (C), state 11 with activated C4 myofibroblasts (D). E) Dot plot representation of GO terms derived from genes that are enriched in State 11 compared to State 1. F) Highly proliferative cluster 7 fibroblasts are distributed bi-modally in pseudotime. G) Visualization of cluster 7 based on genotype reveals equal proportion of WT and p53 null fibroblasts in early pseudotime, while p53 null fibroblasts are over-represented in late pseudotime. H) Proportionality analysis reveals significant over-representation of WT or p53-CF KO cells in each cluster. I) Dot plot representation of GO terms that are derived from genes that are downregulated in p53 null fibroblasts in state 1. J) Dot plot representation of genes representative of the impact of p53 deletion on fibroblast activation in state 1 and 11.
Figure 8.
Figure 8.. p53 deletion accelerates cardiac fibroblast cell cycle at the expense of myofibroblast activation.
Cardiac fibroblasts were isolated from WT or p53-fl/fl mice and treated with adenovirus directing the expression of β-galactosidase (β-Gal) or Cre-recombinase (Cre) for 24 hrs. Cardiac fibroblasts of indicated genotype and transduction were treated with vehicle or TGF-β1(10ng/mL)/AngII (1μM) for an additional 24 hrs (for RNA) or 72 hrs (for protein) prior to indicated assay. A, B) qRT-PCR reveals the expression of Trp53 (A) and Cdkn1a (B). C) Cardiac fibroblast proliferation was quantified by Cyquant assay. D) Cell cycle phase was determined by flow cytometry of propidium iodide-stained cells. E-G) qRT-PCR reveals the expression of Acta2 (E) Col1a1 (F) and Postn (G). H) Immunocytochemistry using an antibody directed against Acta2 (red) reveals activated myofibroblasts in p53–fl/fl cultures treated with TGF-β1 (10ng/mL)/AngII (1μM) and Ad/β-Gal or Ad/Cre for the indicated time. Nuclei are labeled with DAPI (blue). Scale bar = 50 μm. I) Quantification of Acta2 staining as a percentage of total cells shown in (H). J) Hydroxyproline incorporation assay reveals the relative level of collagen (Pro-OH content) in the conditioned media. K - O) Cardiac fibroblasts were isolated from p53-fl/fl mice and treated +/− Ad/Cre +/− Ad/Cdkn1a, followed by stimulation with TGF-β1(10ng/mL)/AngII (1μM) for 72 hours to induce myofibroblast activation. qRT-PCR reveals the expression of Trp53 (K) and Cdkn1a (L). Immunocytochemistry revealed Acta2+ stress fibers (white), Ki67+ proliferating cells (red), and nuclei (DAPI, blue) (M). Ki67+ nuclei (%) was quantified in (N) and Acta2+ area/cell is quantified in (O). Scale bar in (M) = 100 μm. P) p53 was deleted by Ad/Cre treatment 72 hrs after myofibroblast activation with TGF-β1(10ng/mL)/AngII (1μM). 24 hrs later, RNA was isolated and qRT-PCR was performed to investigate expression of indicated genes. Q) Heart sections obtained from mice of indicated genotype 28 days post-TAC were incubated with antibodies directed against PDGFRα (fibroblasts, green) and p16Ink4a (red). DAPI labels nuclei (blue). Scale bar = 10 μm. R) Quantification of PDGFRα / p16Ink4a double positive cells in (Q). Datapoints indicate results of individual biological replicate cell culture well or individual mouse. Data is represented as Mean +/− SEM. Data is analyzed by Kruskal-Wallis test followed by Dunn’s test to calculate pairwise comparisons (C, K, L, M, O); or by two-way repeated measures ANOVA with Geisser-Greenhouse correction (A, B, D, E, F, G, I, J); or by unpaired, two-tailed t-test with Welch’s correction (P, R).

Comment in

References

    1. Russo I, Cavalera M, Huang S, Su Y, Hanna A, Chen B, Shinde AV, Conway SJ, Graff J and Frangogiannis NG. Protective Effects of Activated Myofibroblasts in the Pressure-Overloaded Myocardium Are Mediated Through Smad-Dependent Activation of a Matrix-Preserving Program. Circ Res. 2019;124:1214–1227. - PMC - PubMed
    1. Hill JA and Olson EN. Cardiac plasticity. N Engl J Med. 2008;358:1370–80. - PubMed
    1. Mozaffarian D, Benjamin EJ, Go AS, Arnett DK, Blaha MJ, Cushman M, Das SR, de Ferranti S, Despres JP, Fullerton HJ, et al. Heart Disease and Stroke Statistics-2016 Update: A Report From the American Heart Association. Circulation. 2016;133:e38–360. - PubMed
    1. Moore-Morris T, Tallquist MD and Evans SM. Sorting out where fibroblasts come from. Circ Res. 2014;115:602–4. - PMC - PubMed
    1. Teekakirikul P, Eminaga S, Toka O, Alcalai R, Wang L, Wakimoto H, Nayor M, Konno T, Gorham JM, Wolf CM, et al. Cardiac fibrosis in mice with hypertrophic cardiomyopathy is mediated by non-myocyte proliferation and requires Tgf-beta. J Clin Invest. 2010;120:3520–9. - PMC - PubMed

Publication types

Substances