. 2023 Aug;148(5):405-425.
doi: 10.1161/CIRCULATIONAHA.122.063759. Epub 2023 Jul 6.

Extracellular Vesicle-Encapsulated Adeno-Associated Viruses for Therapeutic Gene Delivery to the Heart

Affiliations

Extracellular Vesicle-Encapsulated Adeno-Associated Viruses for Therapeutic Gene Delivery to the Heart

Xisheng Li et al. Circulation. 2023 Aug.

Abstract

Background: Adeno-associated virus (AAV) has emerged as one of the best tools for cardiac gene delivery due to its cardiotropism, long-term expression, and safety. However, a significant challenge to its successful clinical use is preexisting neutralizing antibodies (NAbs), which bind to free AAVs, prevent efficient gene transduction, and reduce or negate therapeutic effects. Here we describe extracellular vesicle-encapsulated AAVs (EV-AAVs), secreted naturally by AAV-producing cells, as a superior cardiac gene delivery vector that delivers more genes and offers higher NAb resistance.

Methods: We developed a 2-step density-gradient ultracentrifugation method to isolate highly purified EV-AAVs. We compared the gene delivery and therapeutic efficacy of EV-AAVs with an equal titer of free AAVs in the presence of NAbs, both in vitro and in vivo. In addition, we investigated the mechanism of EV-AAV uptake in human left ventricular and human induced pluripotent stem cell-derived cardiomyocytes in vitro and mouse models in vivo using a combination of biochemical techniques, flow cytometry, and immunofluorescence imaging.

Results: Using cardiotropic AAV serotypes 6 and 9 and several reporter constructs, we demonstrated that EV-AAVs deliver significantly higher quantities of genes than AAVs in the presence of NAbs, both to human left ventricular and human induced pluripotent stem cell-derived cardiomyocytes in vitro and to mouse hearts in vivo. Intramyocardial delivery of EV-AAV9-sarcoplasmic reticulum calcium ATPase 2a to infarcted hearts in preimmunized mice significantly improved ejection fraction and fractional shortening compared with AAV9-sarcoplasmic reticulum calcium ATPase 2a delivery. These data validated NAb evasion by and therapeutic efficacy of EV-AAV9 vectors. Trafficking studies using human induced pluripotent stem cell-derived cells in vitro and mouse hearts in vivo showed significantly higher expression of EV-AAV6/9-delivered genes in cardiomyocytes compared with noncardiomyocytes, even with comparable cellular uptake. Using cellular subfraction analyses and pH-sensitive dyes, we discovered that EV-AAVs were internalized into acidic endosomal compartments of cardiomyocytes for releasing and acidifying AAVs for their nuclear uptake.

Conclusions: Together, using 5 different in vitro and in vivo model systems, we demonstrate significantly higher potency and therapeutic efficacy of EV-AAV vectors compared with free AAVs in the presence of NAbs. These results establish the potential of EV-AAV vectors as a gene delivery tool to treat heart failure.

Keywords: extracellular vesicles; genetic therapy.


Conflict of interest statement

Disclosures None.

Figures

Figure 1.
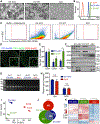
Figure 1.. Density-gradient ultracentrifugation-based purification process successfully enriched EV-AAVs.
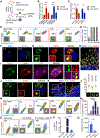
(A) Schematic of EV-AAV isolation, characterization, function, tropism and uptake mechanism. (B) Density of 12 fractions obtained afteriodixanol density-gradient ultracentrifugation, n=3. (C) Western blot analysis of the 12 fractions. Equal volume of fractions was loaded on SDS-PAGE gels, and membranes were blotted with Alix, Flot1, Tsg101, Gm130, and Cyc1. (D) WB quantification for the percent of Alix relative expression in 12 fractions, n=3. (E) Determination of AAV vector genomes with qPCR in the 12 fractions, n=3. (F, G) Nano-flow cytometry analysis and quantification of surface tetraspanin proteins including CD63, CD81, and CD9 in the 12 fractions, n=3. Mean equivalent soluble fluorochromes (MESF) were used to calibrate the fluorescence scale in MESF units for each fraction. No MESF values were detected in fractions other than Fr3 and 4 where EV-AAVs were properly separated from other contaminants. (H) TRPS-qNano analysis of Fr3 and 4 measured EV-AAV size. (B, D, E, and F) are presented as mean ± SEM.
Figure 2.
Figure 2.. EV-AAVs share morphological and biochemical characteristics with EV-WT and are enriched for unique transcriptomes.
(A) Representative images of transmission electron microscopy (TEM) for EV-AAV (left), EV-WT (middle) and free AAV (right side); arrows indicate virus particles inside EVs. Scale: 100 nm. (B) EV-AAV, EV-WT, and free AAV sizes measured by dynamic light scattering (DLS) analysis. (C) Nano-flow cytometry analysis of EV-AAVs, EV-WT, and free AAVs for the presence of surface tetraspanin proteins including CD63, CD81, and CD9. Buffer plus tetraspanin was used as a control for gating. (D and E) Distribution and quantification of tetraspanin (CD63, CD81, and CD9)-positive particles in EV-AAV and EV-WT by NanoView chips. (F) Western blot of EV-AAVs, EV-WT, and free AAVs. Equal protein amounts (5 μg) for EV-AAV and EV-WT and equal AAV genomes (1e11 vector genome (vg)) for EV-AAV and free AAVs were loaded in the SDS page gel (n=2 technical replicates). Membranes were blotted with Alix, Flot1, Tsg101, Gm130, Cyc1, and VP1/VP2/VP3. (G) Image of alkaline agarose gel electrophoresis for equal vector genomes (1e11 and 5e10) of EV-AAVs and free AAVs. (H) Quantification of band intensity of (G). (I) Principal component analysis to identify the axis of variance showing that EV-AAV, EV-WT, and AAV each enriched for unique transcriptomic profiles. (J) Venn diagram showing an overlap among EV-AAV, EV-WT, and AAV and a set of common RNA present in EV-AAV and EV-WT. (K) Heatmap with top differentially expressed profiles for EV-AAV, EV-WT, and AAV. The scale is standardized (z-score) from the Log2 Expression values showing the upregulated genes in red and the downregulated genes in blue. (E and H) were analyzed with two-way ANOVA with Tukey multiple comparison Test. Data are presented as mean ± SEM (n=3); n.s., not significant, *P < 0.05.
Figure 3.
Figure 3.. EV-AAVs outperform AAVs in gene delivery efficiency to human cardiomyocytes in the presence of NAb in vitro.
(A and B) Representative images of flow cytometry and confocal microscopy analyses of hAC16-CMs at 3 days post infection with equal titers of EV-AAV6-mCherry and AAV6-mCherry. Before being added to cell cultures, AAV6 or EV-AAV6 preparations were incubated with NAb solution (0.125–4 mg/ml) or equal volume of PBS for 30 minutes at 37°C. Scale bar, 150 μm. (C) Flow cytometry quantification of mCherry+ hAC16-CMs after EV-AAV6 or AAV6 transduction at different NAb concentrations (n=4). (D) Confocal microscopy quantification of mCherry intensity in hAC16-CMs after EV-AAV6 or AAV6 transduction at different NAb concentrations (n=4). (C and D) are presented as median with range and were analyzed with Mann-Whitney U test. *P< 0.05. (E and F) Representative images of flow cytometry and confocal microscopy analyses of hiPSC-CMs at 3 days post infection with equal titers of EV-AAV6-mCherry and AAV6-mCherry. Before being added to cell cultures, AAV6 or EV-AAV6 preparations were incubated with NAb solution (0.5–4 mg/ml) or equal volume of PBS for 30 minutes at 37°C. Gating for mCherry+ population is derived from SIRPA+ population. Scale bar, 150 μm. (G) Flow cytometry quantification of mCherry+ hiPSC-CMs after EV-AAV6 or AAV6 transduction at different NAb concentrations (n=3). (H) Confocal microscopy analysis of mCherry intensity in hiPSC-CMs transduced with EV-AAV6 or AAV6s at different NAb concentrations (n=3). Values are present as Log10 mCherry fluorescent intensity. (B and G) were adjusted with the same brightness and contrast. (F and H) are presented as mean ± SEM and were analyzed with Welch’s t-test. *P< 0.05, **P<0.01.
Figure 4.
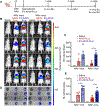
Figure 4.. EV-AAVs deliver genes more efficiently than AAVs in the presence of NAb in vivo.
(A) Study design. (B) Bioluminescent images of nude mice at 4 weeks post injection of equal titer (5e10 vg/mouse) of EV-AAV9-FLuc, AAV9-FLuc, or saline (as an imaging negative control) directly into myocardium. 24 hours before EV-AAV9/AAV9 administration, mice were intravenously injected with saline (NAb-) or NAb (NAb+, 1mg NAb/mouse). (C) Bioluminescent signal quantification of EV-AAV-FLuc, AAV-FLuc, and saline in the heart and liver regions of NAb− and NAb+ mice (n=4). (D) Ex vivo imaging of hearts from NAb− and NAb+ mice injected with EV-AAV9-FLuc, AAV9-FLuc, and saline. Mice were sacrificed at 4 weeks after EV-AAV9/AAV9 administration; organs were removed and imaged in the IVIS system. (E) Bioluminescent signal quantitation for EV-AAV, AAV, and saline in ex vivo hearts from NAb− and NAb+ mice (n=4). (C and E) were analyzed with two-way ANOVA and pairwise comparisons with Bonferroni multiple comparison test. Saline groups were used to assess background (negative controls) and are excluded from analysis. *P< 0.05. Data are presented as mean ± SEM.
Figure 5.
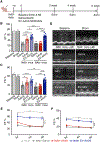
Figure 5.. EV-AAV-mediated SERCA2a gene delivery significantly improves cardiac function in the presence of NAb in a preclinical mouse model of MI.
(A) Study design. (B) Echocardiographic assessments of left ventricular function showing EF (%) and (C) FS (%) at 6 weeks post MI in NAb− and NAb+ mice (1mg NAb/mouse) injected with equal titer (1e11 vg/mouse) of EV-AAV9-SERCA2a, AAV9-SERCA2a, or saline (n=6–10). Data were analyzed with two-way ANOVA and pairwise comparisons with Bonferroni multiple comparison test. Baseline and sham groups were negative controls and were excluded from the statistical comparison. (D) Representative M-Mode echocardiograms showing anterior and posterior left ventricle wall motion at 6 weeks post MI in NAb− and NAb+ mice. (E) Trendlines for EF and (F) FS, respectively, from 2 weeks to 6 weeks post MI. Data were analyzed with two-way repeated-measures ANOVA followed by Bonferroni multiple comparison test for NAb+EV-AAV-SERCA2a group compared with NAb+AAV9-SERCA2a group. *P< 0.05, **P< 0.01, and ***P< 0.001. Data are presented as mean ± SEM.
Figure 6.
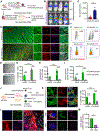
Figure 6.. EV-AAVs exhibit cardiotropism
(A) Study design to examine cardiotropsim of EV-AAV9 in vivo. (B) In vivo bioluminescent images of nude mice at 2 weeks post intramyocardial injection (1e12 vg/mouse) of EV-AAV9-FLuc or AAV9-FLuc. 24 hours before EV-AAV9/AAV9 administration, each mouse was intravenously injected with 5mg NAb or saline. (C) Bioluminescent signal quantification of EV-AAV-FLuc or AAV-FLuc in the heart regions (n=4). Data were analyzed with the 2-tailed Student’s t-test. (D)Immunofluorescence images for cTNT, Luciferase, CD31 and Vimentin in the left ventricles of hearts from the nude mice at 2 weeks post intramyocardial injection of EV-AAV9-FLuc or AAV9-FLuc. DAPI-blue; cTNT-green; Luciferase-red; CD31/Vimentin-magenta. Scale bar, left, 200μm; right, 50 μm. (E) Representative brightfield images of cardiomyocytes (CMs) and non-cardiomyocytes (NMs). A langendorff perfusion method was used to isolate CMs and NMs from mice heart left ventricles. Scale bar, 50 μm. (F) Flow cytometry images and quantification (G) of Luciferase+ CMs and NMs from the left ventricles injected with EV-AAV9-FLuc or AAV9-FLuc (n=3). (H) Luciferase activity of CMs and NMs from the left ventricles injected with EV-AAV9-FLuc or AAV9-FLuc (n=3). Values are normalized to 1000 cells. (I) Vector genome copies in CMs and NMs from the left ventricle injected with EV-AAV9-FLuc or AAV9-FLuc (n=3). Values are normalized to 1000 cells. (J) Study design to examine cardiotropsim of EV-AAV6s in hiPSC-CMs and NMs. (K) Representativeimmunocytochemistry (ICC) images and quantification for luciferase expression on hiPSC- cTNT+-CMs and cTNTNMs transduced with AAV6-FLuc or EV-AAV6-FLuc after 48 hours (MOI= 2e5 vg/cell). DAPI-blue; cTNT-green; luciferase-red. Scale bar, 100 μm. (G, H, I and K) were analyzed with two-way ANOVA and pairwise comparisons with Bonferroni multiple comparison test. (L) Representativeimmunocytochemistry images for PKH67, AAV6 and cTNI of cTNI+ hiPSC-CMs and cTNI hiPSC-NMs at 10 hours post-incubation with PKH67-labeled EV-AAV6 (MOI= 1e6 vg/cell). DAPI-blue; PKH67-green; cTNI-red; AAV6-magenta. Scale bar, left, 50 μm; right, 5 μm. (M) Vector genome copies in isolated nuclei of hiPSC-CMs and NMs at 24-hour post-incubation with EV-AAV6 (MOI=1e5 vg/cell; n=3). Data were analyzed with Welch’s t-test. *P<0.05, **P< 0.01, ***P< 0.001. Data are presented as mean ± SEM.
Figure 7.
Figure 7.. EV-AAV uptake involves trafficking via endocytic/acidic compartments
(A) Study design to examine involvement endocytic pathway and AAV receptors (AAVR). (B) Relative transduction efficiency of EV-AAV6-FLuc and AAV6-FLuc in hAC16-CMs following GRAF1 or (C) AAVR knockdown by siRNA. Relative luciferase activities are normalized to each siRNA-Control. Data were analyzed with two-way ANOVA followed by Dunnett multiple comparison test (n=3). (D) Flow cytometry analysis showing PKH67-labeled EV-AAV6 uptake in hAC16-CMs at different time points. Scale bar, 20 μm. (E) Quantification of PKH67+ hAC16-CMs at 1, 4, 10, 24 hours (n=3). (F) Confocal microscopy analysis showing the internalization of PKH67-labeled EV-AAV6 in hAC16-CMs at 4 hours and 10 hours. Scale bar, 5 μm. (G) Immunostaining for LAMP1 on hAC16-CMs at 10 hours post incubation with PKH67-labeled EV-AAV6 (blue, DAPI; green, PKH67-labeled EV-AAV; red, LAMP1; yellow, colocalization of PKH67 and LAMP1). Scale bar, 2 μm. (H) Three-dimensional (3D) visualization showing the colocalization of PKH67-labeled EV-AAV6 and LAMP1+ sub-compartments, performed with Imaris 9.8. Scale bar, 2 μm. (I) Immunostaining for LAMP1 on hiPSC-CMs at 10 hours post incubation with PKH67-labeled EV-AAV6. DAPI-blue; PKH67-labeled EV-AAV-green; LAMP1-red; cTNI-magenta; white arrows showed colocalization of PKH67 and LAMP1. Scale bar, 5 μm. (J) Immunostaining for intact AAV6 particles on hAC16 cells at 10 hours post incubation with PKH67-labeled EV-AAV. Scale bar, 2 μm. (K) 3D visualization showing the colocalization or delocalization of PKH67-labeled EV-AAV6 and AAV6, performed with an Imaris 9.8. White arrows point to released free AAVs labeled red. Scale bar, left, 5 μm; right, 2 μm. (L) Quantification of the PKH67 and AAV colocalization in (K): G; green, PKH67; R, red, AAV6; RG, red and green (n=5). (M) Flow cytometry analysis and quantification (N) showing PKH67 and CypHer-labeled EV-AAV6 uptake in hAC16-CMs at different time points (n=3). Scale bar, 20 μm. Data were analyzed with Welch’s one-way ANOVA followed by Dunnett-T3 multiple comparison test. (O) Flow cytometry analysis and quantification (P) showing PKH67 and CypHer-labeled EV-AAV6 uptake in hAC16-CMs at 10 hours after treatment with bafilomycin A1 (n=3). Scale bar, 20 μm. Data were analyzed with one-way ANOVA followed by Tukey multiple comparison test. (Q) Luciferase activity of hAC16-CMs transduced with EV-AAV6 after 48 hours. hAC16-CMs were treated with DMSO or Baf-1A for 2 hours prior to transduction with EV-AAV6 (n=4). Data are present as median ± interquartile range and were analyzed with Mann-Whitney U test. (B, C, E, L, N and P) are presented as mean ± SEM. *P<0.05, **P< 0.01, ***P < 0.001.
Figure 8.
Figure 8.. Schematic of EV-AAV uptake in cardiomyocytes.
Free AAVs bind with neutralizing antibodies that block AAV delivery into cells. EV-AAVs protect the AAV from this neutralizing effect to improve gene delivery to cardiomyocytes. In the cytoplasm, EV-AAVs are taken up into acidic sub-cellular compartments such as late endosomes and lysosomes, which may release the AAVs from EV-AAVs, thereby enabling nuclear entry and gene expression.

References

    1. Ginn SL, Amaya AK, Alexander IE, Edelstein M, Abedi MR. Gene therapy clinical trials worldwide to 2017: An update. J Gene Med. 2018;20:e3015. doi: 10.1002/jgm.3015 - DOI - PubMed
    1. MacLaren RE, Groppe M, Barnard AR, Cottriall CL, Tolmachova T, Seymour L, Clark KR, During MJ, Cremers FP, Black GC, et al. Retinal gene therapy in patients with choroideremia: initial findings from a phase ½ clinical trial. Lancet. 2014;383:1129–1137. doi: 10.1016/S0140-6736(13)62117-0 - DOI - PMC - PubMed
    1. Rangarajan S, Walsh L, Lester W, Perry D, Madan B, Laffan M, Yu H, Vettermann C, Pierce GF, Wong WY, et al. AAV5-Factor VIII Gene Transfer in Severe Hemophilia A. N Engl J Med. 2017;377:2519–2530. doi: 10.1056/NEJMoa1708483 - DOI - PubMed
    1. Ribeil JA, Hacein-Bey-Abina S, Payen E, Magnani A, Semeraro M, Magrin E, Caccavelli L, Neven B, Bourget P, El Nemer W, et al. Gene Therapy in a Patient with Sickle Cell Disease. N Engl J Med. 2017;376:848–855. doi: 10.1056/NEJMoa1609677 - DOI - PubMed
    1. Greenberg B, Butler J, Felker GM, Ponikowski P, Voors AA, Desai AS, Barnard D, Bouchard A, Jaski B, Lyon AR, et al. Calcium upregulation by percutaneous administration of gene therapy in patients with cardiac disease (CUPID 2): a randomised, multinational, double-blind, placebo-controlled, phase 2b trial. Lancet. 2016;387:1178–1186. doi: 10.1016/S0140-6736(16)00082-9 - DOI - PubMed

Publication types

MeSH terms

Substances

Supplementary concepts