. 2023 Jul 6:12:e87902.
doi: 10.7554/eLife.87902.

Conditional deletion of neurexins dysregulates neurotransmission from dopamine neurons

Affiliations

Conditional deletion of neurexins dysregulates neurotransmission from dopamine neurons

Charles Ducrot et al. Elife. .

Abstract

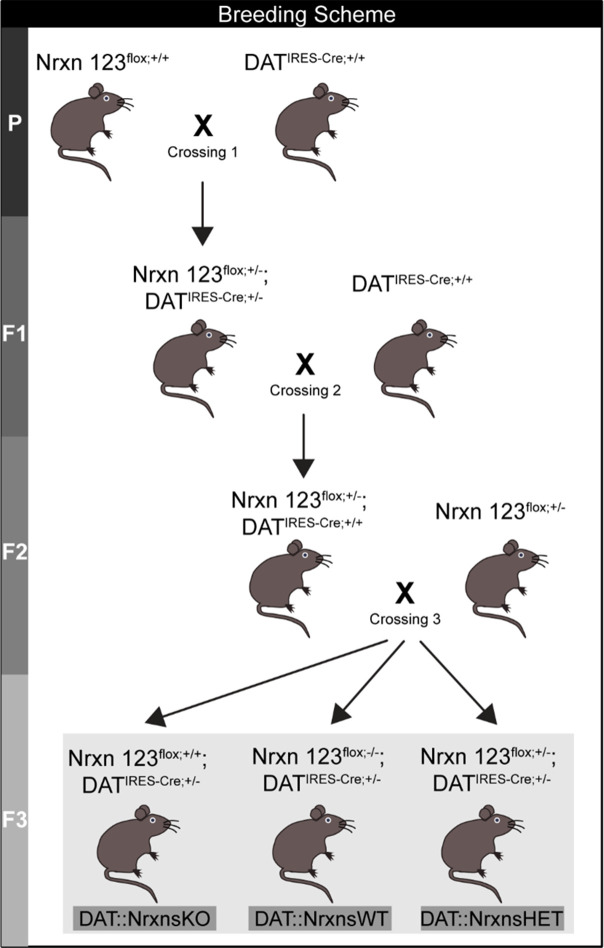
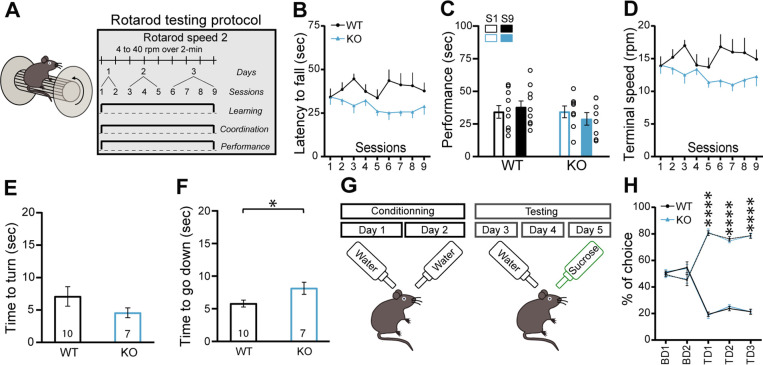
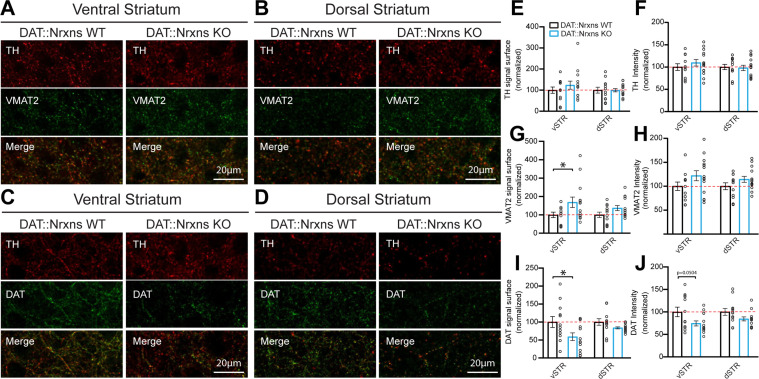
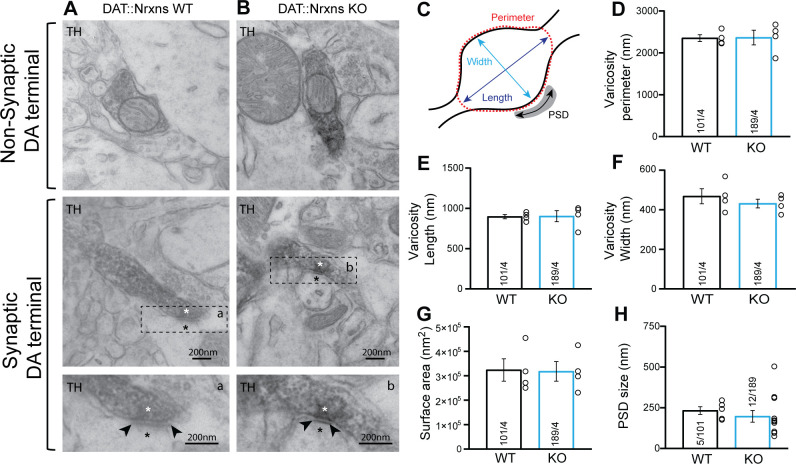
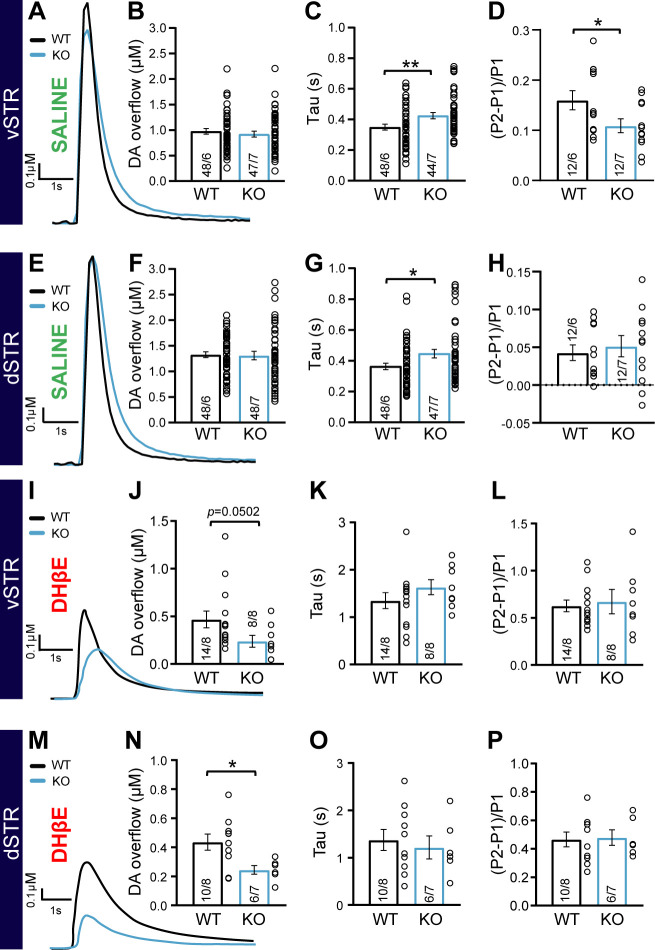
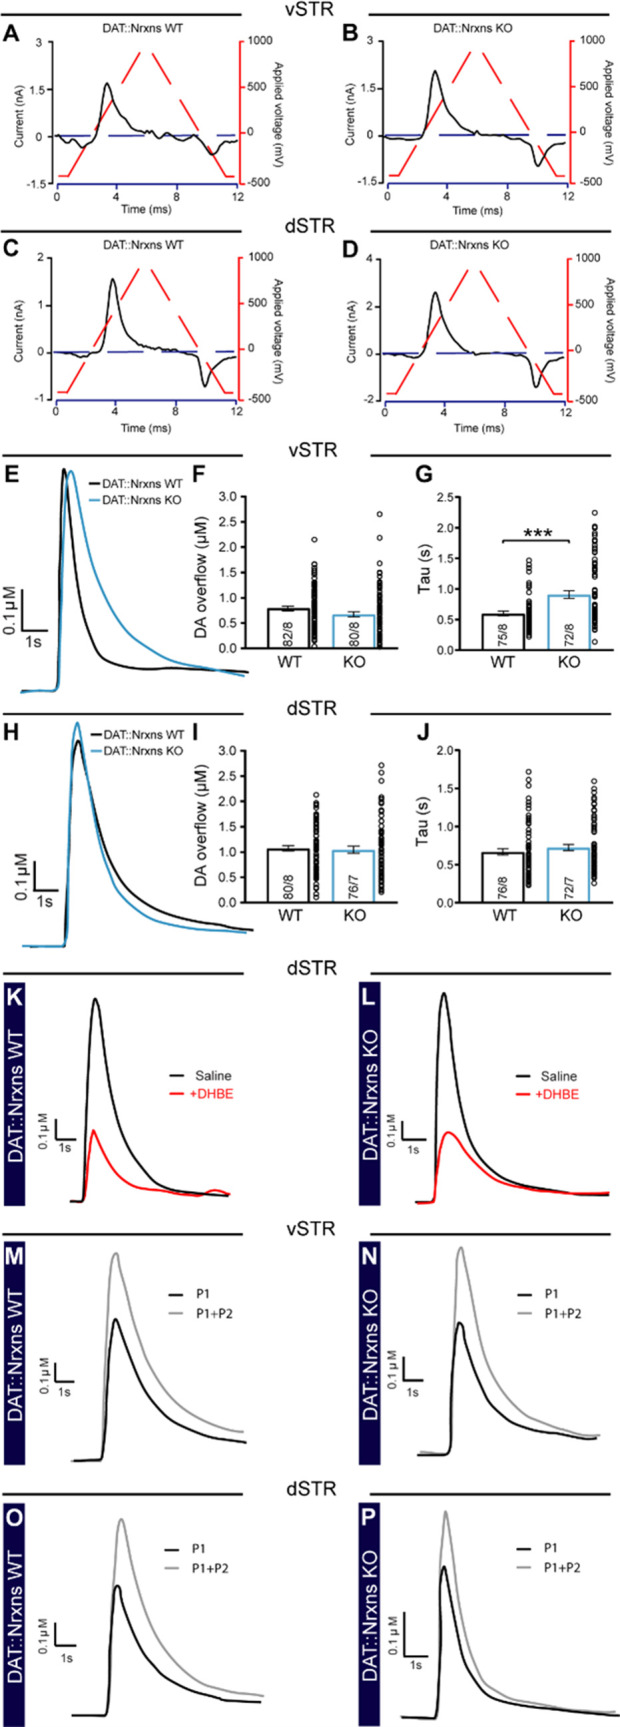
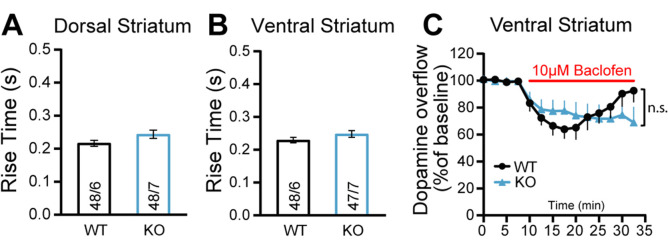
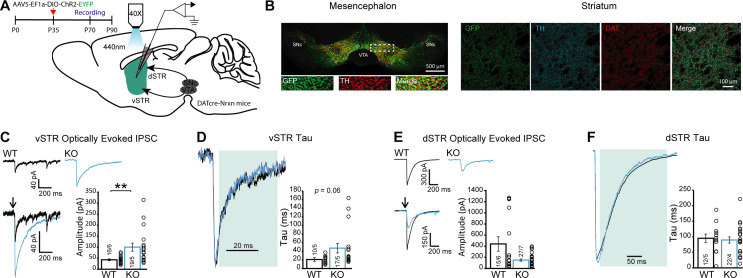
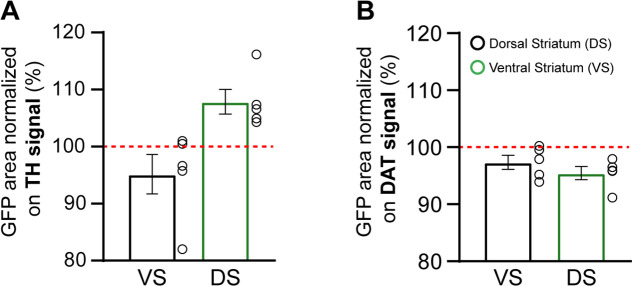
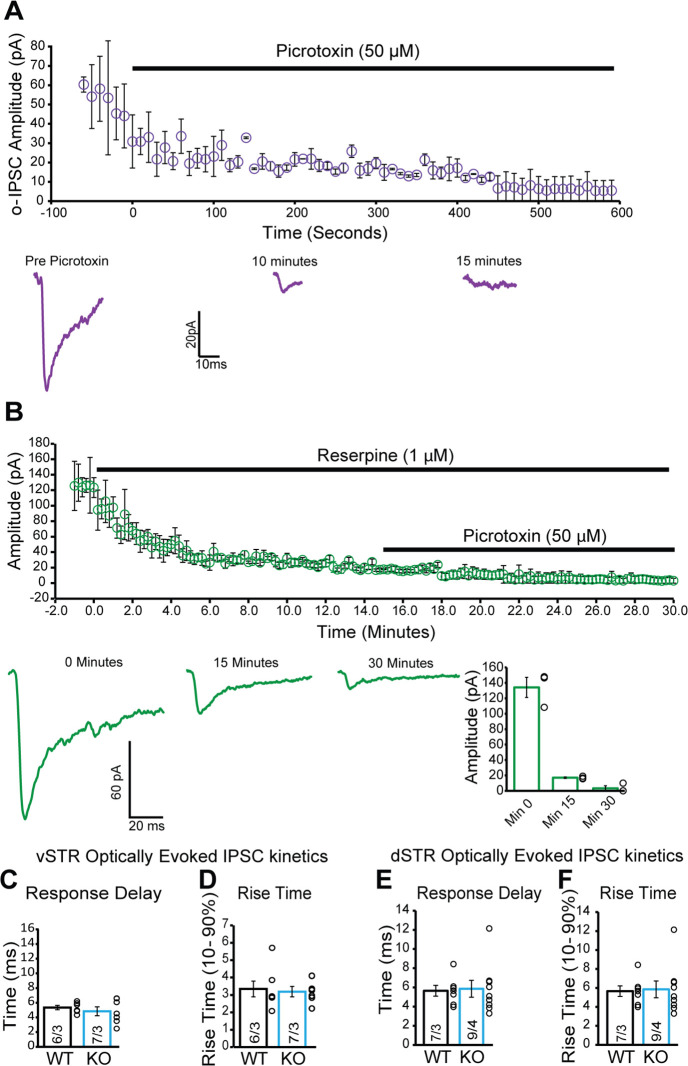
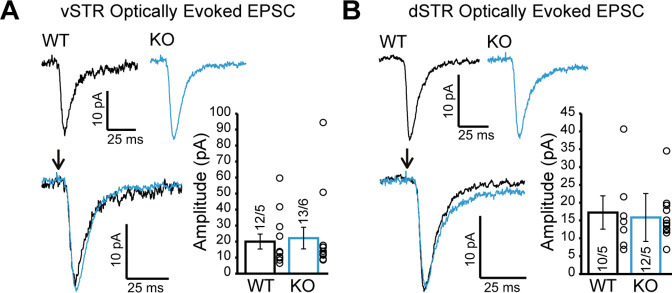
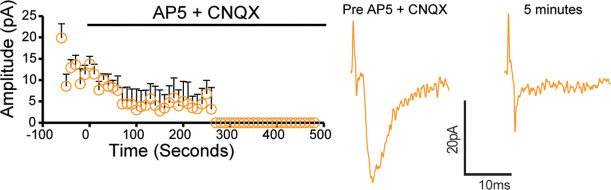
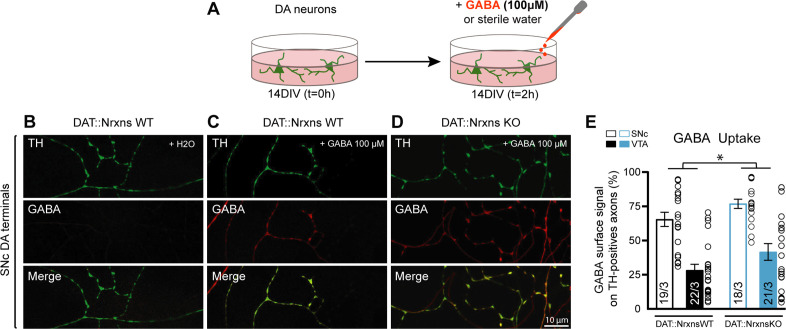
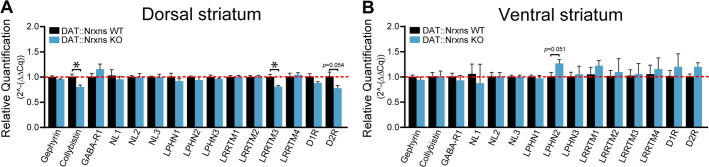
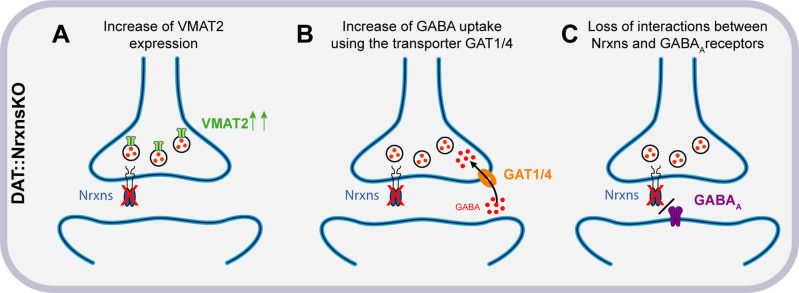
Midbrain dopamine (DA) neurons are key regulators of basal ganglia functions. The axonal domain of these neurons is highly complex, with a large subset of non-synaptic release sites and a smaller subset of synaptic terminals from which in addition to DA, glutamate or GABA are also released. The molecular mechanisms regulating the connectivity of DA neurons and their neurochemical identity are unknown. An emerging literature suggests that neuroligins, trans-synaptic cell adhesion molecules, regulate both DA neuron connectivity and neurotransmission. However, the contribution of their major interaction partners, neurexins (Nrxns), is unexplored. Here, we tested the hypothesis that Nrxns regulate DA neuron neurotransmission. Mice with conditional deletion of all Nrxns in DA neurons (DAT::NrxnsKO) exhibited normal basic motor functions. However, they showed an impaired locomotor response to the psychostimulant amphetamine. In line with an alteration in DA neurotransmission, decreased levels of the membrane DA transporter (DAT) and increased levels of the vesicular monoamine transporter (VMAT2) were detected in the striatum of DAT::NrxnsKO mice, along with reduced activity-dependent DA release. Strikingly, electrophysiological recordings revealed an increase of GABA co-release from DA neuron axons in the striatum of these mice. Together, these findings suggest that Nrxns act as regulators of the functional connectivity of DA neurons.

Keywords: GABA; co-transmission; dopamine; mouse; neurexins; neuroscience; synaptic terminals.

Plain language summary

The human brain contains billions of nerve cells, known as neurons, which receive input from the outside world and process this information in the brain. Neurons communicate with each other by releasing chemical messengers from specialized structures, called axon terminals, some of which form junctions known as synapses. These messengers then generate signals in the target neurons. Based on the type of chemical they release, neurons can be classified into different types. For example, neurons releasing dopamine are considered to act as key regulators of learning, movements and motivation. Such neurons establish very large numbers of axon terminals, but very few of them form synapses. Specific sets of proteins, including neurexins and neuroligins, are thought to help regulate the activity of the connexions between these neurons. Previous research has shown that when neuroligins were removed from the neurons of worms or mice, it affected the ability of the animals to move. So far, the role of neurexins in managing the connectivity of regulatory neurons, such as those releasing dopamine, has received much less attention. To bridge this knowledge gap, Ducrot et al. explored how removing neurexins from dopamine neurons in mice affected their behaviour. The experiments revealed that eliminating neurexins did not affect their motor skills on a rotating rod, but it did reduce their movements in response to the psychostimulant amphetamine, a molecule known to enhance dopamine-associated behaviours. The cellular structure of dopamine neurons lacking neurexins was the same as in neurons containing this protein. But dopamine neurons without neurexins were slower to recycle dopamine, and they released a higher amount of the inhibitory messenger GABA. This suggests that neurexin acts as an important suppressor of GABA secretion to help regulate the signals released by dopamine neurons. These findings set the stage for further research into the role of neurexins in regulating dopamine and other populations of neurons in conditions such as Parkinson’s disease, where movement and coordination are affected.


Conflict of interest statement

CD, Gd, BD, CD, PH, NG, CP, SM, MB, MP, LC, LT No competing interests declared

Figures

Figure 1.
Figure 1.. DAT::NrxnsKO mice exhibit impaired amphetamine-induced motor activity.
(A) Schematic representation of a mouse on a rotarod and the diagram of the rotarod testing protocol for the speed 1. (B) Performance on the accelerating rotarod during nine sessions over 3 consecutive days. Latency to fall was quantified at rotation speeds from 4 to 40 rpm over 10 min. (C) Performance of DAT::NrxnsKO and WT littermate mice on the rotarod was evaluated comparing the last session and the first session for each mouse. The results show a significant improvement in performance irrespective of genotype. (D) Quantification of the terminal speed over all the sessions shows no difference between the DAT::NrxnsKO and WT littermate mice. (E) Basal horizontal activity in a novel environment before and after a saline injection (10 mL/kg) over a total of 60 min. (F) Horizontal activity before and after a cocaine injection (20 mg/kg; 10 mL/kg) over a total of 60 min. (G) Horizontal activity before and after an amphetamine injection (5 mg/kg; 10 mL/kg) over 60 min shows reduced locomotion in the DAT::NrxnsKO compared to the control mice. For rotarod and locomotor activity experiments, 7–10 animals per group were used. For all analyses, the plots represent the mean ± SEM. Statistical analyses were carried out by two-way ANOVAs followed by Tukey’s multiple comparison tests or Sidak’s multiple comparisons test. The stars in panel D represent the level of significance of the post hoc tests (*p<0.05; **p<0.01).
Figure 1—figure supplement 1.
Figure 1—figure supplement 1.. Breeding scheme for generation of DAT::NrxnsKO; DAT::NrxnsWT, and DAT::NrxnsHET.
Homozygous Nrxn 123flox mice were initially crossed with homozygous DATIRES-CRE mouse line. Heterogygous mice for Nrxn 123flox and DATIRES-CRE mice were then crossed with homozygous DATIRES-CRE mice. Heterozygous Nrxn 123flox mice; homozygous DATIRES-CRE mice were finally crossed with heterogygous mice for Nrxn 123flox to obtain the final generation of DAT::NrxnsKO; DAT::NrxnsWT and DAT::NrxnsHET. All animals were genotyped prior to weaning at P21 for both, Nrxn flox and DAT Cre genes.
Figure 1—figure supplement 2.
Figure 1—figure supplement 2.. Lack of notable changes in the behavioral performance of DAT::NrxnsKO mice.
(A) Schematic representation of a mouse on a rotarod and the diagram of the rotarod testing protocol for speeds between 4 and 4 rpm over 2 min (speed 2). (B) Performance on the second accelerating rotarod task during nine sessions over 3 consecutive days. Latency to fall was quantified at rotation speeds from 4 to 40 rpm over 2 min. (C) Performance of DAT::NrxnsWT and KO littermate mice on the rotarod was evaluated comparing the last and first sessions for each mouse. No significant improvement in performance was detected, irrespective of genotype. (D) Quantification of the final speed over all sessions shows no difference between the DAT::NrxnsWT and KO littermate mice. (E) Summary graph of the time to turn in the pole test shows no genotype effect (WT = 7.10 ± 1.50 s and KO = 4.57 ± 0.75 s). (F) Summary graph showing that the time required to climb down the pole was significantly higher for the DAT::NrxnsKO mice; (unpaired t-test, p=0.034) (WT = 5.80 ± 0.53 s and KO = 8.14 ± 0.93 s). (G) Schematic representation of the sucrose preference testing protocol. (H) Quantification of sucrose preference in comparison to water consumption represented as a percentage. Initial 2 days: DAT::NrxnsKO CD1: 51.47±1.63% vs 48.52 ± 1.63% and CD2: 54.01 ± 3.17%, vs 45.99 ± 3.17%; DAT::NrxnsWT CD1: 50.58±1.47% vs 49.41 ± 1.47% and CD2: 54.73 ± 4.27%, vs 45.26 ± 4.27%. Results are presented as percentage of choice water/water. Following 3 test days: DAT::NrxnsKO TD1: 81.24±2.44% vs 18.75 ± 2.44%; TD2: 74.65 ± 1.39%, vs 25.34 ± 1.39% and TD3: 78.74 ± 1.37%, vs 21.25 ± 1.37%; DAT::NrxnsWT TD1: 80.52±1.74% vs 19.47 ± 1.74%; TD2: 76.21 ± 1.75%, vs 23.78 ± 1.75% and TD3: 78.58 ± 2.00%, vs 21.41 ± 2.00%. Results are presented as percentage of choice sucrose/water. For rotarod and locomotor activity experiments, 7–14 animals per group were used. For sucrose experiment, 7–8 mice per group were used. For the pole test experiment, 7–10 animals per group were used. For all analyses, the plots represent the mean ± SEM. Statistical analyses were carried out by two-way ANOVAs followed by Tukey’s multiple comparison tests or Student’s t-test (*p<0.05; ****p<0.0001).
Figure 2.
Figure 2.. Increased vesicular monoamine transporter (VMAT2) but decreased dopamine transporter (DAT) expression in dopamine (DA) axon terminals lacking neurexins (Nrxns).
(A and B) Immunohistochemistry characterization of ventral (A) and dorsal (B) striatal slices from 8-week-old DAT::NrxnsKO and DAT::NrxnsWT mice (60× confocal) using tyrosine hydroxylase (TH, red) and VMAT2 (green) antibodies. (C and D) Immunohistochemistry of ventral (C) and dorsal (D) striatal slices from DAT::NrxnsKO and DAT::NrxnsWT mice using TH (red) and DAT (green) antibodies. (E–J) Quantification of signal intensity and signal surface (% of WT) for TH, VMAT2, and DAT in the different striatal regions examined: ventral striatum (vSTR) and dorsal striatum (dSTR) (DAT::NrxnsKO = 14 hemispheres/7 mice; DAT::NrxnsWT = 12 hemispheres/6 mice). TH surface area: vSTR = 123.6 ± 18.99% and dSTR = 99.49 ± 7.73% of control. TH signal intensity: vSTR = 109.6 ± 7.36% and dSTR = 97.96 ± 5.98% of control. VMAT2 surface area: vSTR = 168.3 ± 28.27% and dSTR = 136.7 ± 13.85% of control. VMAT2 signal intensity: vSTR = 122.1 ± 10.48% and dSTR = 114.4 ± 6.25% of control. DAT surface area: vSTR = 59.00 ± 10.71% and dSTR1=83.70 ± 2.70% of control DAT signal intensity: vSTR = 74.37 ± 5.56% and dSTR = 84.42 ± 4.40% of control. Statistical analysis was carried out by unpaired t-test for each substructure. Surface and intensity for each signal were measured in striatal slice from bregma + 0.74 mm, with a total of seven different spots for each hemisphere from six DAT::NrxnsWT mice and seven DAT::NrxnsKO mice. Error bars represent ± SEM (*p<0.05).
Figure 3.
Figure 3.. Synaptic and non-synaptic ultrastructure of dopamine (DA) terminals is unchanged after the deletion of neurexins (Nrxns) in DA neurons.
(A–B) Electron micrographs showing DA neuron terminals without any postsynaptic density (PSD) domain (top images) or in apposition to a PSD domain in ventral striatal tissue from DAT::NrxnsWT and KO mice. The lower micrograph represents a magnified view of the regions identified by the doted lines in the middle images. The asterisk identifies a synapse and the black arrowheads delimitate the postsynaptic domain. (C) Schematic representation of a dopaminergic varicosity. (D) Bar graph representing the perimeter of the DA axonal varicosity from WT and KO mice (2353±81.83 nm and 2366±174.8 nm, respectively). (E and F) Bar graphs representing the size of the axonal varicosities, quantified as length (E) (897.3±38.06 nm and 902.7±38.06 nm, respectively) and width (F) (468.7±38.06 nm and 431.5±22.02 nm, respectively). (G) Bar graphs showing the surface area of DA neuron varicosities from WT and KO animals (323,537±45,861 nm2 and 317,887±40,227 nm2, respectively). (H) Bar graphs representing the PSD domain size from individual synapses (232.8±23.40 nm and 197.1±35.71 nm, respectively, for WT and KO mice). For all analyses, WT = 101 and KO = 189 axonal varicosities from four different mice for each genotype. For all analyses, plots represent the mean ± SEM. Statistical analyses were carried out by unpaired t-tests.
Figure 4.
Figure 4.. Impaired dopamine (DA) overflow in DAT::NrxnsKO mice.
(A) Representative traces of electrically evoked DA overflow detected by fast-scan cyclic voltammetry in the ventral striatum, measured in slices prepared from DAT::NrxnsWT and DAT::NrxnsKO mice. (B) Bar graphs showing the average peak DA levels (µM) detected in the ventral striatum (WT = 0.98 ± 0.04 µM and KO = 0.98 ± 0.06 µM). (C) Evaluation of DA overflow kinetics in the ventral striatum estimated by quantifying tau (WT = 0.35 ± 0.02 and KO = 0.42 ± 0.02). (D) Short-term paired-pulse induced plasticity of DA overflow in ventral striatal slices, estimated by calculating (P2-P1/P1) with an inter-pulse interval of 100 ms. The low ratio values reflect the strong paired-pulse depression seen at such release sites in acute brain slices. (E) Representative traces of electrically evoked DA overflows detected by fast-scan cyclic voltammetry in the dorsal striatum. (F) Bar graphs showing the average peak DA levels (µM) detected in the dorsal striatum (WT = 1.33 ± 0.05 µM and KO = 1.35 ± 0.07 µM). (G) Evaluation of DA overflow kinetics in the dorsal striatum, estimated by quantifying tau (WT = 0.36 ± 0.02 s and KO = 0.45 ± 0.03 s). (H) Short-term paired-pulse induced plasticity of DA overflow in dorsal striatal slices, estimated by calculating (P2-P1/P1) with an inter-pulse interval at 100 ms. The low ratio values reflect the strong paired-pulse depression seen at such release sites in acute brain slices. (I) Representative traces of electrically evoked DA overflow detected by fast-scan cyclic voltammetry in the ventral striatum, measured in slices prepared from DAT::NrxnsWT and DAT::NrxnsKO mice in the presence of the nicotinic receptor antagonist DHßE. (J) Bar graphs showing the average peak DA levels (µM) detected in the ventral striatum (WT = 0.47 ± 0.09 µM and KO = 0.24 ± 0.06 µM). (K) Evaluation of DA overflow kinetics in the ventral striatum estimated by quantifying tau (WT = 1.35 ± 0.17 s and KO = 1.63 ± 0.16 s). (L) Short-term paired-pulse induced plasticity of DA overflow in ventral striatal slices, estimated by calculating (P2-P1/P1) with an inter-pulse interval of 100 ms. The low ratio values reflect the strong paired-pulse depression seen at such release sites in acute brain slices. (M) Representative traces of electrically evoked DA overflow detected by fast-scan cyclic voltammetry in the dorsal striatum in the presence of the nicotinic receptor antagonist DHßE. (N) Bar graphs showing the average peak DA levels (µM) detected in the dorsal striatum (WT = 0.43 ± 0.05 µM and KO = 0.24 ± 0.03 µM). (O) Evaluation of DA overflow kinetics in the dorsal striatum, estimated by quantifying tau (WT = 1.37 ± 0.22 s and KO = 1.21 ± 0.24 s). (P) Short-term paired-pulse induced plasticity of DA overflow in dorsal striatal slices, estimated by calculating (P2-P1/P1) with an inter-pulse interval at 100 ms. The low ratio values reflect the strong paired-pulse depression seen at such release sites in acute brain slices. Data are presented as mean ± SEM. Statistical analyses were performed with Student’s t-tests (*p<0.05; **p<0.01).
Figure 4—figure supplement 1.
Figure 4—figure supplement 1.. Detection of activity-dependent dopamine (DA) overflow by fast-scan cyclic voltammetry (FSCV).
(A–D) Representative voltammograms of FSCV recordings performed in ventral striatal (vSTR) or dorsal striatal (dSTR) sections from DAT::NrxnsWT and DAT::NrxnsKO confirming the identity of the electroactive substance as DA. (E) Representative traces of electrically evoked DA levels detected by FSCV in the vSTR, measured in slices prepared from DAT::NrxnsWT and DAT::NrxnsKO mice. (F) Bar graphs showing the average peak DA levels (µM) detected in the vSTR (WT = 0.82 ± 0.05 µM and knock-out [KO] = 0.75 ± 0.06 µM). (G) Evaluation of DA overflow kinetics in the vSTR estimated by quantifying tau (WT = 0.6 ± 0.04 µM and KO = 0.91 ± 0.06 µM). (H) Representative traces of electrically evoked DA levels detected by FSCV in the dSTR. (I) Bar graphs showing the average of peak DA levels (µM) detected in the dSTR (WT = 1.07 ± 0.05 µM and KO = 1.05 ± 0.07 µM). (J) Evaluation of DA overflow kinetics in the dSTR, estimated by quantifying tau (WT = 0.67 ± 0.04 s and KO = 0.72 ± 0.04 s). (K–L) Representative traces of electrically evoked DA levels in the dSTR, measured in slices prepared from DAT::NrxnsWT mice with (red line) and without (black line) dihydro-β-erythroidine hydrobromide (DHβE) (10 µM). (M–P) Representative traces of electrically evoked DA levels detected by FSCV in the vSTR and dSTR after single (black line) or paired-pulse (gray line) stimulation, in the presence of DHβE. Data are presented as mean ± SEM. Statistical analyses were performed with Student’s t-test (*p<0.05; ** p<0.01; ***p<0.001).
Figure 4—figure supplement 2.
Figure 4—figure supplement 2.. No change in GABAB receptor modulation of dopamine (DA) release after conditional deletion of all neurexins.
(A) Summary graph of the rise time of electrically evoked DA overflow in the dorsal striatum shows no genotype effect. (B) Summary graph of the rise time of electrically evoked DA overflow in the ventral striatum shows no genotype effect. (C) Plot of relative peak DA overflow and its modulation by the GABAB agonist baclofen in the ventral striatum. No difference between WT KO mice was observed.
Figure 5.
Figure 5.. GABA release from dopamine (DA) neuron terminals in the ventral striatum is increased in DAT::NrxnsKO mice.
(A) Experimental timeline and schematic for performing electrophysiological measurements from DAT::NrxnsKO and WT mice that were injected with AAV-EF1a-ChR2-EYFP in the ventral tegmental area (VTA) and substantia nigra pars compacta (SNc). (B) Representative image of virus expression in the mesencephalon (injection site) and striatum (projection) 6–8 weeks after stereotaxic viral injection. (C) Representative traces of optically evoked inhibitory postsynaptic currents (IPSCs) in the ventral striatum for WT and KO mice; summary plot showing a significant increase in average amplitude of optically evoked IPSCs for KO mice. (D) Representative traces of optically evoked IPSCs in the ventral striatum, shaded area represents the window used to calculate decay time constant; summary plot showing a trend toward an increase in decay time constant for KO mice. (E) Representative traces of optically evoked IPSCs in the dorsal striatum for WT and KO mice; summary plot showing no change in average amplitude of optically evoked IPSCs. (F) Representative traces of optically evoked IPSCs in the dorsal striatum, shaded area represents the window used to calculate decay time constant; summary plot showing no changes in decay time constant. Data are presented as mean ± SEM. Statistical analyses were performed with Mann-Whitney tests (**p<0.01).
Figure 5—figure supplement 1.
Figure 5—figure supplement 1.. Quantification of green fluorescent protein (GFP) signal in the striatum after viral transduction of dopamine neurons.
(A) Summary graph of the GFP-positive area quantification normalized on tyrosine hydroxylase (TH) signal for the ventral striatum (vSTR) and the dorsal striatum (dSTR). (B) Summary graph of the GFP-positive area quantification normalized on dopamine transporter (DAT) signal for the vSTR and the dSTR. N=4–5 brains per group, mean ± SEM.
Figure 5—figure supplement 2.
Figure 5—figure supplement 2.. GABA currents evoked from dopamine (DA) terminals in the ventral striatum (vSTR) are blocked by inhibiting vesicular monoamine transporter (VMAT2).
(A) Time-course plot showing the peak amplitude response of optically evoked inhibitory postsynaptic current (oIPSCs) while applying 50 µM picrotoxin (PTX) to the recording solution (N=2); representative traces of oIPSCs at three timepoints of the recording (pre-drug, 10 min after PTX, and 15 min after PTX). (B) Time-course plot showing the peak amplitude response of oIPSCs while applying 1 µM of reserpine, a VMAT2 inhibitor, followed by 50 µM PTX to the recording solution; representative traces of oIPSCs at three timepoints of the recording (pre-drug, response in reserpine prior to PTX, and response to reserpine and PTX). (C–D) Summary graphs of oIPSC response delay (C) and rise time (D) recorded in ventral striatal medium spiny neurons (MSNs). (E–F) Summary graphs of oIPSC response delay (E) and rise time (F) in dorsal striatal MSNs.
Figure 6.
Figure 6.. Glutamate release from dopamine (DA) axons in the ventral and dorsal striatum is unchanged in DAT::NrxnsKO mice.
(A) Representative traces of optically evoked EPSCs in the ventral striatum for WT and KO mice; summary plot showing no differences in average peak amplitude for optically evoked EPSCs between WT and KO mice. (B) Representative traces of optically evoked EPSCs in the dorsal striatum for WT and KO mice; summary plot showing no differences in average peak amplitude for optically evoked EPSCs between WT and KO mice.
Figure 6—figure supplement 1.
Figure 6—figure supplement 1.. Glutamate-mediated synaptic currents evoked from dopamine (DA) terminals in the ventral striatum (vSTR) are blocked by the glutamate receptor antagonists AP5 and CNQX.
Time-course plot showing the effect of washing in AP5 and CNQX on optically evoked EPSCs (oEPSC); representative traces of oEPSCs pre-drug and 5 min after drug application.
Figure 7.
Figure 7.. GABA uptake by cultured dopamine (DA) neurons is unchanged after conditional deletion of all neurexins (Nrxns).
(A) Schematic representation of the experimental procedure for the GABA uptake assay in ventral tegmental area (VTA)-ventral striatum (vSTR) co-cultures or in substantia nigra pars compacta (SNc)-dorsal striatum (dSTR) co-cultures. (B–D) Immunocytochemistry of SNc DA neurons from DAT::NrxnsWT (B and C) and DAT::NrxnsKO mice (D) for tyrosine hydroxylase (TH, green) and gamma-aminobutyric acid (GABA, red). Experiments on VTA-vSTR co-cultures are not illustrated. (E) Summary graph representing the quantification of GABA immunoreactivity signal surface in TH-positive axons for VTA and SNc DA neurons from DAT::NrxnsWT and KO cultures. N=18–22 axonal fields from three different neuronal co-cultures. The number of observations represents the number of fields from TH-positive neurons examined. The star represents a significant overall genotype effect. For all analyses, plots represent the mean ± SEM. Statistical analyses were carried out by two-way ANOVAs followed by Tukey’s multiple comparison test (*p<0.05).
Figure 7—figure supplement 1.
Figure 7—figure supplement 1.. Gene expression profile in target cells of dopamine (DA) neurons after conditional deletion of Nrxn123.
(A and B) Relative changes of mRNA levels measured by reverse transcription quantitative polymerase chain reaction (RT-qPCR), from ventral and dorsal striatum tissue: gephyrin (Gphn), collybistin (Arhgef 9), GABA-A receptor (Gabra1), neuroligins 1, 2, and 3 (Nlgn1, -2, and -3), latrophilins 1, 2, and 3 (Lphn1, -2, and -3), LRRTMs 1, 2, 3, 4 (LRRTM1, -2, -3, and -4), D1R (DRD1) and D2R (DRD2) in brain tissue from P80 DAT::NrxnsWT and DAT::NrxnsKO mice.
Figure 8.
Figure 8.. Hypothesized mechanisms of GABA co-transmission increase in DAT::NrxnsKO mice.
(A) Illustration of the first hypothesis showing an increase of vesicular monoamine transporter (VMAT2) expression in DAT::NrxnsKO neurons, allowing increased vesicular GABA packaging. (B) Illustration of the second hypothesis showing an increase of GABA uptake through GAT1/4 in DAT::NrxnsKO neurons. (C) Illustration of the third hypothesis showing a possible loss of interaction between the presynaptic Nrxns and postsynaptic GABAA receptors.

Update of

  • doi: 10.1101/2021.10.17.464666

References

    1. Aoto J, Földy C, Ilcus SMC, Tabuchi K, Südhof TC. Distinct circuit-dependent functions of presynaptic neurexin-3 at GABAergic and glutamatergic synapses. Nature Neuroscience. 2015;18:997–1007. doi: 10.1038/nn.4037. - DOI - PMC - PubMed
    1. Banerjee A, Lee J, Nemcova P, Liu C, Kaeser PS. Synaptotagmin-1 is the Ca2+ sensor for fast striatal dopamine release. eLife. 2020;9:e58359. doi: 10.7554/eLife.58359. - DOI - PMC - PubMed
    1. Banerjee A, Imig C, Balakrishnan K, Kershberg L, Lipstein N, Uronen RL, Wang J, Cai X, Benseler F, Rhee JS, Cooper BH, Liu C, Wojcik SM, Brose N, Kaeser PS. Molecular and functional architecture of striatal dopamine release sites. Neuron. 2022;110:248–265. doi: 10.1016/j.neuron.2021.10.028. - DOI - PMC - PubMed
    1. Bérubé-Carrière N, Riad M, Dal Bo G, Lévesque D, Trudeau LE, Descarries L. The dual dopamine-glutamate phenotype of growing mesencephalic neurons regresses in mature rat brain. The Journal of Comparative Neurology. 2009;517:873–891. doi: 10.1002/cne.22194. - DOI - PubMed
    1. Bérubé-Carrière N, Guay G, Fortin GM, Kullander K, Olson L, Wallén-Mackenzie Å, Trudeau LE, Descarries L. Ultrastructural characterization of the mesostriatal dopamine innervation in mice, including two mouse lines of conditional VGLUT2 knockout in dopamine neurons. The European Journal of Neuroscience. 2012;35:527–538. doi: 10.1111/j.1460-9568.2012.07992.x. - DOI - PubMed

Publication types

Substances

Grants and funding