NRF1-mediated mitochondrial biogenesis antagonizes innate antiviral immunity
- PMID: 37409632
- PMCID: PMC10425878
- DOI: 10.15252/embj.2022113258
NRF1-mediated mitochondrial biogenesis antagonizes innate antiviral immunity
Abstract
Mitochondrial biogenesis is the process of generating new mitochondria to maintain cellular homeostasis. Here, we report that viruses exploit mitochondrial biogenesis to antagonize innate antiviral immunity. We found that nuclear respiratory factor-1 (NRF1), a vital transcriptional factor involved in nuclear-mitochondrial interactions, is essential for RNA (VSV) or DNA (HSV-1) virus-induced mitochondrial biogenesis. NRF1 deficiency resulted in enhanced innate immunity, a diminished viral load, and morbidity in mice. Mechanistically, the inhibition of NRF1-mediated mitochondrial biogenesis aggravated virus-induced mitochondrial damage, promoted the release of mitochondrial DNA (mtDNA), increased the production of mitochondrial reactive oxygen species (mtROS), and activated the innate immune response. Notably, virus-activated kinase TBK1 phosphorylated NRF1 at Ser318 and thereby triggered the inactivation of the NRF1-TFAM axis during HSV-1 infection. A knock-in (KI) strategy that mimicked TBK1-NRF1 signaling revealed that interrupting the TBK1-NRF1 connection ablated mtDNA release and thereby attenuated the HSV-1-induced innate antiviral response. Our study reveals a previously unidentified antiviral mechanism that utilizes a NRF1-mediated negative feedback loop to modulate mitochondrial biogenesis and antagonize innate immune response.
Keywords: NRF1; TBK1; innate immunity; mitochondrial biogenesis.
© 2023 The Authors.
Conflict of interest statement
The authors declare that they have no conflict of interest.
Figures
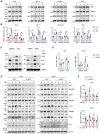
- A
Immunoblot analysis of NRF1, NRF2‐α, and PGC1‐α in mouse PMs infected with VSV or HSV‐1 or treated with poly(I:C) or ISD for the indicated time points. ACTIN was used as a loading control. Ratios of target proteins versus loading control normalized to the 0‐h time point of each condition.
- B
qPCR analysis of Nrf1, Gabpa, and Ppargc1a mRNA in mouse PMs infected with VSV or HSV‐1 or treated with poly(I:C) or ISD for the indicated time points (n = 3 biological replicates per group).
- C
Immunoblot analysis of NRF1 expression in mouse PMs transfected with p65‐specific siRNA (si‐p65) or control siRNA (si‐NC) for 48 h, followed by infection with VSV or HSV‐1 for 8 h. GAPDH was used as a loading control. Ratios of target proteins versus loading control normalized to the untreated sample of each condition.
- D
qPCR analysis of Nrf1 mRNA in mouse PMs transfected with p65‐specific siRNA (si‐p65) or control siRNA (si‐NC) for 48 h, followed by infection with VSV or HSV‐1 for 8 h (n = 3 biological replicates per group).
- E
Immunoblot analysis of mitochondrial proteins and autophagy marker LC3 in mouse PMs transfected with NRF1‐specific siRNA (si‐NRF1) or control siRNA (si‐NC) for 48 h, followed by infection with VSV or HSV‐1 for the indicated time points. ACTIN was used as a loading control. Ratios of target proteins versus loading control normalized to the untreated sample of each condition.
- F
Mitochondrial mass determined by mtDNA/nuclear DNA (nDNA) ratio in mouse PMs transfected with NRF1‐specific siRNA (si‐NRF1) or control siRNA (si‐NC) for 48 h, followed by infection with VSV or HSV‐1 for the indicated time points (n = 3 biological replicates per group).
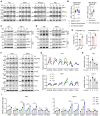
- A
Immunoblot analysis of NRF1, NRF2‐α, and PGC1‐α in human THP‐1 cells infected with VSV or HSV‐1 or treated with poly(I:C) or ISD for the indicated time points. ACTIN was used as a loading control. Ratios of target proteins versus loading control normalized to the 0‐h time point of each condition.
- B
The mRNA value of NRF1 was analyzed in the GEO profiles from the blood of patients with acute Dengue virus (DENV) infection and during convalescence (GDS5093/204652_PM_s_at) and from the liver explant of hepatitis B virus (HBV)‐associated acute liver failure (ALF) patients (GDS4387/204651_at). Healthy control, n = 9; Dengue‐infected patients, n = 18; Convalescent patients, n = 19; Normal liver, n = 10; HBV‐infected liver, n = 17.
- C, D
Immunoblot analysis of NRF1 dimerization with native PAGE in mouse PMs (C) and THP‐1 cells (D) upon VSV or HSV‐1 infection for the indicated time points. ACTIN was used as a loading control. Ratios of dimerized NRF1 versus loading control normalized to the 0‐h time point of each condition.
- E
Luciferase activity of TFAM/NRF1‐Luc and TFB1M/NRF1‐Luc was measured in HEK293T cells with or without infection of VSV for 8 h (n = 3 biological replicates per group).
- F, G
Immunoblot analysis of mitochondrial proteins and autophagy marker (LC3) in mouse PMs infected with VSV or HSV‐1 for the indicated time points (F). ACTIN was used as a loading control. Ratios of target proteins versus loading control normalized to the 0‐h time point of each condition. Relative mitochondrial protein levels were further presented with line charts (G).
- H
Mitochondrial mass determined by mtDNA/nuclear DNA (nDNA) ratio in wild‐type mouse PMs infected with VSV or HSV‐1 for the indicated time points (n = 3 biological replicates per group).
- I
qPCR analysis of mitochondrial biogenic genes expression in mouse PMs infected with VSV or HSV‐1 for the indicated time points (n = 3 biological replicates per group).
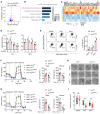
- A–C
RNA‐sequencing (RNA‐seq) analysis of gene expression in wild‐type and NRF1‐KO mouse PMs (n = 3 biological replicates per group) infected with VSV for 8 h. (A) Volcano plot of the differentially expressed genes (DEGs, log2FC > 0.5, P adj < 0.05). Red and blue dots represent the significantly upregulated and downregulated genes in NRF1‐KO mouse PMs, respectively. (B) Gene ontology (GO) enrichment analysis of downregulated DEGs in NRF1‐KO mouse PMs. Results showing top 5 significantly enriched GO terms in cellular component (CC). (C) Pheatmap analysis showing downregulated DEGs encoding mitochondrial inner membrane proteins. TPM, transcripts per kilobase of exon model per million mapped reads.
- D
Mitochondrial mass determined by mtDNA/nuclear DNA (nDNA) ratio in wild‐type and NRF1‐KO mouse PMs infected with VSV or HSV‐1 for the indicated time points (n = 3 biological replicates per group).
- E
Flow cytometric analysis of mitochondria status in wild‐type and NRF1‐KO mouse PMs infected with VSV or HSV‐1 for 8 h. Gates represent cells with damaged mitochondria. Quantification of cells with damaged mitochondria (n = 3 biological replicates per group).
- F, G
The representative curves of oxygen consumption rate (OCR) in wild‐type and NRF1‐KO mouse PMs infected with VSV (F) or HSV‐1 (G) for 8 h (n = 5 biological replicates per group). Oligomycin: 1 μM, FCCP: 4 μM, Rotenone: 1 μM. Quantification of basal and maximal OCR.
- H, I
Electron micrographs of mitochondria in wild‐type and NRF1‐KO mouse PMs infected with VSV or HSV‐1 for 8 h. Scale bars, 500 nm (H). (I) Quantitative analysis of mitochondrial cristae (the ratio of cristae number to mitochondrial area) in (H) (20–30 mitochondria per group, biological replicates).

- A
qPCR analysis of the expression mitochondrial genes in wild‐type and NRF1‐KO mouse PMs (n = 3 biological replicates per group).
- B
Immunoblot analysis of mitochondrial proteins in wild‐type and NRF1‐KO mouse PMs. GAPDH was used as a loading control (left). Ratios of target proteins versus loading control normalized to the wild‐type sample of each group and were further presented with histograms (right) (n = 3 biological replicates per group).
- C
Mitochondrial mass determined by mtDNA/nuclear DNA (nDNA) ratio in wild‐type and NRF1‐KO mouse PMs (n = 5 biological replicates per group).
- D
qPCR analysis of Tfam mRNA level in wild‐type and NRF1‐KO mouse PMs infected with VSV or HSV‐1 for 8 h (n = 3 biological replicates per group).
- E, F
Immunoblot analysis of mitochondrial proteins and autophagy marker (LC3) in NRF1‐KO mouse PMs infected with VSV or HSV‐1 for the indicated time points (E). ACTIN was used as a loading control. Ratios of target proteins versus loading control normalized to the 0‐h time point of each condition. Relative mitochondrial protein levels were further presented with line charts (F).
- G, H
Confocal microscopy analysis of endogenous LC3 colocalization with HSP60 (Mito) in wild‐type and NRF1‐KO mouse PMs after VSV or HSV‐1 infection for 12 h, Scale bars, 5 μm (G). (H) The number of LC3 puncta colocalizing with mitochondria per cell was quantitated by ImageJ (n = 30 cells per group).
- I, J
Confocal microscopy analysis of LysoTracker (Lyso) colocalization with HSP60 (Mito) in wild‐type and NRF1‐KO mouse PMs after VSV or HSV‐1 infection for 12 h, Scale bars, 5 μm (I). (J) Quantification of Pearson's colocalization coefficient between Mito and Lyso as shown in (I) (n = 10 cells examined in 1 of 3 independent experiments).

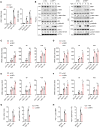
- A
Luciferase activity of IFN‐β, NF‐κB, and ISRE promoter reporter in HEK293T cells transfected with empty vector or plasmids encoding incremental NRF1‐Myc for 24 h followed by infection with VSV for 8 h (n = 4 biological replicates per group).
- B, C
Immunoblot analysis of phosphorylated and total TBK1, p65, and STAT1 in wild‐type and NRF1‐KO mouse PMs infected with VSV or HSV‐1 (B) or stimulated with poly(I:C) or ISD (C) for the indicated time points. GAPDH was used as a loading control. Ratios of phosphorylated proteins versus total proteins normalized to the 0‐ or 4‐h time point of each wild‐type sample.
- D
qPCR analysis of Ifnb1, Il6, Tnfa and Cxcl10 mRNA in wild‐type and NRF1‐KO mouse PMs infected with VSV or HSV‐1 or stimulated with poly(I:C) or ISD for the indicated time points (n = 3 biological replicates per group).
- E
ELISA quantification of IFN‐β, IL6, and TNF‐α secretion in wild‐type and NRF1‐KO mouse PMs treated as in (D) (n = 3 biological replicates per group).
- F
Plaque assay of VSV and HSV‐1 titers in wild‐type and NRF1‐KO mouse PMs at 8 h after infection with those viruses (n = 3 biological replicates per group).
- A
qPCR analysis of IFNB1 mRNA in HEK293T cells transfected with empty vector or plasmids encoding NRF1‐Myc for 24 h followed by infection with VSV or stimulation with poly(I:C) for the indicated time points (n = 3 biological replicates per group).
- B
Immunoblot analysis of phosphorylated and total TBK1, p65, and STAT1 in mouse PMs transfected with NRF1‐specific siRNA (si‐NRF1) or control siRNA (si‐NC) for 48 h, followed by stimulation with poly(I:C) or ISD for the indicated time points. ACTIN was used as a loading control. Ratios of phosphorylated proteins versus total proteins normalized to the 0‐ or 4‐h time point of each wild‐type sample.
- C–F
qPCR analysis of Ifnb1, Il6, and Tnfa mRNA in mouse PMs transfected with NRF1‐specific siRNA (si‐NRF1) or control siRNA (si‐NC) for 48 h and then infected with VSV (C) or HSV‐1 (E) or stimulated with poly(I:C) (D) or ISD (F) for the indicated time points (n = 3 biological replicates per group).
- G
qPCR analysis of VSV mRNA and plaque assay of VSV titers in mouse PMs transfected with NRF1‐specific siRNA (si‐NRF1) or control siRNA (si‐NC) for 48 h followed by infection with VSV for 12 h (n = 3 biological replicates per group).
- H
qPCR analysis of HSV‐1 UL30 mRNA and plaque assay of HSV‐1 titers in mouse PMs transfected with NRF1‐specific siRNA (si‐NRF1) or control siRNA (si‐NC) for 48 h followed by infection with HSV‐1 for 8 h (n = 3 biological replicates per group).

- A
8‐week‐old Nrf1 F/F and Nrf1 MyeKO mice (n = 3 for PBS treatment and n = 6 for virus treatment) were intravenously infected with VSV (4 × 10⁷ PFU/mouse) or HSV‐1 (1 × 10⁷ PFU/mouse). After 24 h, ELISA quantification of IFN‐β, IL6, and TNF‐α in sera.
- B
qPCR analysis of Ifnb1, Il6, and Tnfa mRNA in the lung of Nrf1 F/F and Nrf1 MyeKO mice infected with VSV as in A (n = 6 per group).
- C
qPCR analysis of VSV mRNA and plaque assay of VSV titers in the lungs of Nrf1 F/F and Nrf1 MyeKO mice infected with VSV as in A (n = 6 per group).
- D
Hematoxylin–eosin staining of lung sections from mice treated with PBS or VSV as in (A). Scale bar, 100 μm.
- E
qPCR analysis of Ifnb1, Il6, and Tnfa mRNA in the brains of Nrf1 F/F and Nrf1 MyeKO mice infected with HSV‐1 as in (A) (n = 6 per group).
- F
qPCR analysis of HSV‐1 UL30 mRNA and plaque assay of HSV‐1 titers in the brain of Nrf1 F/F and Nrf1 MyeKO mice infected with HSV‐1 as in (A) (n = 6 per group).
- G
Survival of Nrf1 F/F and Nrf1 MyeKO mice (n = 10 per group) at various times after intraperitoneal (i.p.) infection with HSV‐1 (2 × 10⁷ PFU per mouse).
- A
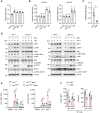
mtROS levels measured by MitoSOX staining and flow cytometry in mouse PMs infected with VSV or HSV‐1 or stimulated with poly(I:C) or ISD for 12 h (n = 3 biological replicates per group).
- B
DNA was isolated from digitonin extracts of wild‐type mouse PMs infected with VSV or HSV‐1 or stimulated with poly(I:C) or ISD for 4 h. Cytosolic translocation of mtDNA was quantified via qPCR using the indicated primer sets. 18S rRNA served as a control (n = 3 biological replicates per group).
- C
qPCR analysis of mtDNA copy number in mouse PMs cultured with or without ethidium bromide (EtBr, 450 ng/ml) for 72 h.
- D
Immunoblot analysis of the indicated proteins in wild‐type and NRF1‐KO mouse PMs pretreated with or without EtBr (450 ng/ml, 72 h), followed by VSV or HSV‐1 infection for 8 h. ACTIN was used as a loading control. Ratios of phosphorylated proteins versus total proteins normalized to the 0‐ or 8‐h time point of each wild‐type sample.
- E
qPCR analysis of Ifnb1 and Il6 mRNA in wild‐type and NRF1‐KO mouse PMs pretreated with or without MitoQ (100 nM, 2 h), followed by VSV or HSV‐1 infection for 8 h (n = 3 biological replicates per group).
- F
ELISA quantification of IFN‐β (left) and IL6 (right) from wild‐type mice pretreated with or without MitoQ (5 mg/kg body weight, i.p. injection) for 1 h and then infected i.p. with VSV (5 × 10⁸ PFU/mouse) or HSV‐1 (1 × 10⁷ PFU/mouse) for 24 h (n = 5 per group).

- A
mtROS levels measured by MitoSOX staining and flow cytometry in wild‐type and NRF1‐KO mouse PMs infected with VSV (left) or HSV‐1 (right) for the indicated time points. MFI, mean fluorescence intensity (n = 3 biological replicates per group).
- B
DNA was isolated from digitonin extracts of wild‐type and NRF1‐KO mouse PMs infected with VSV (left) or HSV‐1 (right) for the indicated time points. Cytosolic translocation of mtDNA was quantified via qPCR using the indicated primer sets. 18S rRNA served as a control (n = 3 biological replicates per group).
- C, D
Wild‐type and NRF1‐KO mouse PMs infected with VSV (8 h) or HSV‐1 (4 h) were imaged by confocal microscope after staining with anti‐DNA (DNA) and anti‐Prohibitin (Mito) antibodies. Scale bars, 5 μm (C). (D) The number of cytosolic mtDNA puncta per cell was quantitated by ImageJ (n = 30 cells per group).
- E
ELISA quantification of IFN‐β (left) and IL6 (right) in wild‐type and NRF1‐KO mouse PMs pretreated with or without EtBr (450 ng/ml, 72 h), followed by infection with VSV or HSV‐1 for 8 h (n = 3 biological replicates per group).
- F
ELISA quantification of IFN‐β (left) and IL6 (right) in wild‐type and NRF1‐KO mouse PMs pretreated with or without MitoQ (100 nM, 2 h), followed by infection with VSV or HSV‐1 for 8 h (n = 3 biological replicates per group).
- G
ELISA quantification of IFN‐β (left) and IL6 (right) from Nrf1 F/F and Nrf1 MyeKO mice pretreated with MitoQ (5 mg/kg body weight, i.p. injection) for 1 h and then infected i.p. with PBS, VSV (5 × 10⁸ PFU/mouse) or HSV‐1 (1 × 10⁷ PFU/mouse) for 24 h (n = 3 for PBS treatment and n = 6 for virus treatment).
- H
qPCR analysis of Ifnb1 and Il6 mRNA in the lungs of Nrf1 F/F and Nrf1 MyeKO mice pretreated with MitoQ as in (G) and 1 h later infected i.p. with VSV (5 × 10⁸ PFU/mouse) for 24 h (n = 6 per group).
- I
qPCR analysis of Ifnb1 and Il6 mRNA in the brains of Nrf1 F/F and Nrf1 MyeKO mice pretreated with MitoQ as in (G) and 1 h later infected i.p. with HSV‐1 (1 × 10⁷ PFU/mouse) for 24 h (n = 6 per group).

- A
Immunoblot analysis and Phos‐tag SDS–PAGE analysis of mouse PMs infected with VSV or HSV‐1 for the indicated time points.
- B
Immunoblot analysis of whole‐cell lysates from HEK293T cells transfected to express Flag‐TBK1 WT or Flag‐TBK1 kinase‐dead mutant (KD).
- C
Interaction between TBK1 and NRF1 in HEK293T cells was detected by co‐immunoprecipitation of differentially tagged proteins.
- D
The endogenous complex of TBK1 and NRF1 in iBMDM cells was revealed by co‐immunoprecipitation using anti‐TBK1 antibody and visualized by using anti‐NRF1 antibody.
- E
HEK293T cells were transfected to express Flag‐TBK1 WT or Flag‐TBK1 kinase‐dead mutant (KD) for 24 h and harvested. The immunoprecipitated Flag‐TBK1 WT or Flag‐TBK1 KD was incubated with purified His‐NRF1 in the presence of unlabeled ATP and resolved by SDS–PAGE, followed by immunoblot analysis with antibody to phospho‐Ser/Thr, anti‐NRF1 or anti‐Flag.
- F
HEK293T cells were transfected to express NRF1‐Myc WT or NRF1‐Myc S318A with Flag‐TBK1 WT or Flag‐TBK1 kinase‐dead mutant (KD) for 24 h and harvested. The cell lysates were immunoprecipitated with anti‐Myc antibody, followed by immunoblot analysis with antibody to NRF1 phosphorylated at Ser318, anti‐Myc, or anti‐Flag.
- G
Endogenous phospho‐NRF1 S318 signal was detected in wild‐type and NRF1 S318A mouse PMs after the infection with different viruses for 8 h. The red arrows indicate phosphorylated signals for NRF1.
- H
Heatmap showing the relative expression of mitochondrial genes in wild‐type and NRF1 S318A mouse PMs at steady state and 8 h after infection with HSV‐1. Expression signals are depicted using pseudocoloring, in which expression for each gene is shown as high (red) or low (blue) (n = 3 biological replicates per group).
- I
qPCR analysis of Ifnb1 and Il6 mRNA in wild‐type and NRF1 S318A mouse PMs infected with VSV or HSV‐1 for 8 h (n = 3 biological replicates per group).
- J
ELISA quantification of IFN‐β and IL6 secretion in wild‐type and NRF1 S318A mouse PMs treated as in (I) (n = 3 biological replicates per group).
- K
8‐week‐old wild‐type and NRF1 S318A mice (n = 3 for PBS treatment and n = 6 for HSV‐1 treatment) were intravenously infected with HSV‐1 (1 × 10⁷ PFU/mouse). After 24 h, ELISA quantification of IFN‐β, IL6, and TNF‐α in sera.
- L
Survival of wild‐type and NRF1 S318A mice (n = 10 per group) at various times after intraperitoneal infection with HSV‐1 (2 × 10⁷ PFU per mouse).

- A
Immunoblot analysis of whole‐cell lysates from HEK293T cells transfected to express NRF1‐Myc with Flag‐TBK1 WT or Flag‐TBK1 kinase‐dead mutant (KD).
- B
HEK293T cells were transfected to express NRF1‐Myc with Flag‐TBK1 WT or Flag‐TBK1 kinase‐dead mutant (KD) for 24 h. Twenty microgram of the samples was then treated with 1 unit of calf‐intestinal alkaline phosphatase (CIP) in the presence or absence of the phosphatase inhibitor Na3VO4 (50 mM final concentration) at 37°C for 1 h. The samples were subjected to SDS–PAGE, followed by immunoblot analysis with the indicated antibodies.
- C
HEK293T cells were transfected to express NRF1‐Myc with Flag‐TBK1 WT or Flag‐TBK1 kinase‐dead mutant (KD) for 24 h and harvested. The cell lysates were immunoprecipitated with anti‐Myc antibody, followed by immunoblot analysis with antibody to phospho‐Ser or phospho‐Thr, anti‐Myc or anti‐Flag.
- D
HEK293T cells were transfected to express full‐length or NRF1 truncations with Flag‐TBK1 WT or Flag‐TBK1 kinase‐dead mutant (KD) for 24 h and then immunoblotted with the indicated antibodies.
- E, F
Immunoblot analysis of HEK293T cells transfected with Flag‐TBK1 WT and NRF1‐Myc derivatives carrying the indicated additional phosphorylation site mutations. The red arrows indicate the shifting band of NRF1 induced by TBK1.
- G
HEK293T cells were transfected to express Flag‐TBK1 WT for 24 h and harvested. The immunoprecipitated Flag‐TBK1 WT was incubated with purified His‐NRF1 WT or His‐NRF1 2SA in the presence of unlabeled ATP and resolved by SDS–PAGE, followed by immunoblot analysis with anti‐NRF1 or anti‐Flag.
- H
Sequence alignment of TBK1 mediated NRF1 phosphorylation sites in NRF1 orthologues of multiple species.
- I
HEK293T cells were transfected to express Flag‐TBK1 WT or Flag‐TBK1 kinase‐dead mutant (KD) for 24 h and harvested. The immunoprecipitated Flag‐TBK1 WT or Flag‐TBK1 KD was incubated with purified His‐NRF1 WT or His‐NRF1 S318A in the presence of unlabeled ATP and resolved by SDS–PAGE, followed by immunoblot analysis with antibody to NRF1 phosphorylated at Ser318, anti‐NRF1 or anti‐Flag.

References
-
- Attardi G, Schatz G (1988) Biogenesis of mitochondria. Annu Rev Cell Biol 4: 289–333 - PubMed
-
- Chen S, Liu S, Wang J, Wu Q, Wang A, Guan H, Zhang Q, Zhang D, Wang X, Song H et al (2020) TBK1‐mediated DRP1 targeting confers nucleic acid sensing to reprogram mitochondrial dynamics and physiology. Mol Cell 80: 810–827.e7 - PubMed
Publication types
MeSH terms
Substances
LinkOut - more resources
Full Text Sources
Molecular Biology Databases
Miscellaneous

