. 2023 Aug 31;14(4):e0108623.
doi: 10.1128/mbio.01086-23. Epub 2023 Jul 6.

S2P intramembrane protease RseP degrades small membrane proteins and suppresses the cytotoxicity of intrinsic toxin HokB

Affiliations

S2P intramembrane protease RseP degrades small membrane proteins and suppresses the cytotoxicity of intrinsic toxin HokB

Tatsuhiko Yokoyama et al. mBio. .

Abstract

The site2-protease (S2P) family of intramembrane proteases (IMPs) is conserved in all kingdoms of life and cleaves transmembrane proteins within the membrane to regulate and maintain various cellular activities. RseP, an Escherichia coli S2P peptidase, is involved in the regulation of gene expression through the regulated cleavage of the two target membrane proteins (RseA and FecR) and in membrane quality control through the proteolytic elimination of remnant signal peptides. RseP is expected to have additional substrates and to be involved in other cellular processes. Recent studies have shown that cells express small membrane proteins (SMPs; single-spanning membrane proteins of approximately 50-100 amino acid residues) with crucial cellular functions. However, little is known about their metabolism, which affects their functions. This study investigated the possible RseP-catalyzed cleavage of E. coli SMPs based on the apparent similarity of the sizes and structures of SMPs to those of remnant signal peptides. We screened SMPs cleaved by RseP in vivo and in vitro and identified 14 SMPs, including HokB, an endogenous toxin that induces persister formation, as potential substrates. We demonstrated that RseP suppresses the cytotoxicity and biological functions of HokB. The identification of several SMPs as novel potential substrates of RseP provides a clue to a comprehensive understanding of the cellular roles of RseP and other S2P peptidases and highlights a novel aspect of the regulation of SMPs. IMPORTANCE Membrane proteins play an important role in cell activity and survival. Thus, understanding their dynamics, including proteolytic degradation, is crucial. E. coli RseP, an S2P family intramembrane protease, cleaves membrane proteins to regulate gene expression in response to environmental changes and to maintain membrane quality. To identify novel substrates of RseP, we screened small membrane proteins (SMPs), a group of proteins that have recently been shown to have diverse cellular functions, and identified 14 potential substrates. We also showed that RseP suppresses the cytotoxicity of the intrinsic toxin, HokB, an SMP that has been reported to induce persister cell formation, by degrading it. These findings provide new insights into the cellular roles of S2P peptidases and the functional regulation of SMPs.

Keywords: extracytoplasmic stress response; membrane protease; proteostasis; regulated intramembrane proteolysis; zinc metallopeptidase.


Conflict of interest statement

The authors declare no conflict of interest.

Figures

Fig 1
Fig 1
Schematic representation of the model substrates used in this study. Regions derived from RseA, SMP, and LY1 (the first TM of LacY) are shown in blue, green, and red, respectively. The HA-MBP, 3xFLAG, HA, and HA-Met6 tags are shown in orange. Peri, IM, and Cyto indicate periplasm, inner membrane, and cytoplasm, respectively.
Fig 2
Fig 2
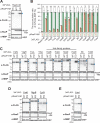
In vivo cleavage of N-terminal HA-MBP-tagged SMP by overproduced RseP. (A–E) RseP cleavability of HA-MBP-tagged model substrates. KA306 (ΔrseA ΔrseP ΔclpP) cells harboring pSTD689 (vector, vec), pYH9 [RseP-HM (His6-Myc), WT (wild-type)], or pYH13 [RseP(E23Q)-HM, EQ (E23Q)] were further transformed with a plasmid encoding an HA-MBP-RseA(LY1)148 (pYH20) or HA-MBP-SMP model substrate, as indicated. Deletion of the clpP gene, which encodes the protease subunit of the Clp proteases, stabilizes the RseP cleavage product of RseA. Cells were grown in L medium containing 1 mM isopropyl-β-D-thiogalactopyranoside (IPTG) at 30°C until the late log phase to induce both RseP-HM and HA-MBP-tagged model substrates. Acid-precipitated total proteins were analyzed by 7.5% Laemmli SDS-PAGE and anti-HA (α-HA) immunoblotting and by 12.5% Laemmli SDS-PAGE and anti-RseP (α-RseP), or anti-SecB (α-SecB) immunoblotting. SecB served as a loading control. Blue and red triangles indicate the full-length and the RseP-cleaved forms of the model proteins, respectively. A representative result from at least two biological replicates is shown. (A) RseP cleavability of control model substrates. (B) Cleavage efficiency of HA-MBP-tagged model substrates. The cleavage efficiencies were calculated as the ratio of the RseP-cleaved form to the total (full length plus cleaved) HA-MBP-tagged model substrates. Means of the data from at least two biologically independent experiments are plotted with SD and individual data. HA-MBP-SMP model substrates for which accurate quantification was not possible due to the very small difference in mobility between the full-length and RseP-cleaved bands were labeled as ND. A one-tailed Student t-test was used to compare the values between the groups. *P  <  0.05, **P  <  0.01, and ***P  <  0.001. (C) Summary of the screening of SMPs with the N-terminal HA-MBP tag for their cleavage by RseP in vivo. Out of 37 SMPs screened, 12 were found to be cleaved by RseP (see also Table 1 and Fig. S1 and S6). (D and E) RseP cleavage of the HA-MBP-SMP model substrates. The HA-MBP-SMPs shown in D generated a single RseP-dependent cleavage product, while those shown in E generated additional fragments (black triangles) that was produced RseP independently. The contrast of each immunoblotting image was adjusted to clearly show the cleavage product. A representative result from at least two biological replicates is shown. SD, standard deviation.
Fig 3
Fig 3
In vivo cleavage of SMPs with an N-terminal HA-MBP tag by chromosomally encoded RseP. (A) Cleavability of control model substrates by chromosomal-encoded RseP. KA304 (ΔclpP ΔrseA rseP+) or KA306 (ΔclpP ΔrseA ΔrseP) cells harboring pYH20 (HA-MBP-RseA(LY1)148, RseA(LY1)148), pEB82 (HA-MBP-YqfG, YqfG), or pEB74(HA-MBP-YoaJ, YoaJ) were grown and the proteins were analyzed, as shown in Fig. 2A. (B and C) Cleavage of the HA-MBP-SMP model substrates by chromosomally encoded RseP was examined as in A. The HA-MBP-SMPs shown in B generated an RseP-dependent cleavage product, whereas those shown in C did not. Blue, red, and black triangles indicate the full-length, RseP-cleaved, and RseP-independent-cleaved forms of the model proteins, respectively. The contrast of each immunoblotting image was adjusted to clearly show the cleavage products. A representative result from two biological replicates is shown.
Fig 4
Fig 4
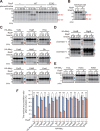
In vivo cleavage of SMPs with an N-terminal 3xFLAG-tag. RseP cleavability of 3xFLAG-RseA148 and 3xFLAG-SMP model substrates. KA306 (ΔrseA ΔrseP ΔclpP) cells harboring pSTD689 (vector, vec), pYH9 (RseP-HM, WT), or pYH13 (RseP(E23Q)-HM, EQ) were further transformed with a plasmid encoding 3xFLAG-RseA148 (pYK347) or 3xFLAG-SMP. RseP-dependent proteolysis was examined as shown in Fig. 2A except that the proteins were analyzed by 15% Bis-Tris SDS-PAGE and anti-FLAG (α-FLAG) or anti-MBP (α-MBP) immunoblotting. MBP served as a loading control. (A) RseP-dependent decrease in the accumulation level of 3xFLAG-RseA148. Blue triangle indicates the full-length form of 3xFLAG-RseA148. A representative result from two biological replicates is shown. (B) The ratio of the accumulation level of 3xFLAG-SMPs in cells expressing wild-type RseP-HM to that in cells expressing RseP(E23Q)-HM. Accumulation levels of the 3xFLAG-SMPs were normalized to the MBP signal, with the average accumulation level of 3xFLAG-SMPs in cells expressing RseP(E23Q)-HM set to 100%. Means of at least two biologically independent experiments are shown with SD and individual data. A one-tailed Student t-test was used to compare the values between the groups. *P  <  0.05, **P  <  0.01, ***P  <  0.001, and ns, not significant. (C) Ten 3xFLAG-SMP model substrates that exhibited significant RseP-dependent decrease in their accumulation level (P < 0.05) and (D) three 3xFLAG-SMP model substrates that exhibited almost no RseP-dependent decrease in their accumulation level. (E) RseP-dependent decrease in the accumulation level of 3xFLAG-YoaJ (P < 0.05). Blue triangles indicate the full-length forms of 3xFLAG-SMPs. A representative result from at least two biological replicates is shown in C–E. SD, standard deviation.
Fig 5
Fig 5
In vitro analysis of the HA-Met6-tagged SMP cleavage by RseP. (A) In vitro analysis of direct RseP-catalyzed cleavage of HA-tagged RseA148. The HA-RseA148 model substrate synthesized by the PURE system in the presence of 35S-Met was incubated with purified wild-type RseP (WT), RseP(E23Q)-HM (E23Q), or buffer only (−) in the presence or absence of 5 mM 1,10-phenanthroline (dissolved in dimethyl sulfoxide (DMSO); the final concentration of DMSO was 5%) for the indicated periods. The proteins in the reaction mixtures were analyzed by 15% Bis-Tris SDS-PAGE and phosphor imaging. The N-terminal (N-ter) or C-terminal (C-ter) cleaved fragment was predicted to contain 7 or 2 [35S]-labeled methionine, respectively. The full-length proteins and predicted RseP cleavage products are indicated by blue and red triangles, respectively. A representative result from two biological replicates is shown. (B–E) RseP-catalyzed cleavage of in vitro synthesized HA-RseA148 (B) and HA-Met6-SMPs (C–E) after 24 h incubation. HA-tagged RseA148 (B) and HA-Met6 tagged SMP proteins (C–E) were synthesized as in A and incubated at 37°C for the indicated periods with (+) or without (−) purified wild-type RseP. Total proteins in the reaction mixtures were analyzed as shown in A. SMPs for which cleavage products were detected are shown in C and D, and those for which cleavage products were not detected are shown in E. The lower panels labeled “Contrast+” in D are signal-enhanced images of the upper panels labeled “Contrast−”. A representative result from two biological replicates is shown in B–E. (F) The RseP-dependent decrease in signal of the full-length bands of SMPs. The percentage of the full-length signal after incubation (24 h) relative to that at the beginning of incubation (0 h) was calculated. Means of two independent experiments are shown with SD and raw data. A one-tailed Student t-test was used to compare the values between the groups. *P  <  0.05, **P  <  0.01, ***P  <  0.001, and ns, not significant. SD, standard deviation.
Fig 6
Fig 6
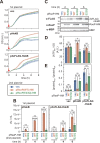
Suppression of the biological activities of HokB by RseP. (A and B) Suppression of HokB-induced growth defect by RseP. YK225 (ΔhokB-175 ΔrseA ΔrseP::kan) cells harboring pTWV228 (vec, 1st plasmid), pYK99 (pHokB, 1st plasmid), or pYK78 (p3xFLAG-HokB, 1st plasmid) were further transformed with pSTD689 (vec, 2nd plasmid), pYH9 [pRseP(WT)-HM, 2nd plasmid], or pYH13 [pRseP(E23Q)-HM, 2nd plasmid]. hokB, 3xflag-hokB, and rseP-hm are placed under the control of the lac promoter on each plasmid. The cells were grown at 37°C in L medium supplemented with 1 mM IPTG and 1 mM cAMP to induce both HokB and RseP from the onset of cultivation (0 h, red arrows). (A) Optical density (OD) measured with Taitec mini photo 518R (660 nm) every 1 h. Means of data from at least four biologically independent experiments are shown with SD (light-colored shade). (B) The cfu measurement with HokB- and RseP-expressed cells. Cells were harvested at the 2-, 4-, and 6-h time points, diluted appropriately with saline, and plated on L solid medium containing glucose, which minimizes the expression of RseP and HokB from the lac promoter, and the number of colonies was counted. Means of data from two biologically independent experiments are shown with SD and individual data. One-way analysis of variance (ANOVA) with Tukey’s test was performed, *P  <  0.05, **P  <  0.01, ***P  <  0.001, and ns, not significant. (C) Cleavage of HokB by RseP. YK225 cells harboring pYK78 in addition to pSTD689 (vec), pYH9 (WT), or pYH13 (E23Q) were grown as in A (the growth curves are shown in Fig. S5D). At the 2-, 4-, and 6-h time points, 500 µL of the cultures was removed and subjected to SDS-PAGE and anti-FLAG, anti-RseP, and anti-MBP immunoblotting analysis as in Fig. 4A. A representative result from two biological replicates is shown. (D and E) Suppression of the decrease in the cellular ATP levels (D) and protein leakage/cell lysis (E) induced by HokB. The cells were grown for 4 h as in A, and then 500 µL of the cultures was centrifuged to obtain the cell and supernatant fractions. The supernatant fractions were filtered to remove the contaminated cells. (D) The relative concentrations of ATP in the cells were quantified using the luciferin-luciferase method. The relative ATP levels per cell [(ATP)ppt/OD] were calculated by dividing the relative ATP concentrations by the optical densities of the cultures at the sampling point. (E) The amount of the total proteins in each fraction was measured, and the ratio of the amount of total proteins in the supernatant [(protein)sup] to that in the precipitate [(protein)ppt] was plotted. Means of the data from three biologically independent experiments are shown with SD and individual data. One-way ANOVA with Tukey’s test was performed, *P  <  0.05, **P  <  0.01, ***P  <  0.001, and ns, not significant. SD, standard deviation.
Fig 7
Fig 7
A model of RseP-catalyzed cleavage of SMPs and its functional significance. We have shown that RseP cleaves SMPs, including HokB, and also that RseP cleaves HokB to suppress the three phenotypes associated with HokB overexpression (i.e., ATP leakage and/or synthesis inhibition, protein leakage and/or cell lysis, and ghost cell morphology), which would contribute to the neutralization of the HokB cytotoxicity by RseP. Peri, IM, and Cyto indicate the periplasm, inner membrane, and cytoplasm, respectively.

Similar articles

Cited by

References

    1. Strisovsky K. 2016. Why cells need Intramembrane proteases - a mechanistic perspective. FEBS J 283:1837–1845. doi:10.1111/febs.13638 - DOI - PubMed
    1. Kühnle N, Dederer V, Lemberg MK. 2019. Intramembrane proteolysis at a glance: from signalling to protein degradation. J Cell Sci 132:jcs217745. doi:10.1242/jcs.217745 - DOI - PubMed
    1. Kroos L, Akiyama Y. 2013. Biochemical and structural insights into intramembrane metalloprotease mechanisms. Biochim Biophys Acta 1828:2873–2885. doi:10.1016/j.bbamem.2013.03.032 - DOI - PMC - PubMed
    1. Weihofen A, Martoglio B. 2003. Intramembrane-cleaving proteases: Controlled liberation of proteins and bioactive peptides. Trends Cell Biol 13:71–78. doi:10.1016/s0962-8924(02)00041-7 - DOI - PubMed
    1. Sun L, Li X, Shi Y. 2016. Structural biology of intramembrane proteases: mechanistic insights from rhomboid and S2P to γ-Secretase. Curr Opin Struct Biol 37:97–107. doi:10.1016/j.sbi.2015.12.008 - DOI - PubMed