. 2023 Oct 2;83(19):3205-3219.
doi: 10.1158/0008-5472.CAN-23-0046.

Galectin-1 Mediates Chronic STING Activation in Tumors to Promote Metastasis through MDSC Recruitment

Affiliations

Galectin-1 Mediates Chronic STING Activation in Tumors to Promote Metastasis through MDSC Recruitment

Dhanya K Nambiar et al. Cancer Res. .

Abstract

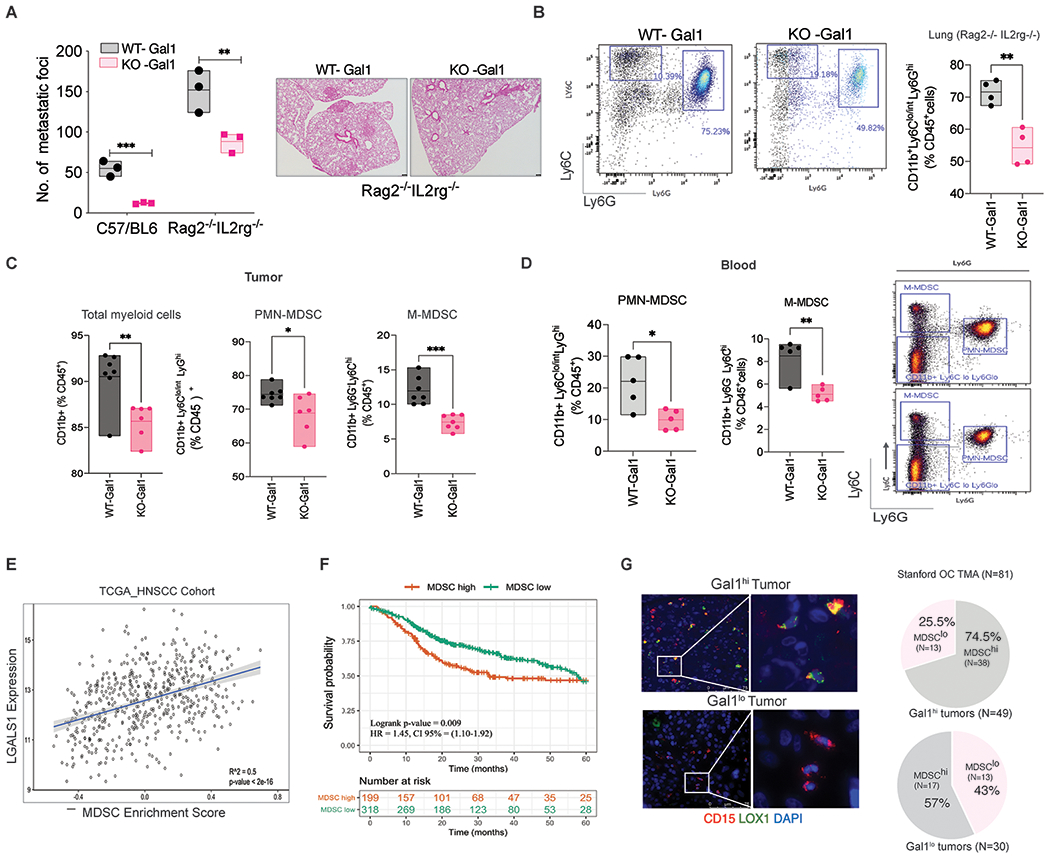
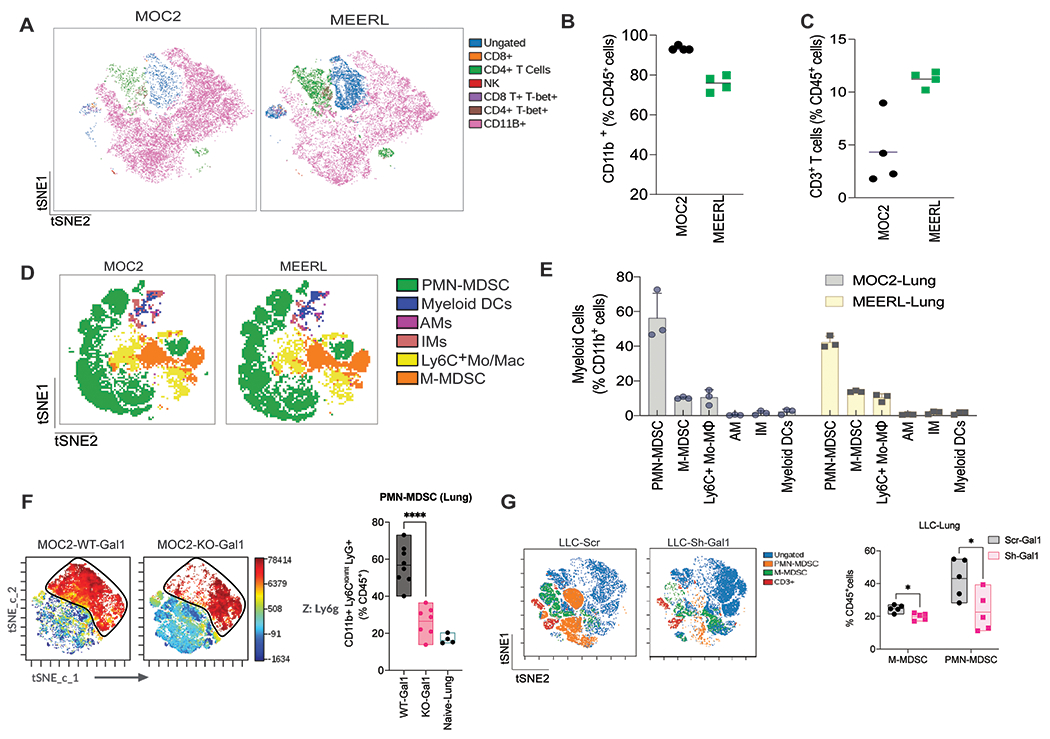
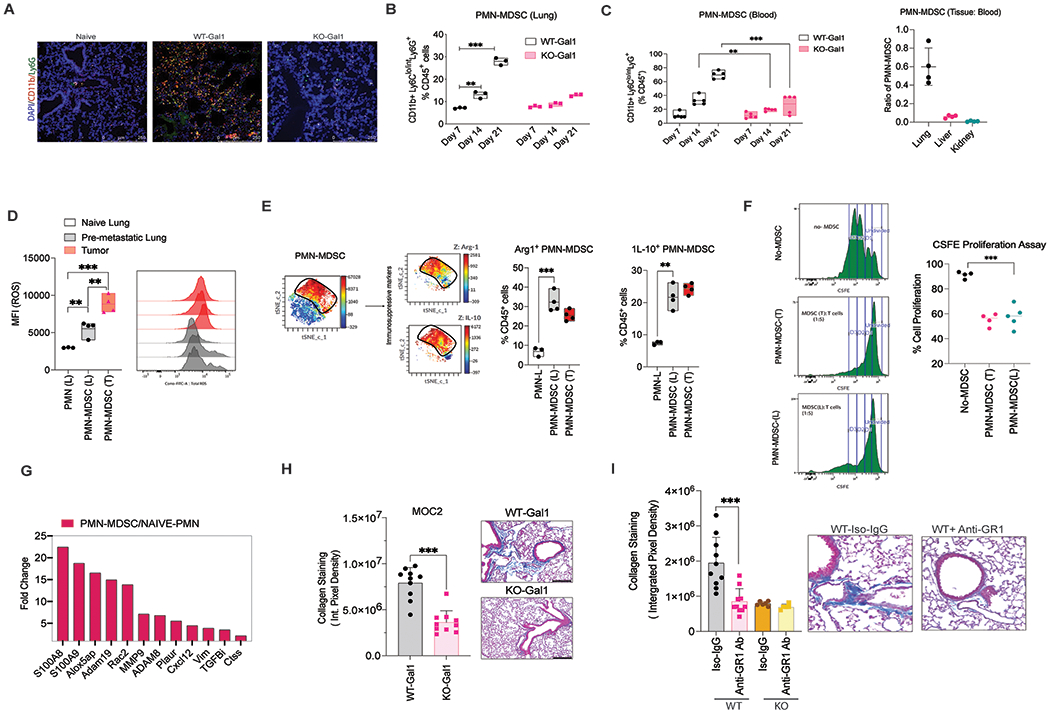
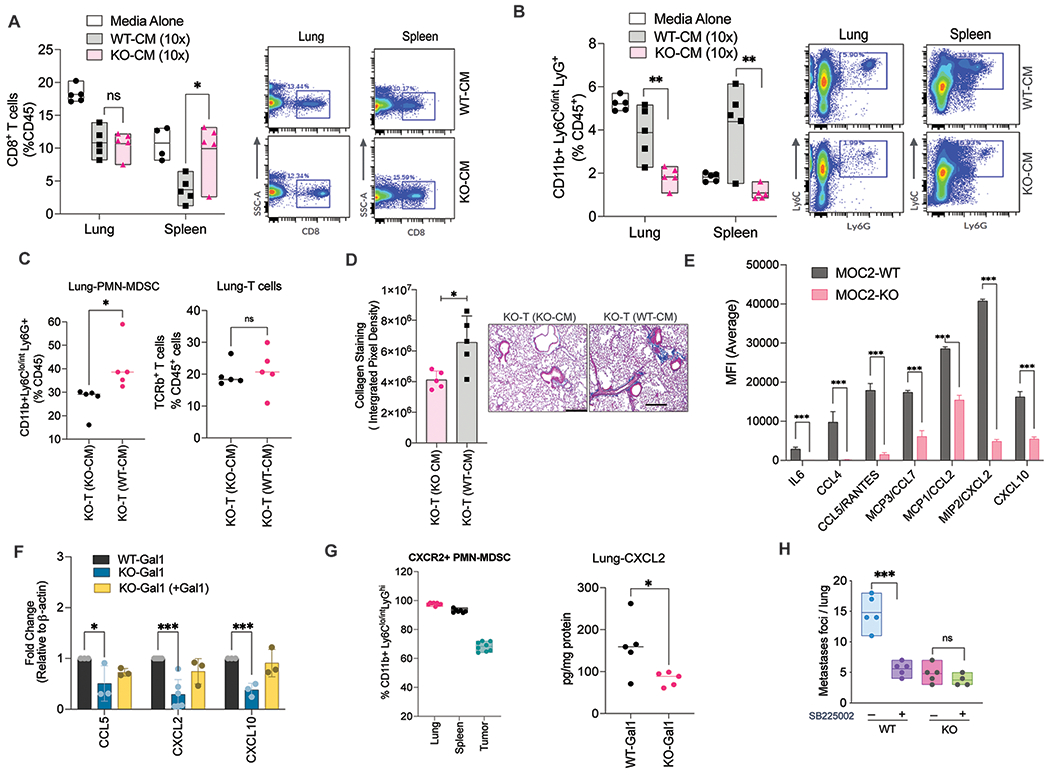
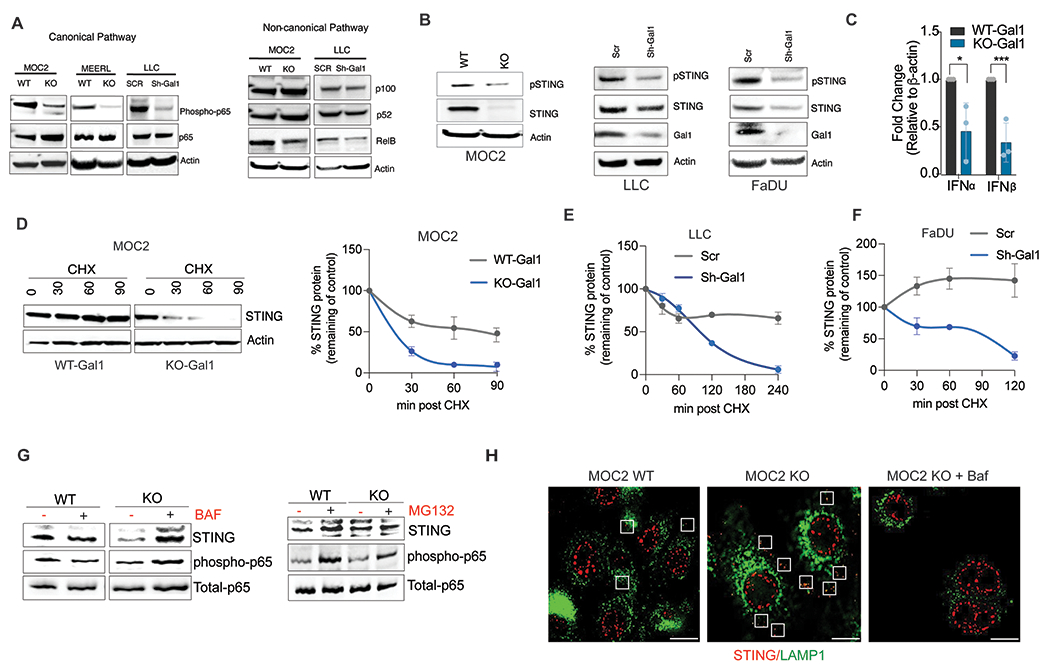
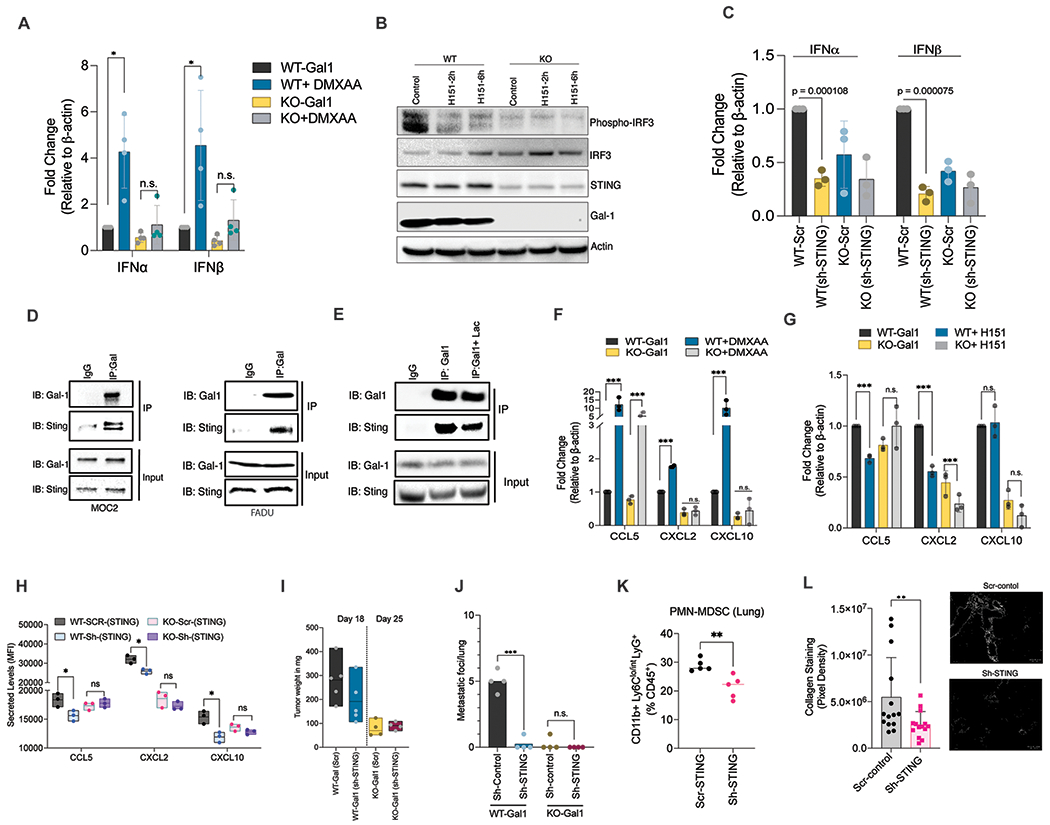
The immune system plays a crucial role in the regulation of metastasis. Tumor cells systemically change immune functions to facilitate metastatic progression. Through this study, we deciphered how tumoral galectin-1 (Gal1) expression shapes the systemic immune environment to promote metastasis in head and neck cancer (HNC). In multiple preclinical models of HNC and lung cancer in immunogenic mice, Gal1 fostered the establishment of a premetastatic niche through polymorphonuclear myeloid-derived suppressor cells (PMN-MDSC), which altered the local microenvironment to support metastatic spread. RNA sequencing of MDSCs from premetastatic lungs in these models demonstrated the role of PMN-MDSCs in collagen and extracellular matrix remodeling in the premetastatic compartment. Gal1 promoted MDSC accumulation in the premetastatic niche through the NF-κB signaling axis, triggering enhanced CXCL2-mediated MDSC migration. Mechanistically, Gal1 sustained NF-κB activation in tumor cells by enhancing stimulator of interferon gene (STING) protein stability, leading to prolonged inflammation-driven MDSC expansion. These findings suggest an unexpected protumoral role of STING activation in metastatic progression and establish Gal1 as an endogenous-positive regulator of STING in advanced-stage cancers.

Significance: Galectin-1 increases STING stability in cancer cells that activates NF-κB signaling and CXCL2 expression to promote MDSC trafficking, which stimulates the generation of a premetastatic niche and facilitates metastatic progression.


Conflict of interest statement

Declaration of Interest: The authors have declared that no conflict of interest exists.

Figures

Fig. 1:
Fig. 1:. Galectin-1 (Gal1) promotes tumor induced-MDSC both in local and systemic compartments.
A. Quantification of lung metastases foci after subcutaneous. implantation of MOC2 WT-Gal1 or KO-Gal1 cell lines in immune-competent C57/BL6 or immune deficient (Rag2−/− IL2rg−/−) mice. The number of nodules per lung area was quantified by H&E staining (Right). B. Quantification of CD11b+Ly6Clo/int Ly6G+ cells in lungs of mice implanted with MOC2 WT-Gal1 and KO-Gal1 tumors in Rag2−/− IL2rg−/−, after enzymatic dissociation and flow cytometry analyses. C. Quantification of total myeloid cells (CD11b+), PMN-MDSC (CD11b+Ly6Clo/intLy6G+) and M-MDSC (CD11b+Ly6G Ly6Chi) cells in MOC2 WT-Gal1 and KO-Gal1 tumors after enzymatic dissociation and flow cytometry analyses. D. Quantification of PMN-MDSC (CD11b+Ly6Clo/intLy6G+) and M-MDSC (CD11b+Ly6GLy6Chi) cells in the blood at Day 14 in mouse bearing subcutaneous MOC2 WT/ KO-Gal1 tumors. E. Pearson’s correlation was used to assess the correlation between LGALS1 gene expression and MDSC enrichment scores in the TCGA HNSCC cohort. F. Kaplan Meir survival analyses for the TCGA HNSCC cohort using Gene Set variation analyses depict survival differences between patients with MDSChi and MDSClo (based on the enrichment score). The enrichment score for each patient sample was the difference in the statistic between genes inside and outside of the MDSC signature gene set. For the MDSC enrichment score survival analysis, risk groups were defined by using the MDSC enrichment score of 0.1. G. Immunofluorescence staining of PMN-MDSC in human oral cavity cancer TMA (N=81) using CD15 (red), LOX1 (green), and DAPI (Blue) staining. The white insets represent zoomed area (right image). The Pie chart (right panel) represents the distribution of patients with high or low MDSC burden in the cohort of patients with high Gal1 (N=51) and low Gal1 (N=30) expressing tumors.
Fig. 2:
Fig. 2:. Galectin-1 deletion reduces MDSC levels in the lungs in HNC and lung cancer models.
A. tSNE analysis of murine immune cells in lungs of mice bearing 300mm3 subcutaneous MOC2 and mEERL tumors, run on 5000 live CD45+ single cells from each sample. B. Relative proportions of CD11b+ cells in the lungs of tumor-bearing mice. C. Relative proportions of CD3+ T cells in the lungs of tumor-bearing mice. D. tSNE analysis of myeloid cells in lungs of mice bearing 300mm3 subcutaneous MOC2 and mEERL tumors, run on 4000 live CD11b+ cells. E. Quantitation of M-MDSCs, PMN-MDSCs, interstitial macrophages (M), alveolar macrophages (AM), and myeloid DCs as a percentage of CD11b+ cells in the lungs of tumor-bearing mice at Day 14 - a time point before visible metastases are observed. F. tSNE analyses showing the distribution of immune cells in lungs in mice bearing MOC2 WT-Gal1 and KO-Gal1 tumor run on 5000 live CD45+ single cells from each sample (Left), and quantitation of CD11b+Ly6Clo/int Ly6G+ PMN-MDSCs in the lungs (Right) (n = 7-8 mice). G. tSNE analyses of immune cells in lungs (Left) and quantitation of CD11b+Ly6Clo/int Ly6G+ PMN-MDSCs and CD11b+Ly6GLy6Chi M-MDSC (Right) in LLC-Scramble and LLC-Sh-Gal1 tumor-bearing mice. Student’s t-test (two-tailed) was used for comparing the two groups. Each dot represents one mouse. Data are shown as mean+/−SD. Experiments have been repeated a minimum of two times with similar results.
Fig. 3:
Fig. 3:. Galectin-1 mediated PMN-MDSC enrichment in the lung promotes lung remodeling and pre-metastatic niche formation.
A. Representative images of the lung from Naïve mice or mice bearing either WT-Gal1 or KO-Gal1 tumor showing PMN-MDSC (CD11b+- Green and Ly6G+- red) distribution at Day 14-time point. B. Time-series analyses of PMN-MDSC levels in lungs of mice bearing MOC2 WT-Gal1 and KO-Gal1 tumors at Day 7, 14, and 21 (before metastatic seeding), n=3 (repeated in two independent experiments). C. (Left) Time-series analyses of PMN-MDSC levels in the blood of mice bearing MOC2 WT-Gal1 and KO-Gal1 tumors at Day 7, 14, and 21(n=5 / group); (Right) Ratio of PMN-MDSCs in different tissues (lung, liver, kidney) to the PMN-MDSC levels in blood. D. Graph and histogram showing ROS levels (MFI-DCFDA) in PMNs from Naïve mice or PMN-MDSCs isolated from tumors or corresponding lung tissue (n=4). E. tSNE analysis of immune cells in lungs in mice bearing 300mm3 subcutaneous MOC2 and, run on 5000 live CD45+ single cells from each sample (Left). Quantitation shows a high percentage of Arginase-1+ (Arg-1+) and Interleukin-10+ (IL-10+) PMN-MDSCs in the lungs and the tumor (Right). F. Data showing suppression of T cell proliferation by PMN-MDSCs isolated from the tumor and lung of MOC-2 tumor-bearing mice (n= 4). G. Fold change in gene expression of established pre-metastatic niche components between Naïve PMNs and PMN-MDSCs isolated from tumor-bearing mice using RNA-Seq analyses. H. Representative images and quantification of Trichrome staining intensity in the lungs of MOC2 WT/KO-Gal1 tumor-bearing mice (n=5/group). I. Representative images and quantification of Trichrome staining intensity in lungs of MOC2 WT/KO-Gal1 tumor-bearing mice treated with either Anti-GR1 antibody or the isotype control IgG, n=5/group. Two-tailed unpaired t-test was performed for the comparisons between the two groups. Two-way ANOVA and Tukey’s multiple comparisons test were performed when more than two groups were compared. Each dot represents one mouse, and the bar denotes the mean. Data are shown as mean+/−SD.
Fig. 4:
Fig. 4:. Galectin-1 enhances MDSC recruitment to pre-metastatic site by increasing myeloid chemokine production.
A. Quantification and flow plots showing the percentage of CD8+T cells in the lungs and the spleen of tumor naïve mice after ~3 weeks of treatment with either WT- or KO-Gal1 conditioned media (CM) or control media. B. Quantification and flow plots showing the percentage of PMN-MDSCs in the lung or spleen of tumor naïve mice after ~3 weeks of treatment with either WT- or KO-Gal1 CM or control media. C. Quantitation of PMN-MDSCs and T cells in the lungs of mice bearing KO-Gal1 tumors injected with either WT- or KO-Gal1 CM for 3 weeks. D. Quantitation and representative images showing the amount of collagen staining (Trichrome staining) in the lungs of mice bearing KO-Gal1 tumors injected with either WT- or KO-Gal1 CM for 3 weeks. E. Luminex data showing differentially secreted cytokines between the WT/KO-Gal1 conditioned media from MOC2 cells collected after 24h of culture followed by 10x concentration. F. Relative mRNA expression of CCL5, CXCL2 and CXCL10 in MOC2 WT-Gal1 cells, KO-Gal1, or KO-Gal1 with exogenously reconstituted Gal1. G. (Right panel) Quantification of CXCR2 expression on the PMN-MDSCs isolated from the lung, spleen, and the tumor of MOC2 WT-Gal1 tumor-bearing mice; (Left panel) Quantification of CXCL2 protein levels in the lung lysate from mice bearing MOC2 WT- or KO-Gal1 tumors. H. Quantification of metastatic foci per lung from MOC2 WT/KO-Gal1 tumors treated with vehicle or SB225002 (CXCR2 inhibitor). Two-tailed unpaired t-test was performed for the comparisons between the two groups. Two-way ANOVA and Tukey’s multiple comparisons test were performed when more than two groups were compared. Each dot represents one mouse. Data are shown as mean+/−SD. All experiments were repeated 2 times with similar results.
Fig. 5:
Fig. 5:. Galectin-1 mediates chronic NF-kB activation by preventing autophagolysosomal degradation of STING
A. Representative immunoblot showing expression of characteristic proteins in the canonical and non-canonical NF-kB signaling pathway in WT- or KO-Gal1 MOC2 or mEERL cells and in WT or Sh-Gal1 LLC cells. B. Representative Immunoblots showing total and phosphorylated (activated) STING protein levels in WT or KO-Gal1 MOC2 cells, WT or Sh-Gal1 LLC cells, and in WT or Sh-Gal1 FaDU cells (human HNSCC). C. q-PCR analysis of IFN-α and IFN-β gene expression levels in MOC2 WT/KO-Gal1 cells. D. Representative Immunoblot of STING in MOC2 WT/KO-Gal1 cells treated with 10 μg/ml translation inhibitor cycloheximide (CHX) for 0 to 90 minutes with β-actin as a loading control (left panel); Quantification of STING level in MOC2 WT/KO-Gal1 cells (right panel, n=3). E. Quantitation of STING level in LLC-Scr and Sh-Gal1 cells treated with 10 μg/ml cycloheximide (CHX) for 0 to 240 minutes. F. Quantitation of STING level in FaDU-Scr and Sh-Gal1 cells treated with 10 μg/ml cycloheximide (CHX) for 0 to 120 minutes. G. Immunoassay of STING in MOC2 WT/KO-Gal1 cells treated with lysosomal fusion inhibitor, 250 nM Bafilomycin (left) or proteasome inhibitor, 5μM MG132 (right) for 6 h. H. Immunofluorescence imaging of STING (red) and LAMP1 (green) in MOC2/KO-Gal1 cells with or without Bafilomycin (Baf) treatment; Boxes indicate points of colocalization between STING and LAMP1. Student’s t-test (two-tailed) was used for comparing a single treatment to the control.
Fig. 6:
Fig. 6:. Endogenous Galectin-1 interacts with STING, maintains chronic activation, leading to MDSC expansion, lung remodeling and metastatic progression.
A. q-PCR quantification of IFNα and IFNβ gene expression levels in MOC2 WT/KO-Gal1 cells were treated with 300 μM DMXAA for 16h. B. Immunoblot analyses showing phospho-IRF3 and STING levels in MOC2 WT/KO-Gal1 cells treated with either DMSO or H151 (STING inhibitor) for 2h and 6h. C. q-PCR quantification (left panel) of IFNα and IFNβ gene expression with STING knockdown in MOC2 WT/KO-Gal1 cells using lentiviral delivered shRNAs. D. Extracts of MOC2 and FaDU cells were subjected to immunoprecipitation with an anti-Gal1 antibody and immunoblotted with anti-STING and anti-Gal1 antibodies. E. Protein lysate from either PBS or 10mM lactose (24 h) treated MOC2 cells were subjected to immunoprecipitation with an anti-Gal1 antibody and immunoblotted with anti-STING and anti-Gal1 antibodies. F. q-PCR showing gene expression of CCL5, CXCL2, and CXCL10 following treatment with DMXAA for 24 h in MOC2 WT/KO-Gal1 cells. G. q-PCR showing gene expression of CCL5, CXCL2, and CXCL10 following treatment with H151 for 24 h in MOC2 WT/KO-Gal1 cells. H. Quantification of secreted levels of CCL5, CXCL2, and CXCL10 when STING is knocked down in WT/KO-Gal1 cells using Luminex assay. I. Weights of vector control (Scr) and STING knockdown (shSTING) MOC2 WT/KO-Gal1 tumors following orthotopic buccal injections at Day 20. J. Quantification of metastatic burden in the lungs of mice bearing orthotopic buccal tumor of vector control (Scr) and STING knockdown (shSTING) MOC2 WT/KO-Gal1 tumor cells (n=5/group). K. Quantification of PMN-MDSCs in the lungs after orthotopic buccal implantation of vector control (Scr) or STING knockdown (sh-STING) MOC2 WT/KO-Gal1 tumor cells. L. Quantification of collagen staining in the lungs of mice bearing vector control (scr) or STING knockdown MOC2 WT-Gal1 tumor. Student’s t-test (two-tailed) was used for comparing a single treatment to the control. One-way ANOVA with Tukey’s adjustment was used to compare multiple treatments. Data are shown as mean+/−SD. All experiments were repeated 2 times with similar results.

References

    1. Siegel RL, et al., Cancer Statistics, 2021. CA Cancer J Clin, 2021. 71(1): p. 7–33. - PubMed
    1. Lambert AW, Pattabiraman DR, and Weinberg RA, Emerging Biological Principles of Metastasis. Cell, 2017. 168(4): p. 670–691. - PMC - PubMed
    1. Peinado H, et al., Pre-metastatic niches: organ-specific homes for metastases. Nat Rev Cancer, 2017. 17(5): p. 302–317. - PubMed
    1. El-Kenawi A, Hanggi K, and Ruffell B, The Immune Microenvironment and Cancer Metastasis. Cold Spring Harb Perspect Med, 2020. 10(4). - PMC - PubMed
    1. Hiam-Galvez KJ, Allen BM, and Spitzer MH, Systemic immunity in cancer. Nature Reviews Cancer, 2021. 21(6): p. 345–359. - PMC - PubMed

Publication types