

Comprehensive analysis of mitochondrial dysfunction and necroptosis in intracranial aneurysms from the perspective of predictive, preventative, and personalized medicine
- PMID: 37410216
- PMCID: PMC10425526
- DOI: 10.1007/s10495-023-01865-x
Comprehensive analysis of mitochondrial dysfunction and necroptosis in intracranial aneurysms from the perspective of predictive, preventative, and personalized medicine
Abstract
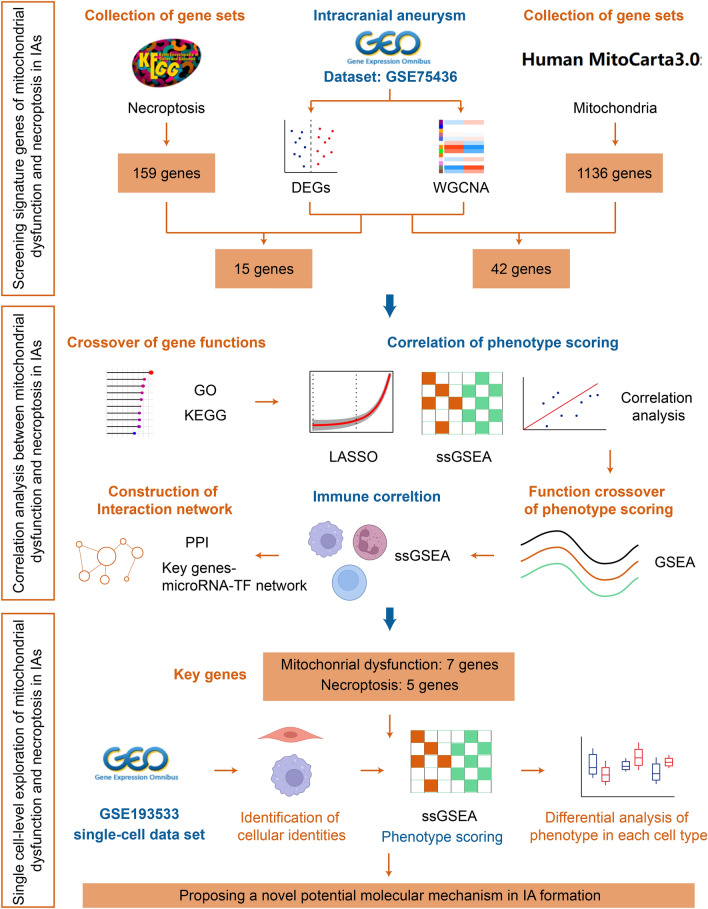
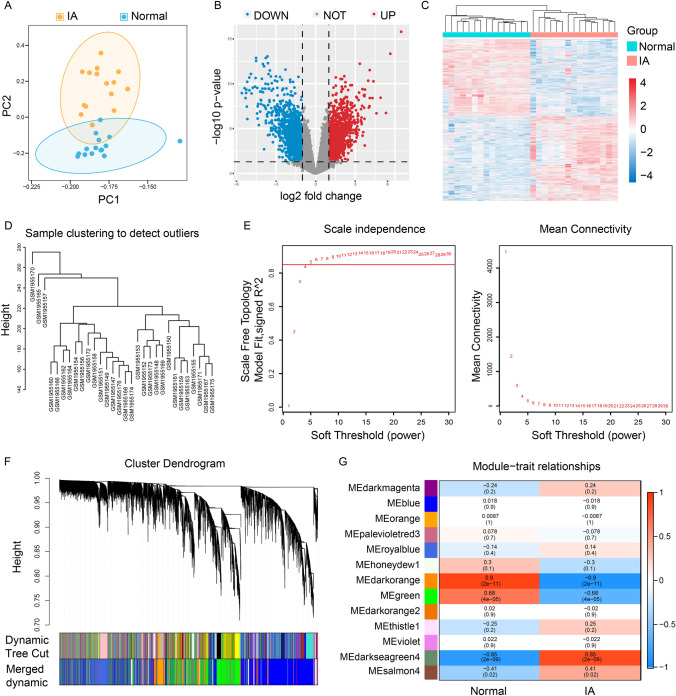
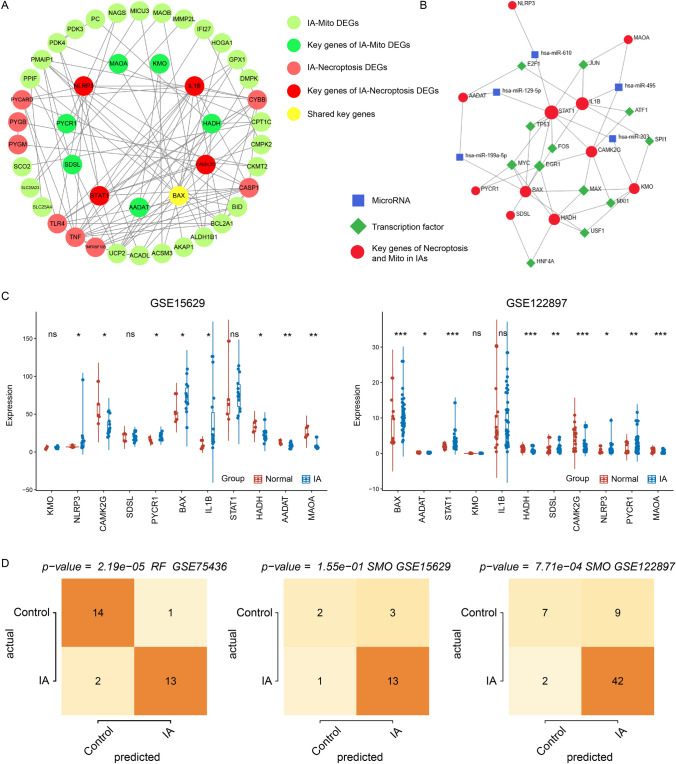
Mitochondrial dysfunction and necroptosis are closely associated, and play vital roles in the medical strategy of multiple cardiovascular diseases. However, their implications in intracranial aneurysms (IAs) remain unclear. In this study, we aimed to explore whether mitochondrial dysfunction and necroptosis could be identified as valuable starting points for predictive, preventive, and personalized medicine for IAs. The transcriptional profiles of 75 IAs and 37 control samples were collected from the Gene Expression Omnibus (GEO) database. Differentially expressed genes (DEGs), weighted gene co-expression network analysis, and least absolute shrinkage and selection operator (LASSO) regression were used to screen key genes. The ssGSEA algorithm was performed to establish phenotype scores. The correlation between mitochondrial dysfunction and necroptosis was evaluated using functional enrichment crossover, phenotype score correlation, immune infiltration, and interaction network construction. The IA diagnostic values of key genes were identified using machine learning. Finally, we performed the single-cell sequencing (scRNA-seq) analysis to explore mitochondrial dysfunction and necroptosis at the cellular level. In total, 42 IA-mitochondrial DEGs and 15 IA-necroptosis DEGs were identified. Screening revealed seven key genes invovled in mitochondrial dysfunction (KMO, HADH, BAX, AADAT, SDSL, PYCR1, and MAOA) and five genes involved in necroptosis (IL1B, CAMK2G, STAT1, NLRP3, and BAX). Machine learning confirmed the high diagnostic value of these key genes for IA. The IA samples showed higher expression of mitochondrial dysfunction and necroptosis. Mitochondrial dysfunction and necroptosis exhibited a close association. Furthermore, scRNA-seq indicated that mitochondrial dysfunction and necroptosis were preferentially up-regulated in monocytes/macrophages and vascular smooth muscle cells (VSMCs) within IA lesions. In conclusion, mitochondria-induced necroptosis was involved in IA formation, and was mainly up-regulated in monocytes/macrophages and VSMCs within IA lesions. Mitochondria-induced necroptosis may be a novel potential target for diagnosis, prevention, and treatment of IA.
Keywords: 3P medicine; Bioinformatics; Intracranial aneurysm; Mitochondrial dysfunction; Necroptosis.
© 2023. The Author(s).
Conflict of interest statement
The authors declare no competing interests.
Figures


Similar articles
-
Comprehensive Analysis of Regulated Cell Death in Intracranial Aneurysms.Front Biosci (Landmark Ed). 2023 Nov 16;28(11):289. doi: 10.31083/j.fbl2811289. Front Biosci (Landmark Ed). 2023. PMID: 38062817
-
Identifying pyroptosis- and inflammation-related genes in intracranial aneurysms based on bioinformatics analysis.Biol Res. 2023 Sep 27;56(1):50. doi: 10.1186/s40659-023-00464-z. Biol Res. 2023. PMID: 37752552 Free PMC article.
-
An immunogenic cell death-related regulators classification patterns and immune microenvironment infiltration characterization in intracranial aneurysm based on machine learning.Front Immunol. 2022 Sep 29;13:1001320. doi: 10.3389/fimmu.2022.1001320. eCollection 2022. Front Immunol. 2022. PMID: 36248807 Free PMC article.
-
Vascular smooth muscle cells in intracranial aneurysms.Microvasc Res. 2023 Sep;149:104554. doi: 10.1016/j.mvr.2023.104554. Epub 2023 May 24. Microvasc Res. 2023. PMID: 37236346 Review.
-
Genetic basis of intracranial aneurysm formation and rupture: clinical implications in the postgenomic era.Neurosurg Focus. 2019 Jul 1;47(1):E10. doi: 10.3171/2019.4.FOCUS19204. Neurosurg Focus. 2019. PMID: 31261114 Review.
Cited by
-
Advances in research on mitochondrial dysfunction in neurodegenerative diseases.J Neurol. 2025 Apr 28;272(5):364. doi: 10.1007/s00415-025-13101-4. J Neurol. 2025. PMID: 40295342 Review.
-
Global tendencies and frontier topics in hemodynamics research of intracranial aneurysms: a bibliometric analysis from 1999 to 2022.Front Physiol. 2023 Nov 21;14:1157787. doi: 10.3389/fphys.2023.1157787. eCollection 2023. Front Physiol. 2023. PMID: 38074335 Free PMC article.
-
Identification of key genes associated with cellular aging and mitochondria in acute myocardial infarction.Sci Rep. 2025 Jul 1;15(1):21384. doi: 10.1038/s41598-025-05849-6. Sci Rep. 2025. PMID: 40594763 Free PMC article.
-
Current understanding of macrophages in intracranial aneurysm: relevant etiological manifestations, signaling modulation and therapeutic strategies.Front Immunol. 2024 Jan 8;14:1320098. doi: 10.3389/fimmu.2023.1320098. eCollection 2023. Front Immunol. 2024. PMID: 38259443 Free PMC article. Review.
-
Causal relationship between mitochondrial-associated proteins and cerebral aneurysms: a Mendelian randomization study.Front Neurol. 2024 Jul 17;15:1405086. doi: 10.3389/fneur.2024.1405086. eCollection 2024. Front Neurol. 2024. PMID: 39087007 Free PMC article.
References
Publication types
MeSH terms
Substances
LinkOut - more resources
Full Text Sources
Medical
Research Materials
Miscellaneous
