

Braving the waves: exploring capability well-being patterns in seven European countries during the COVID-19 pandemic
- PMID: 37410345
- PMCID: PMC11136820
- DOI: 10.1007/s10198-023-01604-8
Braving the waves: exploring capability well-being patterns in seven European countries during the COVID-19 pandemic
Erratum in
-
Correction: Braving the waves: exploring capability well-being patterns in seven European countries during the COVID-19 pandemic.Eur J Health Econ. 2024 Feb;25(1):187. doi: 10.1007/s10198-023-01636-0. Epub 2023 Oct 21. Eur J Health Econ. 2024. PMID: 37864067 Free PMC article. No abstract available.
Abstract
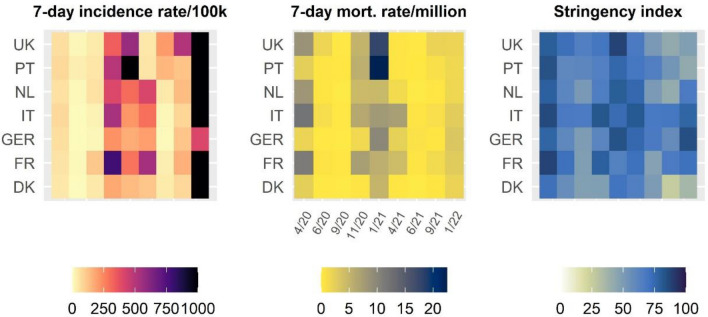
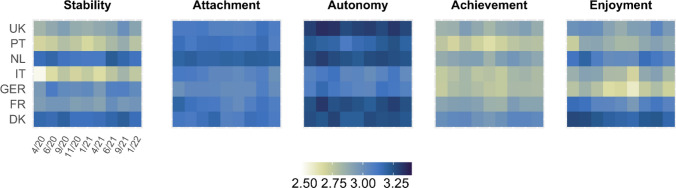
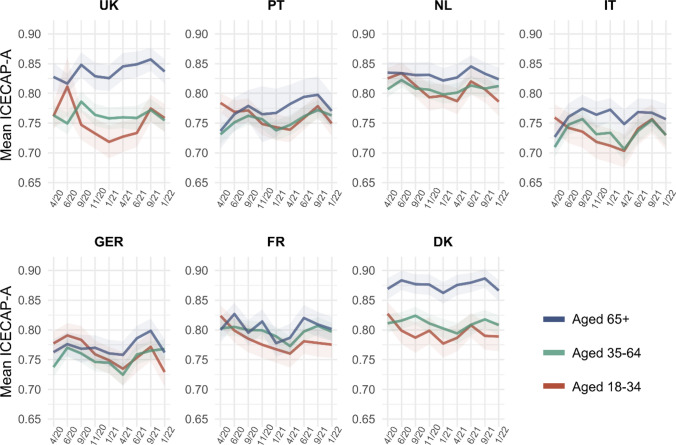
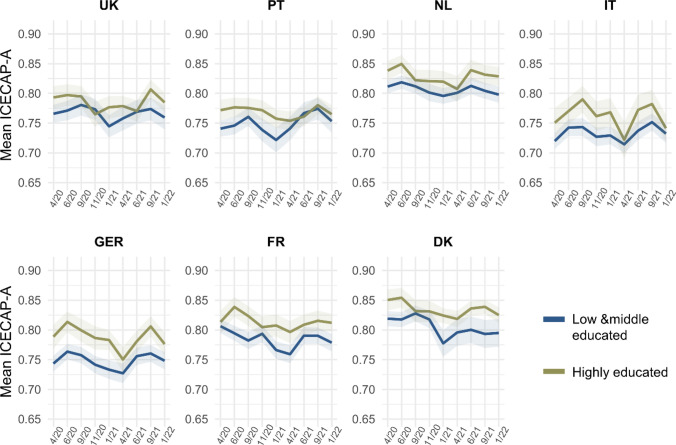
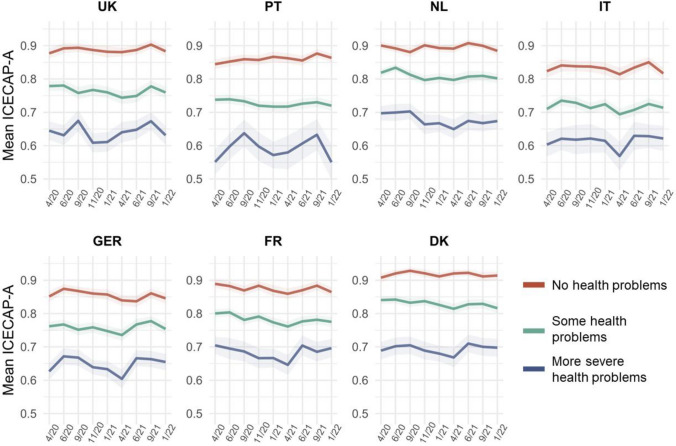
The COVID-19 pandemic considerably impacted the lives of European citizens. This study aims to provide a nuanced picture of well-being patterns during the pandemic across Europe with a special focus on relevant socio-economic sub-groups. This observational study uses data from a repeated, cross-sectional, representative population survey with nine waves of data from seven European countries from April 2020 to January 2022. The analysis sample contains a total of 25,062 individuals providing 64,303 observations. Well-being is measured using the ICECAP-A, a multi-dimensional instrument for approximating capability well-being. Average levels of ICECAP-A index values and sub-dimension scores were calculated across waves, countries, and relevant sub-groups. In a fixed effects regression framework, associations of capability well-being with COVID-19 incidence, mortality, and the stringency of the imposed lockdown measures were estimated. Denmark, the Netherlands, and France experienced a U-shaped pattern in well-being (lowest point in winter 2020/21), while well-being in the UK, Germany, Portugal, and Italy followed an M-shape, with increases after April 2020, a drop in winter 2020, a recovery in the summer of 2021, and a decline in winter 2021. However, observed average well-being reductions were generally small. The largest declines were found in the well-being dimensions attachment and enjoyment and among individuals with a younger age, a financially unstable situation, and lower health. COVID-19 mortality was consistently negatively associated with capability well-being and its sub-dimensions, while stringency and incidence rate were generally not significantly associated with well-being. Further investigation is needed to understand underlying mechanisms of presented patterns.
Keywords: COVID-19; Capability well-being; ICECAP-A; Pandemic; Well-being.
© 2023. The Author(s).
Conflict of interest statement
All authors declare: no support from any organization for the submitted work; no financial relationships with any organizations that might have an interest in the submitted work in the previous 3 years; no other relationships or activities that could appear to have influenced the submitted work.
Figures


References
-
- Hale, T., Anania, J., Angrist, N., Boby, T., Cameron-Blake, E., Folco, M. Di, Ellen, L., Goldszmidt, R., Hallas, L., KIra, B., Luciano, M., Majumadar, S., Nagesh, R., Petherick, A., Phillips, T., Tatlow, H., Webster, S., Wood, A., Zhang, Y.: Variation in government responses to COVID-19, Version 12.0. (2021)
-
- Hajek A, Sabat I, Neumann-Böhme S, Schreyögg J, Barros PP, Stargardt T, König HH. Prevalence and determinants of probable depression and anxiety during the COVID-19 pandemic in seven countries: longitudinal evidence from the European COvid Survey (ECOS) J. Affect. Disord. 2022;299:517–524. doi: 10.1016/j.jad.2021.12.029. - DOI - PMC - PubMed
Publication types
MeSH terms
Grants and funding
LinkOut - more resources
Full Text Sources
Medical
Miscellaneous
