. 2023 Sep 1;29(17):3484-3497.
doi: 10.1158/1078-0432.CCR-23-0749.

CDK4/6-MEK Inhibition in MPNSTs Causes Plasma Cell Infiltration, Sensitization to PD-L1 Blockade, and Tumor Regression

Affiliations

CDK4/6-MEK Inhibition in MPNSTs Causes Plasma Cell Infiltration, Sensitization to PD-L1 Blockade, and Tumor Regression

Jordan L Kohlmeyer et al. Clin Cancer Res. .

Abstract

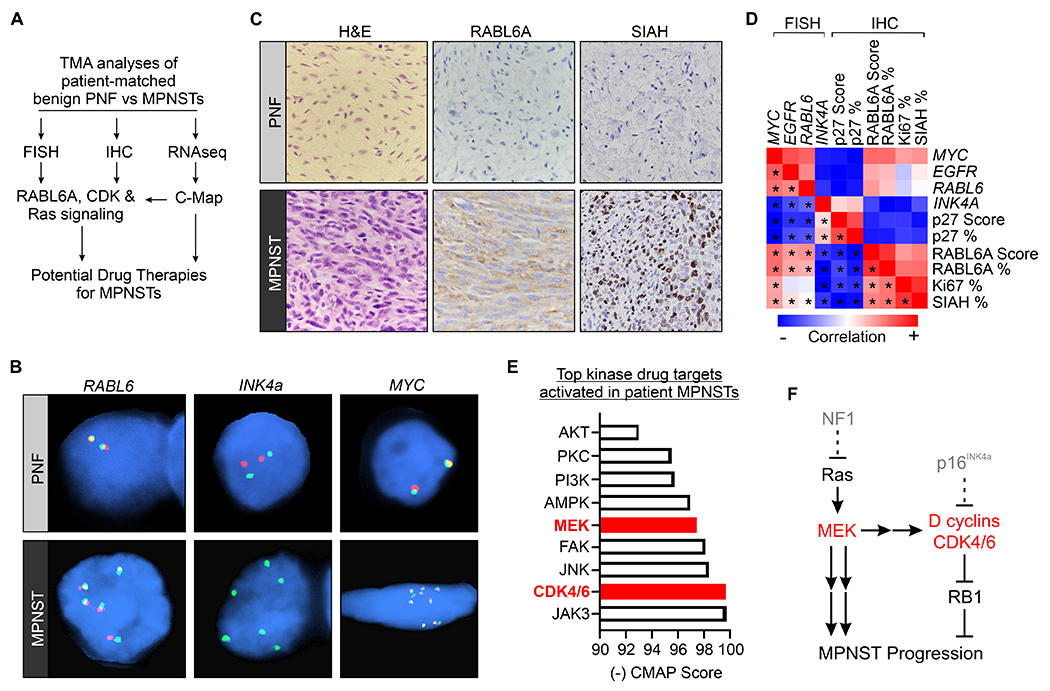
Purpose: Malignant peripheral nerve sheath tumors (MPNST) are lethal, Ras-driven sarcomas that lack effective therapies. We investigated effects of targeting cyclin-dependent kinases 4 and 6 (CDK4/6), MEK, and/or programmed death-ligand 1 (PD-L1) in preclinical MPNST models.

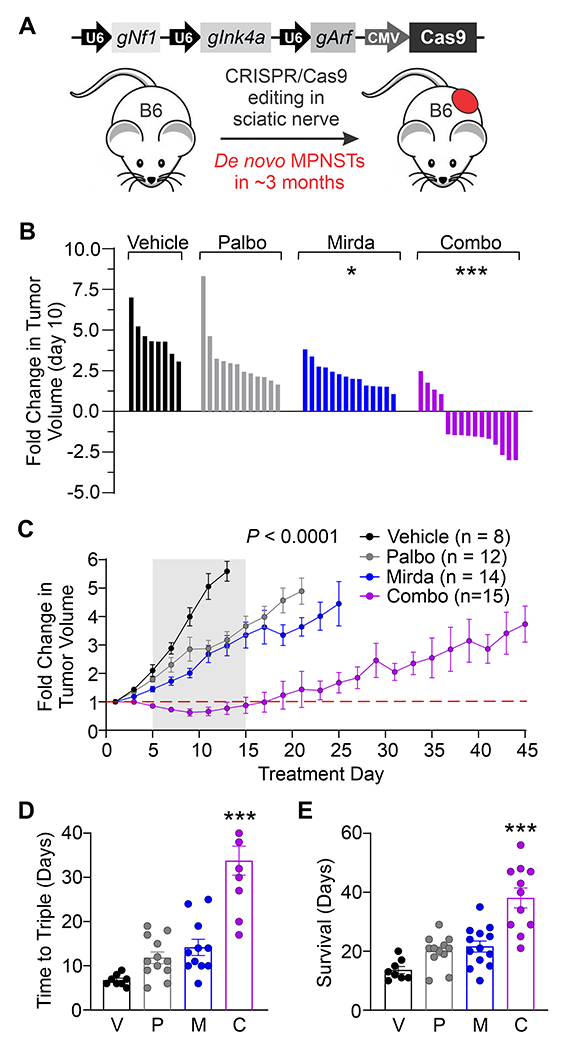
Experimental design: Patient-matched MPNSTs and precursor lesions were examined by FISH, RNA sequencing, IHC, and Connectivity-Map analyses. Antitumor activity of CDK4/6 and MEK inhibitors was measured in MPNST cell lines, patient-derived xenografts (PDX), and de novo mouse MPNSTs, with the latter used to determine anti-PD-L1 response.

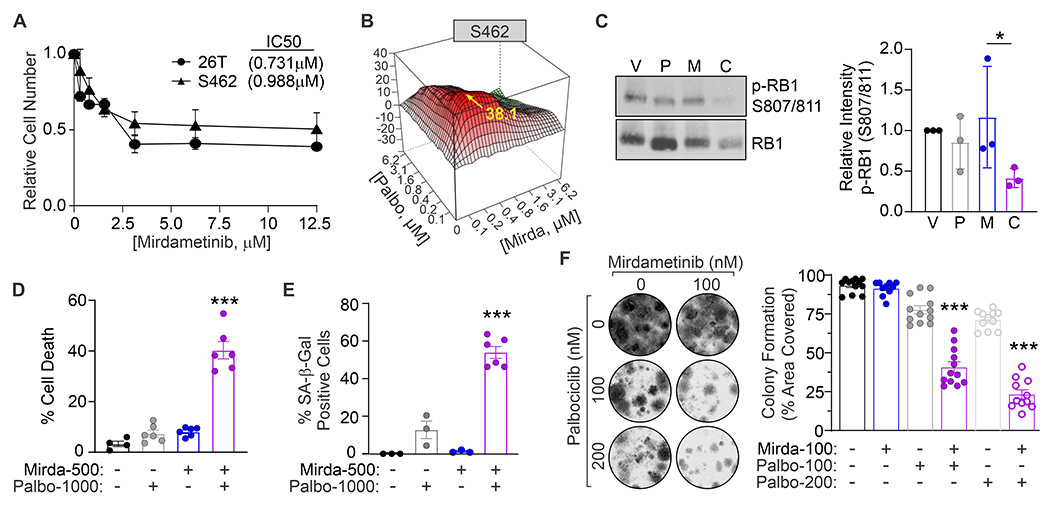
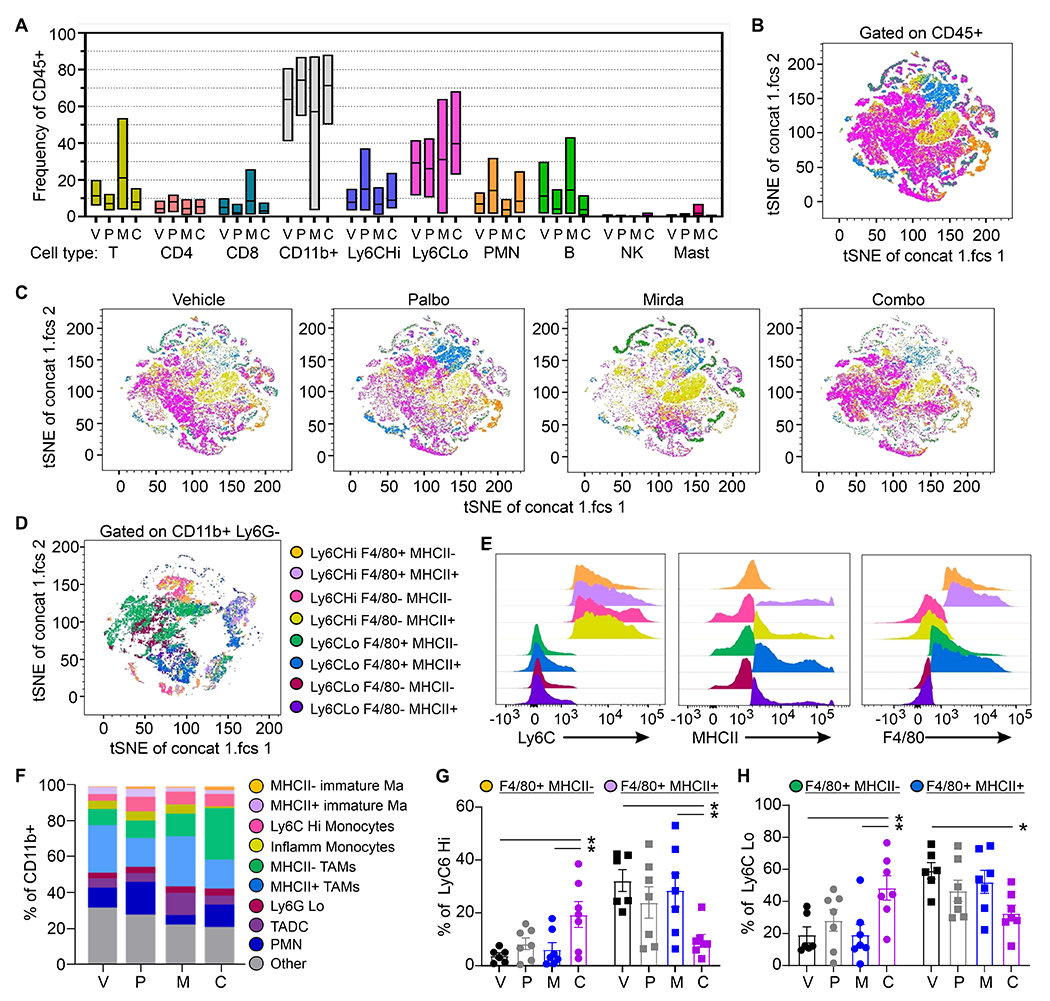
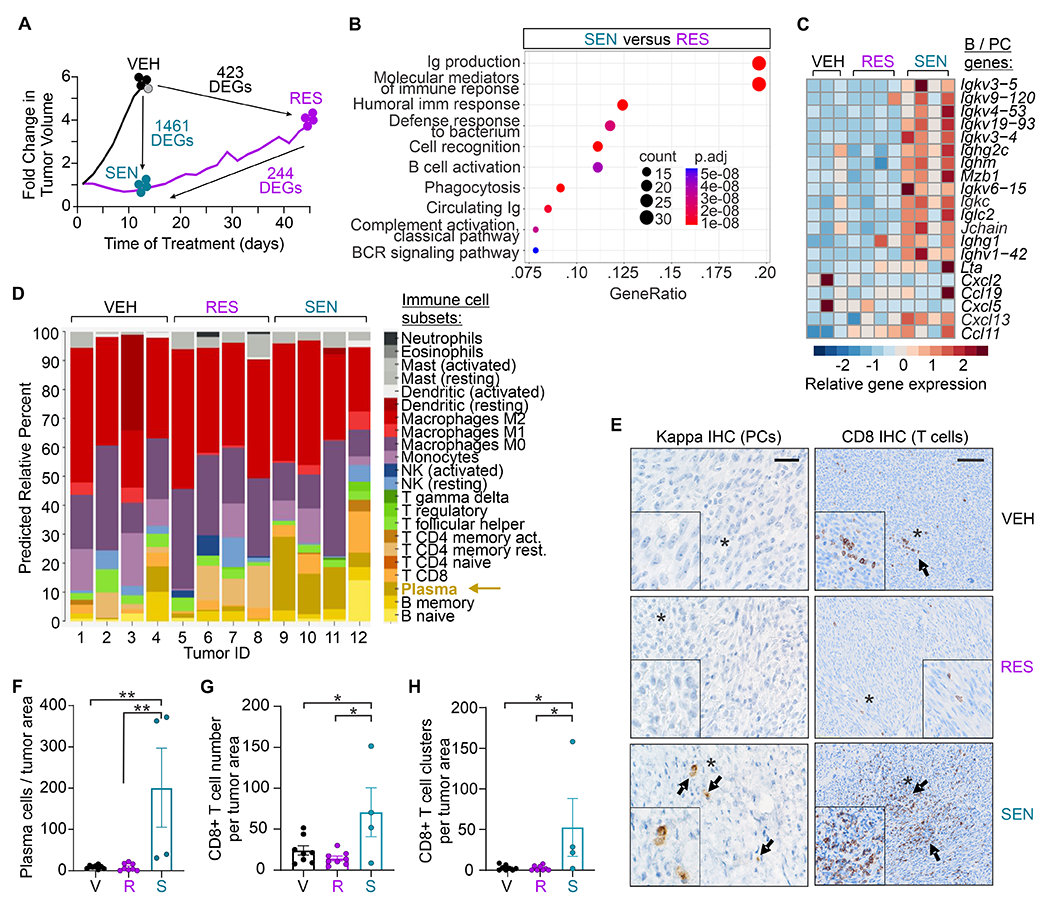
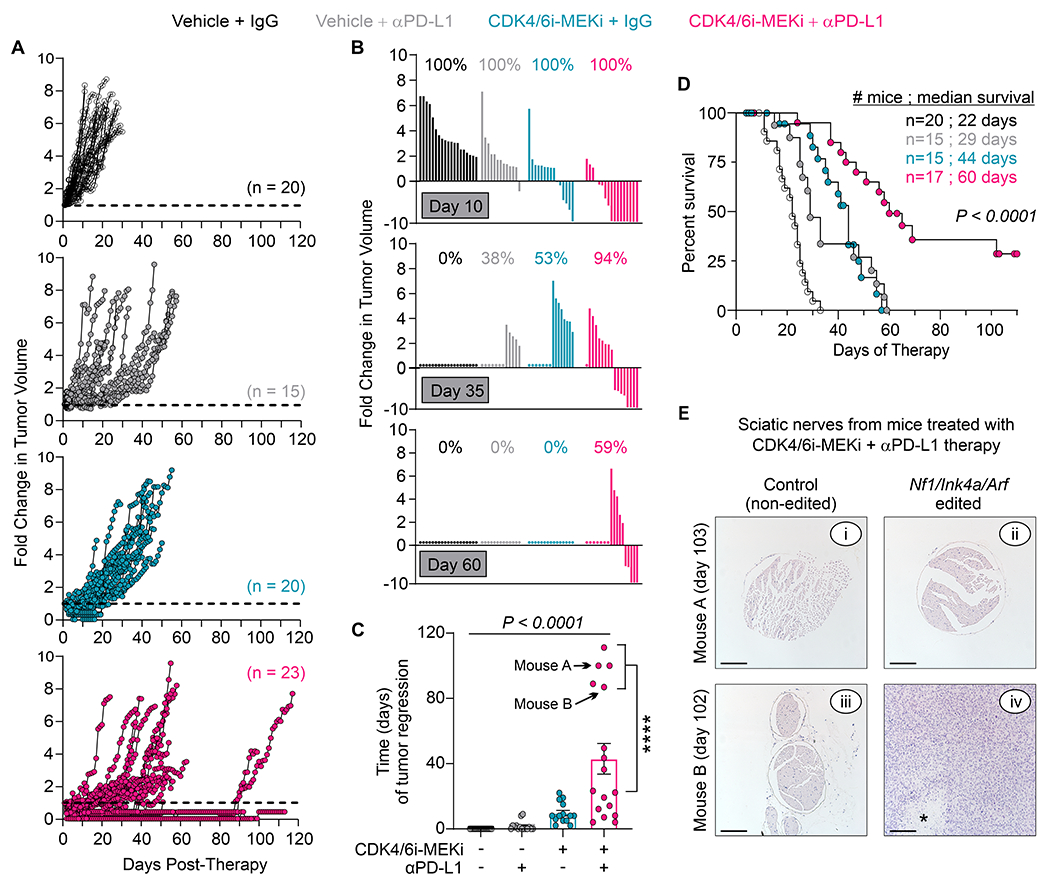
Results: Patient tumor analyses identified CDK4/6 and MEK as actionable targets for MPNST therapy. Low-dose combinations of CDK4/6 and MEK inhibitors synergistically reactivated the retinoblastoma (RB1) tumor suppressor, induced cell death, and decreased clonogenic survival of MPNST cells. In immune-deficient mice, dual CDK4/6-MEK inhibition slowed tumor growth in 4 of 5 MPNST PDXs. In immunocompetent mice, combination therapy of de novo MPNSTs caused tumor regression, delayed resistant tumor outgrowth, and improved survival relative to monotherapies. Drug-sensitive tumors that regressed contained plasma cells and increased cytotoxic T cells, whereas drug-resistant tumors adopted an immunosuppressive microenvironment with elevated MHC II-low macrophages and increased tumor cell PD-L1 expression. Excitingly, CDK4/6-MEK inhibition sensitized MPNSTs to anti-PD-L1 immune checkpoint blockade (ICB) with some mice showing complete tumor regression.

Conclusions: CDK4/6-MEK inhibition induces a novel plasma cell-associated immune response and extended antitumor activity in MPNSTs, which dramatically enhances anti-PD-L1 therapy. These preclinical findings provide strong rationale for clinical translation of CDK4/6-MEK-ICB targeted therapies in MPNST as they may yield sustained antitumor responses and improved patient outcomes.


Conflict of interest statement

Conflict of interest statement: The authors have declared that no conflict of interest exists.

Figures

Figure 1.
Figure 1.
NF1 patient tumor analyses reveal strong correlations between RABL6A, CDK-RB1, and Ras-MEK signaling that focus the selection of MPNST drugs. (A) Schematic of TMA analysis pipeline to uncover new targets and drug therapies for MPNSTs. (B) Representative FISH images of RABL6 (5’: red, 3’: green), INK4A (INK4A: red, CEP9: green), and MYC (5’: red, 3’: green) genes in human PNF and MPNST patient tumors. (C) Representative H&E and IHC images of RABL6A and SIAH (a marker of elevated Ras/MEK/MAPK activity) from a patient-matched PNF and MPNST. Images taken at 200X magnification. (D) Heatmap of gene and protein correlations from FISH and IHC analyses, respectively, of patient MPNSTs. Positive correlations are shown in red, negative correlations in blue. *, denotes statistically significant (p<0.05) Pearson correlations. (E) Graph of a selected group of top identified kinase drug targets in MPNSTs from C-Map analyses of patient MPNST versus PNF RNAseq data. (F) Simplified schematic of the connection between altered MEK and CDK4/6 pathways in MPNST.
Figure 2.
Figure 2.
Combination therapy targeting CDK4/6 and MEK acts synergistically against MPNST cells in vitro. (A) Dose response curve of 26T and S462 cells treated for 3 days with the indicated concentrations of mirdametinib. (B) Contour plot of interaction index (Bliss independence model) for the combination of low doses of palbociclib plus mirdametinib in S462 cells. Red, synergy; green, antagonism. (C) Representative westerns show treatment with the combination of palbociclib (200 nM) and mirdametinib (200 nM) for 24 hr reduced RB1 phosphorylation at CDK4/6 sites (S807/811) in S462 cells. Right, ImageJ quantification of p-RB1 detection from 3 independent experiments. (D) S462 cell viability assayed by Trypan blue exclusion and (E) senescence measured by senescence associated (SA)-β-galactosidase positivity following treatment for 3 days with the indicated drugs. Data were quantified from 3 or more biological repeats. (F) Colony formation assays in S462 cells show synergism between low concentrations of mirdametinib and palbociclib. Left, representative images of the colonies. Right, quantification of percentage area covered by cells from 3 or more experiments. A,C,D,E,F: Error bars, SD. P value, One-way ANOVA with Tukey’s correction (*, P < 0.05; ***, P < 0.001). D,E,F: Values listed for each drug under graphs are nM doses.
Figure 3.
Figure 3.
Regression and sustained suppression of primary MPNSTs by dual inhibition of CDK4/6 and MEK in immune competent mice. (A) Schematic of the CRISPR-Cas9 targeting approach involving co-inactivation of Nf1, Ink4a and Arf in the sciatic nerve of wildtype C57BL/6N mice to generate de novo MPNSTs. Panels B-E: Once tumors reached ~250 mm3, mice were treated daily with vehicle (V), 100 mg/kg palbociclib (Palbo, P), 1 mg/kg mirdametinib (Mirda, M), or the combination (Combo, C). (B) Waterfall plot at day 10 showing tumor regression only in the combination treated mice. (C) Fold change in tumor volume over the treatment period. (D) Time (in days) for tumors to triple in size. (E) Survival of the treated mice (time to maximum 2000 mm3 tumor volume). Error bars, SEM. C: P value determined by a generalized linear model to assess the difference between the curves. B,D,E: P value, One-way ANOVA with Tukey’s correction (*, P < 0.05; ***, P < 0.001).
Figure 4.
Figure 4.
Combined CDK4/6 and MEK inhibition alters myeloid populations and MHC II expression in the tumor immune microenvironment. Using the de novo MPNST model from Figure 3, flow cytometric immunophenotyping was performed on terminal tumors (n=7 per group) from vehicle (V), palbociclib (P), mirdametinib (M), or combination (C) treatment groups. (A) Frequencies for 10 major immune cell populations as a percentage of total CD45+ live cells, quantified and separated by treatment group. Same cell population colors used in panels B and C. (B) t-SNE dimensional reduction analysis of CD45+ cells from the tumors (n=28, concatenated data from all experimental groups, n=7 per treatment group) to visualize the major immune cell populations present in the tumors. (C) t-SNE analysis of CD45+ tumor cells separated by treatment group to show changes in the myeloid populations (Ly6CHi and Ly6CLo). (D) t-SNE analysis of samples gated on the major myeloid populations (Ly6CHi and Ly6CLo) to visualize 8 distinct tumor-resident monocyte/macrophage populations. Samples were gated on CD45+ CD11b+ Ly6G− cells. (E) Expression profile of Ly6C, MHC II, and F4/80 in the tumor-resident monocyte/macrophage populations (n=28, concatenated data from all experimental groups). (F) Flow cytometry quantification of the monocyte/macrophage populations as a percentage of CD11b+ cells and separated by treatment group. (G) Population frequencies with values from individual tumors for LyC6Hi populations. (H) Population frequencies with values from individual tumors for LyC6Lo populations. P value, One-way ANOVA was used for statistical analyses (*, P < 0.05).
Figure 5.
Figure 5.
MPNSTs sensitive to dual CDK4/6-MEK inhibition display an immune activation phenotype involving plasma cell infiltration and cytotoxic T cell clustering. Using the de novo MPNST model from Figure 3, (A) schematic of tumor growth and number of differentially expressed genes (DEGs) from RNAseq between the treatment groups (vehicle – VEH; palbociclib plus mirdametinib combination therapy-resistant – RES; palbociclib plus mirdametinib combination therapy-sensitive – SEN). VEH control and RES tumors were harvested at terminal tumor volume, whereas SEN tumors were harvested while still responsive to therapy. One VEH sample (gray) was classified as an outlier and removed from panel B and C analyses. (B) Dot plot showing ‘Biological Processes’ enriched in SEN tumors compared to RES tumors, as indicated by GO analysis. (C) Heatmap showing relative expression of select genes in ‘Immune’ GO pathways for the tumors. SEN tumors exhibit an immune activation profile reflective of B and/or plasma cell infiltration that is absent in VEH or RES tumors. (D) CIBERSORT analyses of the RNAseq data revealing a statistically significant plasma cell signature in SEN tumors relative to VEH (P=0.04) and RES (P=0.018) tumors. P value, Student’s t-test. (E) Representative images of IHC for plasma cells (kappa light chain, left) and T cells (CD3, right) in VEH, RES and SEN tumors. Bar = 27 (left) and 270 (right) μm. Arrows highlight positively stained plasma cells and T cell clusters, asterisks denote zoomed-in regions in boxes. (F-H) Quantification of plasma cells (F), CD8+ T cell number (G), and CD8+ T cell clusters (H) per mm2 of tumor area normalized to vehicle (V). Cell numbers across each entire tumor sample were quantified. F-H: error bars, SEM; P value, One-way ANOVA with Tukey’s multiple comparisons test (*, P < 0.05; **, P < 0.01).
Figure 6.
Figure 6.
Dual CDK4/6-MEK inhibition sensitizes de novo MPNSTs to anti-PD-L1 therapy. Wild-type mice bearing de novo MPNSTs, initiated by Nf1/Ink4a/Arf editing in the sciatic nerve, were treated daily with vehicle or CDK4/6-MEK inhibitors (palbociclib at 100 mg/kg, mirdametinib at 1 mg/kg). Mice also received 2 weekly i.p. injections of IgG control or anti-PD-L1 antibodies for the first 3 weeks of therapy. (A) Tumor growth kinetics (fold change in tumor volumes) for each mouse once therapy was started. (B) Waterfall plots of fold change in tumor volumes for each group at days 10, 35 and 60 after therapy initiation. Percentages indicate surviving fraction of mice per group. Bars and circles denote surviving and non-surviving mice, respectively. (C) Time that tumors regressed per group. P < 0.0001, One-way ANOVA with Tukey’s correction comparing all groups. ****, P < 0.0001, Student’s t-test. Error Bars are SEM. Arrows, data points for mouse tissues shown in panel E. (D) Kaplan-Meier survival curve. P value, Log-Rank (Mantel-Cox) test. Mouse numbers and median survival (days) are shown for each group. (E) Images of H&E stains for harvested sciatic nerves, both CRISPR edited (Nf1/Ink4a/Arf inactivated) and contralateral controls, from 2 mice treated for 103 days (mouse A) or 102 days (mouse B) with CDK4/6-MEK inhibitors plus anti-PD-L1 therapy. Absence of tumor in subpanel ii suggests cure. *, tumor necrosis. Scale bar, 200 μm. Note: Some mice shown in panel A were euthanized early due to observed health concerns (n=4; 1 for fighting, 1 for malocclusion, 1 for constant circling behavior, 1 for hunched body), death from gavage (n=1), or to examine tumors before maximal size was reached (n=4). Those animals and any dead in pen (n=2) were excluded from panels B-D.

References

    1. Staedtke V, Bai RY, Blakeley JO. Cancer of the Peripheral Nerve in Neurofibromatosis Type 1. Neurotherapeutics 2017;14(2):298–306 doi 10.1007/s13311-017-0518-y. - DOI - PMC - PubMed
    1. Kim A, Stewart DR, Reilly KM, Viskochil D, Miettinen MM, Widemann BC. Malignant Peripheral Nerve Sheath Tumors State of the Science: Leveraging Clinical and Biological Insights into Effective Therapies. Sarcoma 2017;2017:7429697 doi 10.1155/2017/7429697. - DOI - PMC - PubMed
    1. Birdi HK, Jirovec A, Cortés-Kaplan S, Werier J, Nessim C, Diallo JS, et al. Immunotherapy for sarcomas: new frontiers and unveiled opportunities. J Immunother Cancer 2021;9(2) doi 10.1136/jitc-2020-001580. - DOI - PMC - PubMed
    1. Ayodele O, Razak ARA. Immunotherapy in soft-tissue sarcoma. Curr Oncol 2020;27(Suppl 1):17–23 doi 10.3747/co.27.5407. - DOI - PMC - PubMed
    1. Lynch MM, Alexiev BA, Schroeder BA, Pollack SM. Combinations of Chemotherapy and PD-1/PD-L1 Inhibitors in Sarcoma. Curr Treat Options Oncol 2022;23(12):1861–76 doi 10.1007/s11864-022-01036-1. - DOI - PubMed

Publication types

Substances