

Trends in Psychological Distress Among Adults in England, 2020-2022
- PMID: 37410462
- PMCID: PMC10326642
- DOI: 10.1001/jamanetworkopen.2023.21959
Trends in Psychological Distress Among Adults in England, 2020-2022
Abstract
Importance: In the last 3 years, people in England have lived through a pandemic and cost-of-living and health care crises, all of which may have contributed to worsening mental health in the population.
Objective: To estimate trends in psychological distress among adults over this period and to examine differences by key potential moderators.
Design, setting, and participants: A monthly cross-sectional, nationally representative household survey of adults aged 18 years or older was conducted in England between April 2020 and December 2022.
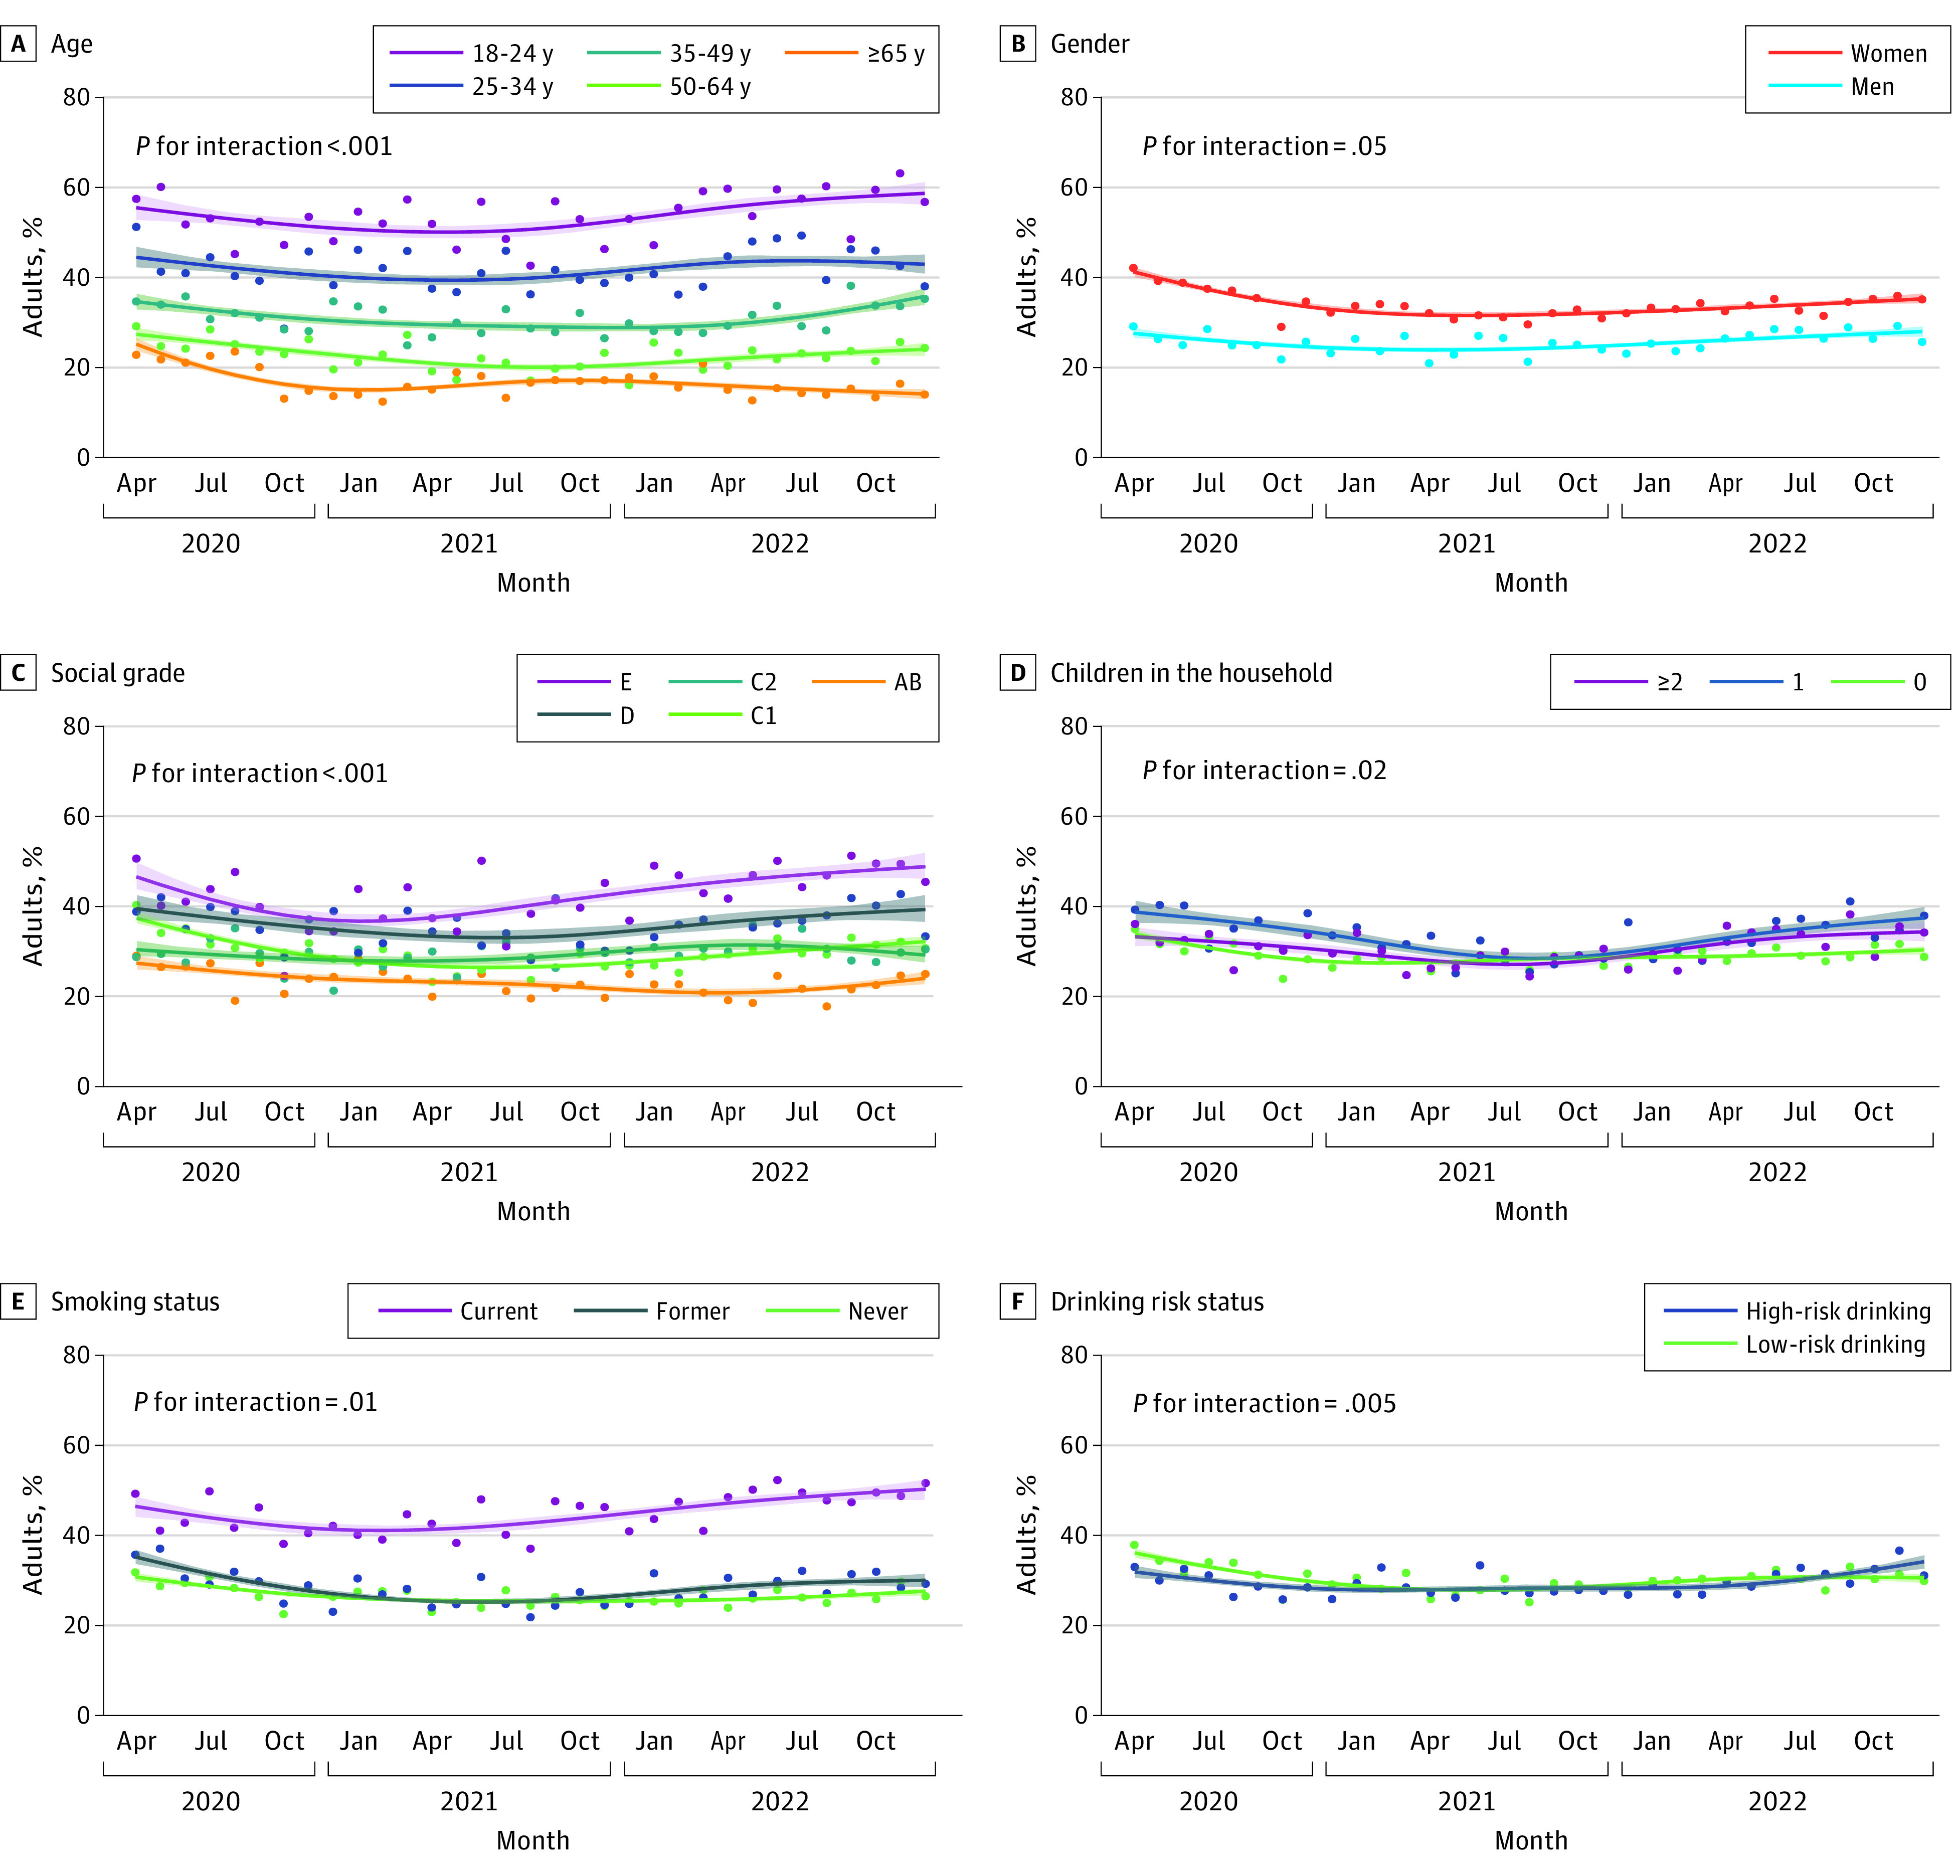
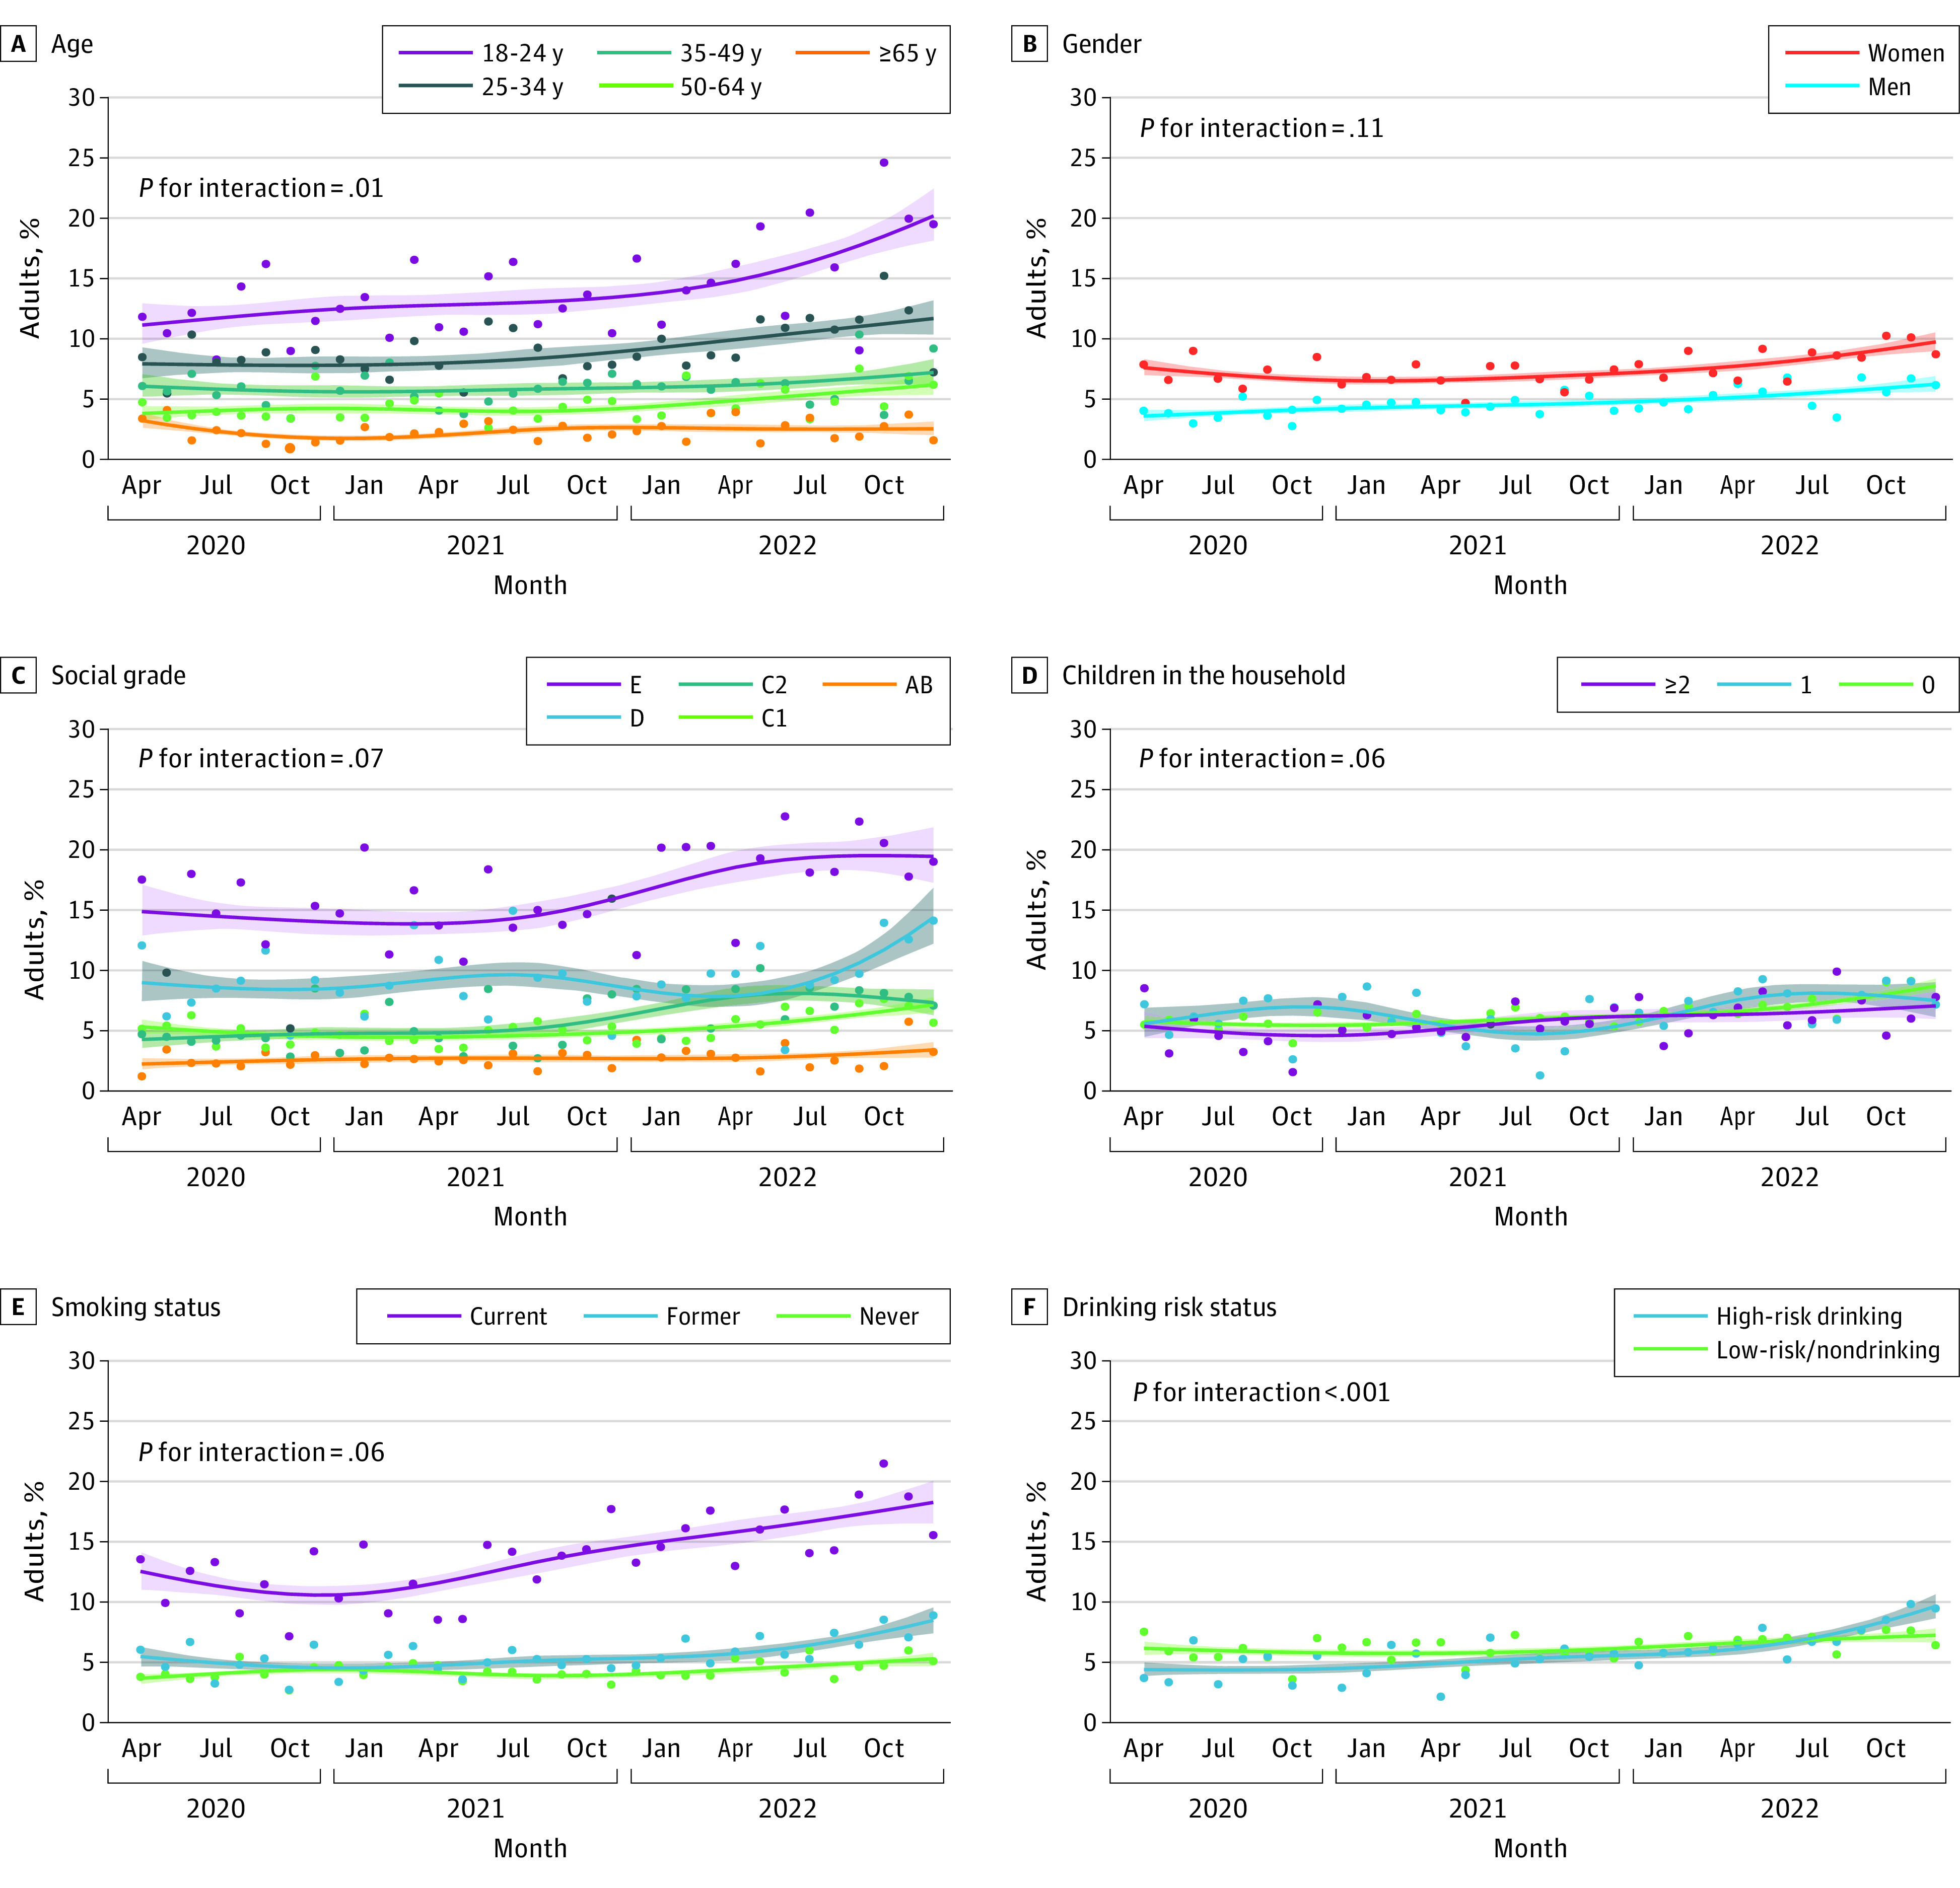
Main outcomes and measures: Past-month distress was assessed with the Kessler Psychological Distress Scale. Time trends in any distress (moderate to severe, scores ≥5) and severe distress (scores ≥13) were modeled, and interactions with age, gender, occupational social grade, children in the household, smoking status, and drinking risk status were tested.
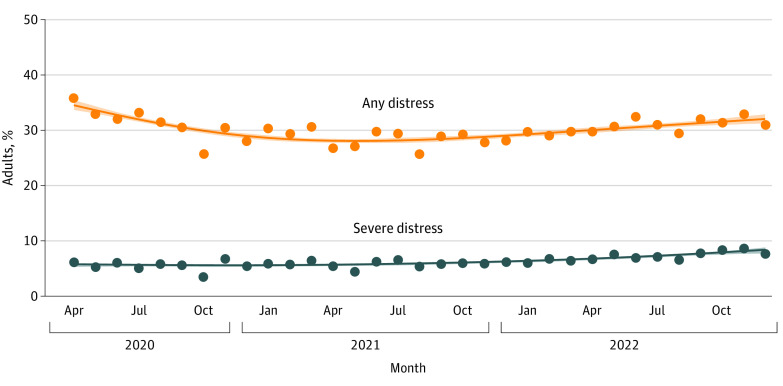
Results: Data were collected from 51 861 adults (weighted mean [SD] age, 48.6 [18.5] years; 26 609 women [51.3%]). There was little overall change in the proportion of respondents reporting any distress (from 34.5% to 32.0%; prevalence ratio [PR], 0.93; 95% CI, 0.87-0.99), but the proportion reporting severe distress increased by 46%, from 5.7% to 8.3% (PR, 1.46; 95% CI, 1.21-1.76). Although trends differed by sociodemographic characteristics, smoking, and drinking, the increase in severe distress was observed across all subgroups (with PR estimates ranging from 1.17 to 2.16), with the exception of those aged 65 years and older (PR, 0.79; 95% CI, 0.43-1.38); the increase was particularly pronounced since late 2021 among those younger than 25 years (increasing from 13.6% in December 2021 to 20.2% in December 2022).
Conclusions and relevance: In this survey study of adults in England, the proportion reporting any psychological distress was similar in December 2022 to that in April 2020 (an extremely difficult and uncertain moment of the COVID-19 pandemic), but the proportion reporting severe distress was 46% higher. These findings provide evidence of a growing mental health crisis in England and underscore an urgent need to address its cause and to adequately fund mental health services.
Conflict of interest statement
Figures
Similar articles
-
Trends in cross-border and illicit tobacco purchases among people who smoke in England, 2019-2022.Tob Control. 2024 Sep 25;33(5):688-692. doi: 10.1136/tc-2023-057991. Tob Control. 2024. PMID: 37463758 Free PMC article.
-
Psychological Distress Before and During the COVID-19 Pandemic Among Adults in the United Kingdom Based on Coordinated Analyses of 11 Longitudinal Studies.JAMA Netw Open. 2022 Apr 1;5(4):e227629. doi: 10.1001/jamanetworkopen.2022.7629. JAMA Netw Open. 2022. PMID: 35452109 Free PMC article.
-
Trends in Exclusive Non-Cigarette Tobacco Smoking in England: A Population Survey 2013-2023.Nicotine Tob Res. 2025 Jan 22;27(2):342-350. doi: 10.1093/ntr/ntae021. Nicotine Tob Res. 2025. PMID: 38439612 Free PMC article.
-
Folic acid supplementation and malaria susceptibility and severity among people taking antifolate antimalarial drugs in endemic areas.Cochrane Database Syst Rev. 2022 Feb 1;2(2022):CD014217. doi: 10.1002/14651858.CD014217. Cochrane Database Syst Rev. 2022. PMID: 36321557 Free PMC article.
-
Moderators of changes in smoking, drinking and quitting behaviour associated with the first COVID-19 lockdown in England.Addiction. 2022 Mar;117(3):772-783. doi: 10.1111/add.15656. Epub 2021 Aug 25. Addiction. 2022. PMID: 34431577 Free PMC article.
Cited by
-
Trends in long term vaping among adults in England, 2013-23: population based study.BMJ. 2024 Jul 17;386:e079016. doi: 10.1136/bmj-2023-079016. BMJ. 2024. PMID: 39019543 Free PMC article.
-
Past trends and future projections of psychological distress among general population in Finland.BMJ Public Health. 2025 Aug 11;3(2):e002026. doi: 10.1136/bmjph-2024-002026. eCollection 2025. BMJ Public Health. 2025. PMID: 40820995 Free PMC article.
-
Evaluating the Well-Being Benefits and Social Value of Volunteer Gardening: Health Economics Meets Behavioral Science.Behav Sci (Basel). 2024 Dec 21;14(12):1233. doi: 10.3390/bs14121233. Behav Sci (Basel). 2024. PMID: 39767374 Free PMC article.
References
-
- The Institute for Government . Cost of living crisis. February 7, 2022. Accessed June 1, 2023. https://www.instituteforgovernment.org.uk/explainers/cost-living-crisis
-
- House of Lords Public Services Committee . Emergency healthcare: a national emergency. January 19, 2023. Accessed June 1, 2023. https://publications.parliament.uk/pa/ld5803/ldselect/pubserv/130/130.pdf
Publication types
MeSH terms
Grants and funding
LinkOut - more resources
Full Text Sources
Medical
Research Materials
Miscellaneous
