. 2023 Jul 3;23(7):5.
doi: 10.1167/jov.23.7.5.

Serial dependence improves performance and biases confidence-based decisions

Affiliations

Serial dependence improves performance and biases confidence-based decisions

Paula A Maldonado Moscoso et al. J Vis. .

Erratum in

Abstract

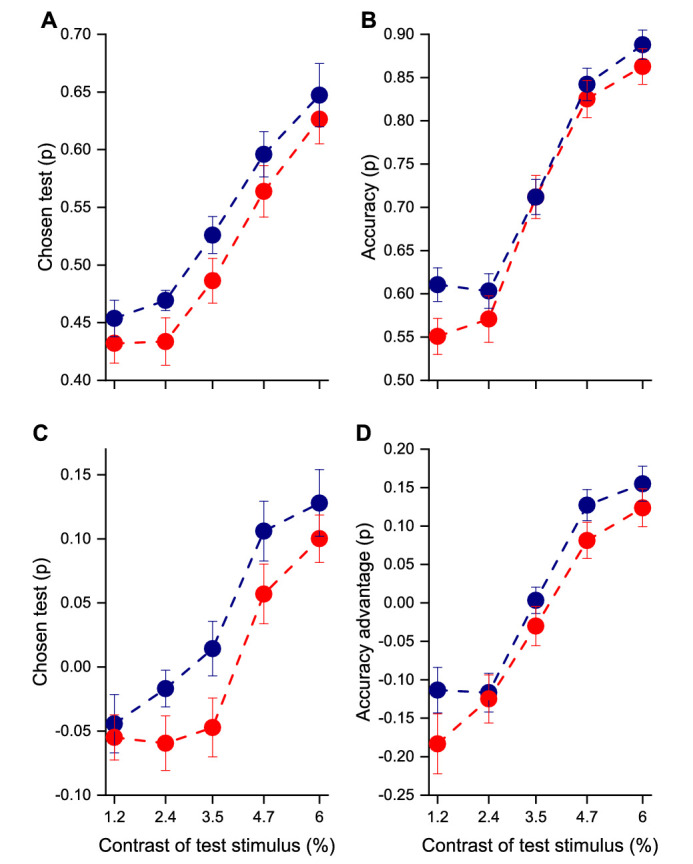
Perception depends on both the current sensory input and on the preceding stimuli history, a mechanism referred to as serial dependence (SD). One interesting, and somewhat controversial, question is whether serial dependence originates at the perceptual stage, which should lead to a sensory improvement, or at a subsequent decisional stage, causing solely a bias. Here, we studied the effects of SD in a novel manner by leveraging on the human capacity to spontaneously assess the quality of sensory information. Two noisy-oriented Gabor stimuli were simultaneously presented along with two bars of the same orientation as the Gabor stimuli. Participants were asked to choose which Gabor stimulus to judge and then make a forced-choice judgment of its orientation by selecting the appropriate response bar. On all trials, one of the Gabor stimuli had the same orientation as the Gabor in the same position on the previous trial. We explored whether continuity in orientation and position affected choice and accuracy. Results show that continuity of orientation leads to a persistent (up to four back) accuracy advantage and a higher preference in the selection of stimuli with the same orientation, and this advantage accumulates over trials. In contrast, analysis of the continuity of the selected position indicated that participants had a strong tendency to choose stimuli in the same position, but this behavior did not lead to an improvement in accuracy.


Figures

Figure 1.
Figure 1.
Event sequence and example of stimuli. (A) On each trial, two Gabor patches and two white bars were presented, all centered 7.3° from the central fixation point, as shown. Participants selected first the Gabor patch they felt more confident in judging orientation, then which white bar had the same orientation as the selected Gabor patch. After each trial, participants received true visual feedback. (B) Example of the four orientations for Gabor patches with 6% of contrast. (C) Example of trial sequence. On each trial, one of the Gabor patches had the same orientation and the same position as the Gabor patch in the previous trial. The rings highlight the continuous Gabor patches across trials.
Figure 2.
Figure 2.
(A) Psychophysical functions showing the proportion of times participants chose the test stimulus over the standard. (B) Accuracy of the chosen stimulus as a function of the contrast of the test stimulus. (C) Psychophysical functions showing the participants’ bias for chosen test over the standard (after subtracting out the effect with shuffled data). (D) Accuracy advantage of the chosen stimulus as a function of the contrast of the test stimulus. In all graphs, the blue symbols indicate same orientation and red different orientation. Error bar represents ±1 SEM.
Figure 3.
Figure 3.
The effect of continuity of orientation on stimulus choice and accuracy. (A) Illustration of a typical stimulus sequence showing an example where the orientation was the same five trials back. (B) Orientation choice bias separated into trials that were either the same or different N trials back. (C) Accuracy for the same conditions. (D) Orientation choice bias as a function of the cumulative number of N-back for trials that were all either the same or different. Black-dashed lines represent the cumulative prediction from the data of Figure 3B. (E) Accuracy as a function of the cumulative number of N-back for the same conditions. Black-dashed lines represent the cumulative prediction from the data of Figure 3C. (F) Accuracy as a function of orientation choice bias, averaged over trials and participants from one-back to five-back. In all graphs, the results of trials classified as different orientations compared with the current selection are represented in red and the same orientations in blue. Blue and red dashed lines show the prediction from shuffled data. Error bar represents ±1 SEM. Statistical significance: *p < 0.05; **p < 0.01; ***p < 0.001.
Figure 4.
Figure 4.
Accuracy as a function of orientation choice bias (tendency to prefer continuous stimuli) for individual participants. The red line shows the best linear fit, which was significant with moderate Bayes factor evidence (r = 0.48, p = 0.029, logBF = 0.5). The rectangles show the average for participants with negative and positive orientation choice bias. Those with positive choice bias were more accurate, by 4% on average, t(14) = 1.92, p = 0.038, logBF = 0.4.
Figure 5.
Figure 5.
(A) Example of classification of the trials with different (red) and same (blue) “physical position selected” compared with the current selection. (B) Position choice bias for trials of the same (blue) or different (red) position as the trial N-back (raw data). The dashed line shows the average orientation bias with permutated data, where the responses within each session were randomly shuffled (average of 10,000 repetitions). (C) Same as (B) but for accuracy. (D) Position choice bias (with expanded ordinate) for trials of the same (blue) or different (red) position as the trial N-back after subtracting out the effect with permutated data. (E) Same as (D) but for accuracy advantage. (F) Top response bias of all participants. (G) Accuracy advantage as a function of orientation choice bias, averaged over trials and participants from one-back to five-back (after removing the effect with permutated data). The black line represents the best-fitting linear regression. Error bar represents ±1 SEM. Statistical significance: *p < 0.05; ***p < 0.001.
Figure 6.
Figure 6.
Bar graphs showing the accuracy advantage for the condition where participants chose a stimulus where the previous trial (one-back) was a Gabor patch with different orientation and different position (orange bar), different orientation and the same position (red bar), or the same orientation and same position (blue bar). Error bar represents ±1 SEM.

Similar articles

Cited by

References

    1. Barthelmé, S., & Mamassian, P. (2009). Evaluation of objective uncertainty in the visual system. PLoS Computational Biology, 5(9), e1000504, 10.1371/journal.pcbi.1000504. - DOI - PMC - PubMed
    1. Bliss, D. P., Sun, J. J., & D'Esposito, M. (2017). Serial dependence is absent at the time of perception but increases in visual working memory. Scientific Reports, 7(1), 14739, 10.1038/s41598-017-15199-7. - DOI - PMC - PubMed
    1. Brainard, D. H. (1997). The Psychophysics Toolbox. Spatial Vision, 10(4), 433–436, 10.1163/156856897X00357. - DOI - PubMed
    1. Ceylan, G., Herzog, M. H., & Pascucci, D. (2021). Serial dependence does not originate from low-level visual processing. Cognition, 212, 104709, 10.1016/j.cognition.2021.104709. - DOI - PubMed
    1. Cicchini, G. M., Anobile, G., & Burr, D. C. (2014). Compressive mapping of number to space reflects dynamic encoding mechanisms, not static logarithmic transform. Proceedings of the National Academy of Sciences, USA. 111(21), 7867–7872, 10.1073/pnas.1402785111. - DOI - PMC - PubMed

Publication types