. 2023 Aug 8;8(15):e162547.
doi: 10.1172/jci.insight.162547.

α7nAChR activation in AT2 cells promotes alveolar regeneration through WNT7B signaling in acute lung injury

Affiliations

α7nAChR activation in AT2 cells promotes alveolar regeneration through WNT7B signaling in acute lung injury

Xiaoyan Chen et al. JCI Insight. .

Abstract

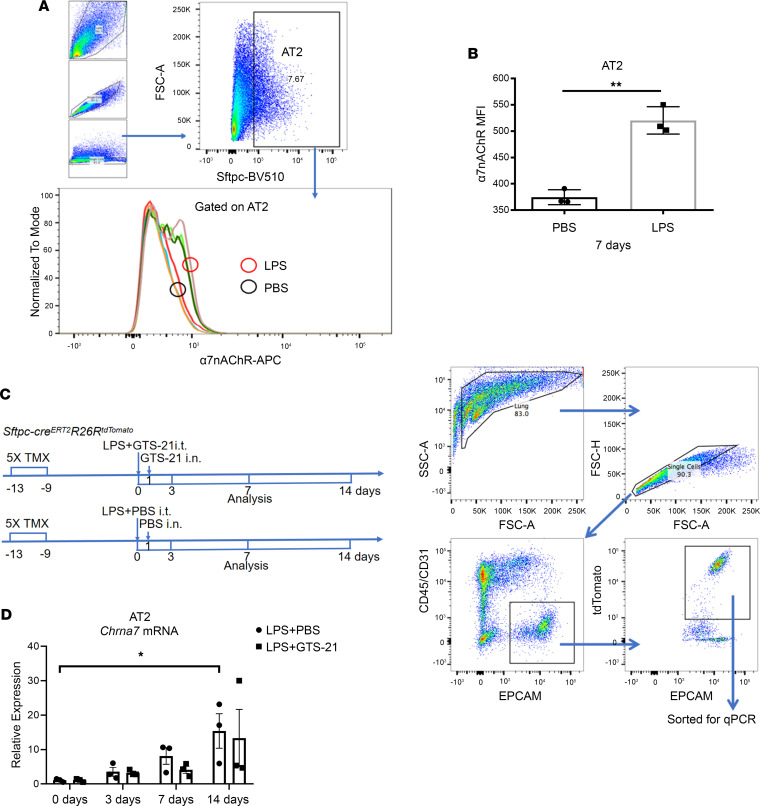
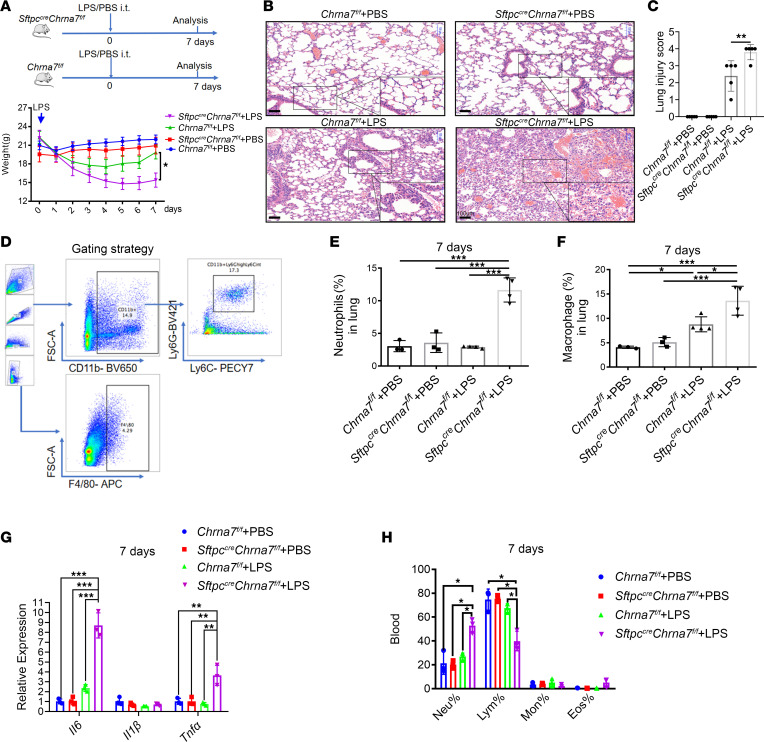
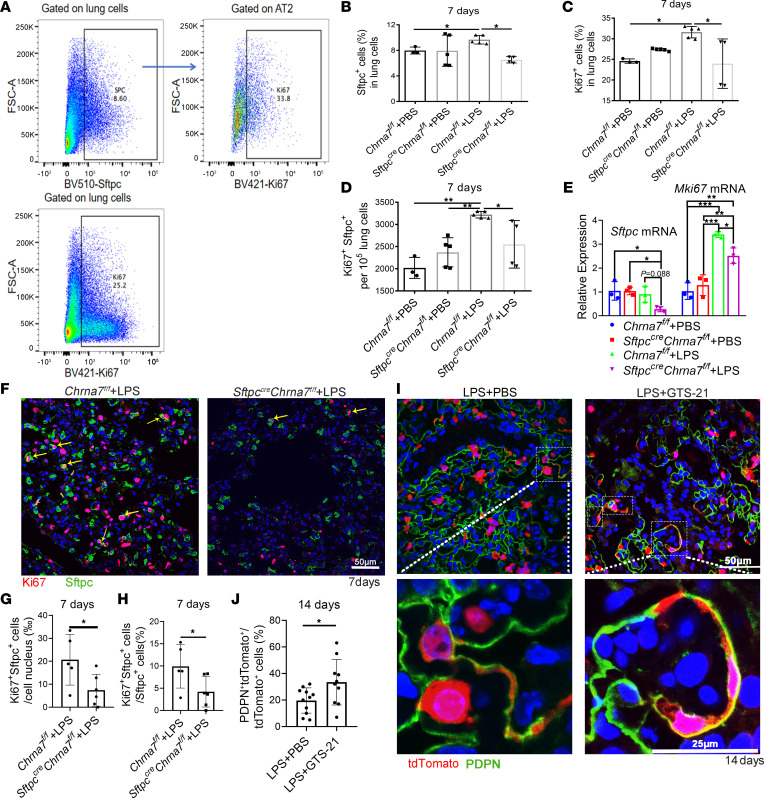
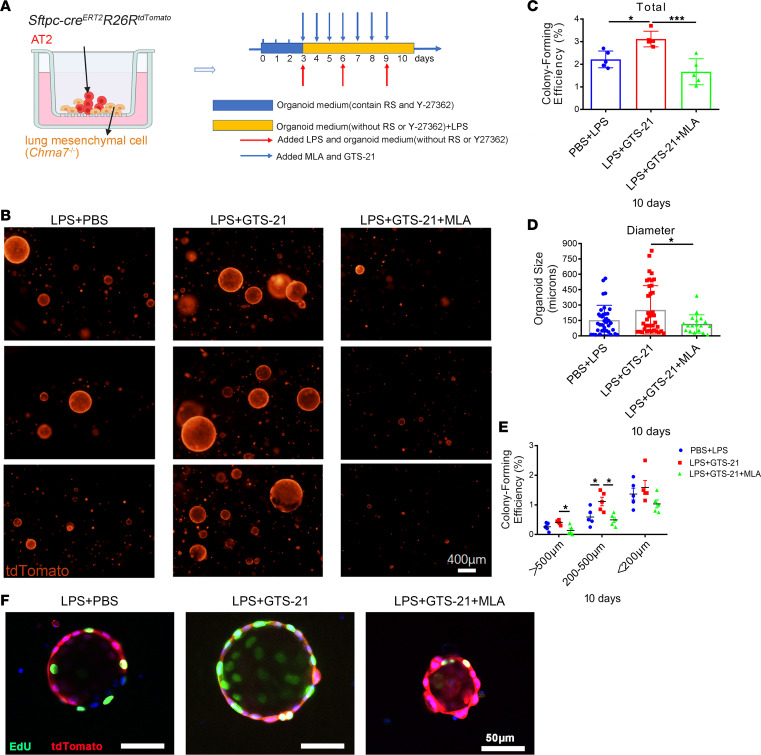
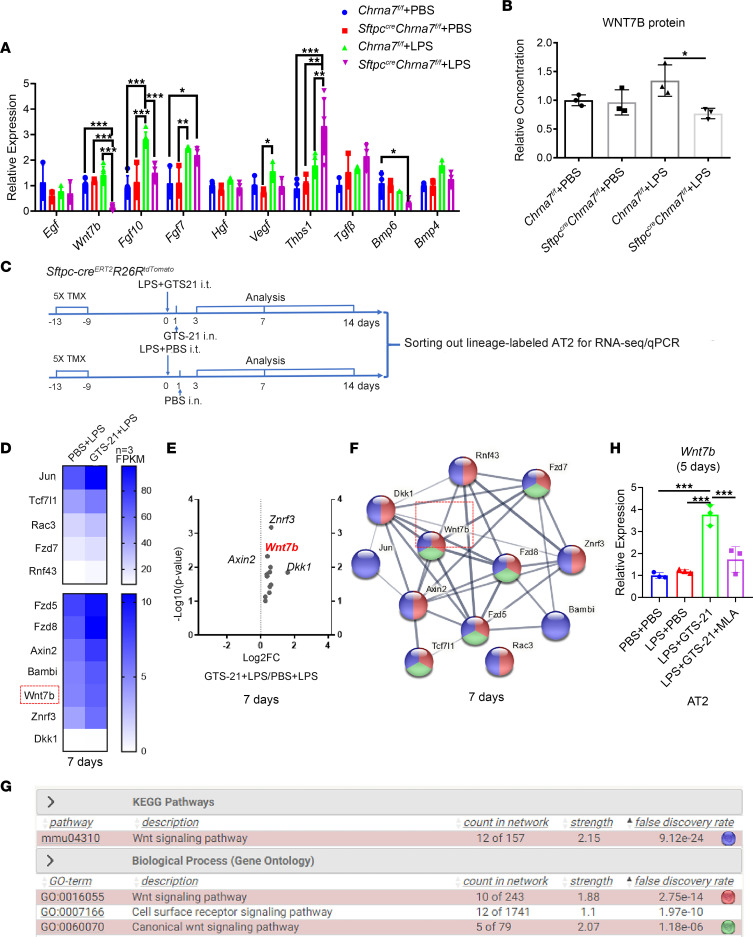
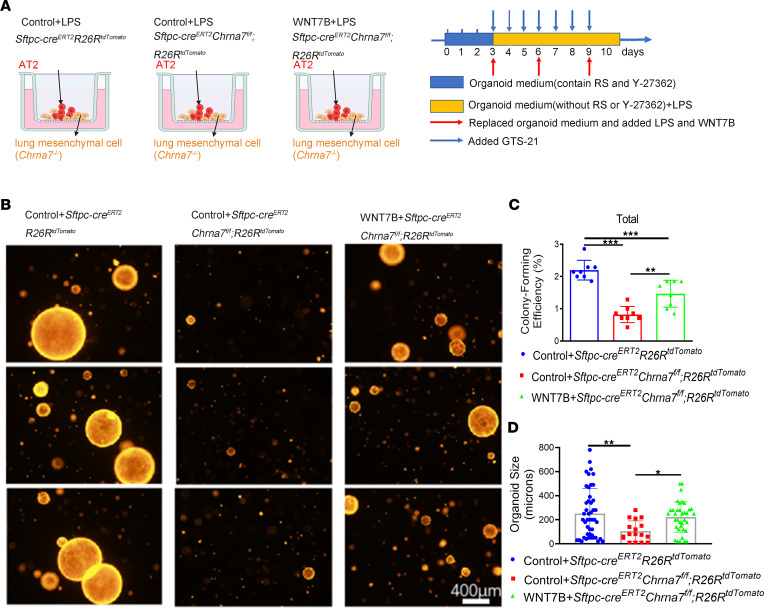
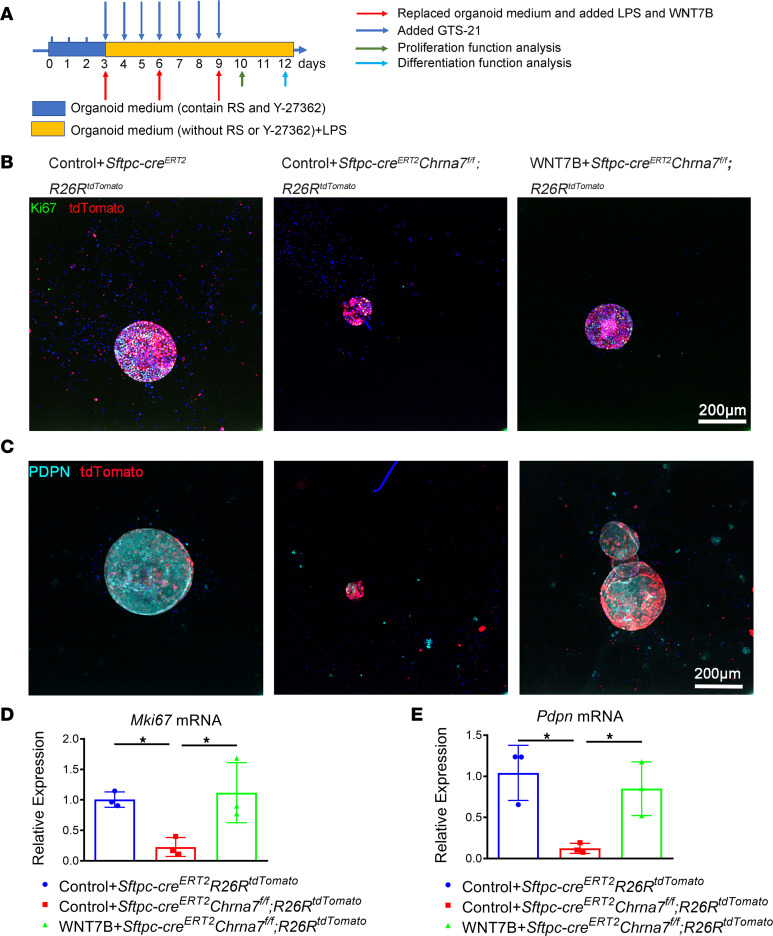
Reducing inflammatory damage and improving alveolar epithelium regeneration are two key approaches to promoting lung repair in acute lung injury/acute respiratory distress syndrome (ALI/ARDS). Stimulation of cholinergic α7 nicotinic acetylcholine receptor (α7nAChR, coded by Chrna7) signaling could dampen lung inflammatory injury. However, whether activation of α7nAChR in alveolar type II (AT2) cells promotes alveolar epithelial injury repair and underlying mechanisms is elusive. Here, we found that α7nAChR was expressed on AT2 cells and was upregulated in response to LPS-induced ALI. Meanwhile, deletion of Chrna7 in AT2 cells impeded lung repair process and worsened lung inflammation in ALI. Using in vivo AT2 lineage-labeled mice and ex vivo AT2 cell-derived alveolar organoids, we demonstrated that activation of α7nAChR expressed on AT2 cells improved alveolar regeneration by promoting AT2 cells to proliferate and subsequently differentiate toward alveolar type I cells. Then, we screened out the WNT7B signaling pathway by the RNA-Seq analysis of in vivo AT2 lineage-labeled cells and further confirmed its indispensability for α7nAChR activation-mediated alveolar epithelial proliferation and differentiation. Thus, we have identified a potentially unrecognized pathway in which cholinergic α7nAChR signaling determines alveolar regeneration and repair, which might provide us a novel therapeutic target for combating ALI.

Keywords: Adult stem cells; Pulmonology; Respiration; Stem cells.


Figures

Figure 1
Figure 1. LPS upregulates the expression of α7nAChR on AT2 cells.
(A) The flow cytometric gating strategy for detecting the α7 nicotinic acetylcholine receptor (α7nAChR) protein on alveolar type II (AT2) cells using fluorochrome-conjugated α-bungarotoxin, a nicotinic cholinergic blocker. PBS or LPS (2.5 mg/kg) was intratracheally delivered to mice and was followed for 7 days. As shown in the Figure, AT2 cells account for about 7.67% in all lung cells in this indicated sample. (B) Median fluorescence intensity (MFI) of α7nAChR protein on AT2 cells (2-sided t test). (C) Intervention schematic diagram and sorting strategy for lineage-labeled AT2 cells by flow cytometry at indicated time points. PBS, LPS (2.5 mg/kg), or GTS-21 (α7nAChR selective agonist, 4 mg/kg) was intratracheally delivered to lineage-tracing mice (Sftpc-creERT2R26RtdTomato), followed by intranasal administration of PBS or GTS-21 on day 1. Lineage-labeled AT2 cells were sorted, and the expression of α7nAChR (Chrna7) was quantified at the mRNA level by quantitative real-time PCR (qPCR) at the 0th, 3rd, 7th, and 14th day. Specific time points for tamoxifen (TMX) injection are indicated. (D) Chrna7 gene expression in AT2 cells (1-way ANOVA with Tukey’s post hoc analysis). Data are representative of at least 3 independent experiments and are presented as mean ± SD (N = 3; *P < 0.05, **P < 0.01).
Figure 2
Figure 2. Deletion of Chrna7 on AT2 cells impedes the lung repair process and increases lung proinflammatory responses after lung injury.
(A) PBS or LPS (2.5 mg/kg) was intratracheally (i.t.) delivered to SftpccreChrna7fl/fl mice or Chrna7fl/fl mice and was followed for 7 days. Changes in mice body weight in the Chrna7fl/fl+PBS, Chrna7fl/fl+LPS, SftpccreChrna7fl/fl+PBS, or SftpccreChrna7fl/fl+LPS groups (2-way ANOVA with Šidák’s post hoc analysis). (B) Representative H&E-stained lung sections on day 7 after injury. Insets show high-power images. Scale bars: 100 μm. (C) Lung injury score. (D) Flow cytometric gating strategy for neutrophils and macrophages in lung. (E) The percentage of neutrophils (CD11b+Ly6GhiLy6Cintermediate cells) in lung was determined by flow cytometry on day 7 after injury. (F) The percentage of macrophages (F4/80+ cells) in lung was determined by flow cytometry on day 7 after injury. (G) The relative gene expression of Il6, Il1β, and Tnfα in lung tissue homogenate was tested by qPCR on day 7 after injury. (H) The percentage of neutrophils (Neu), lymphocytes (Lym), monocytes (Mon), and eosinophils (Eos) in the blood was determined using a multispecies hematology instrument on day 7 after injury. One-way ANOVA with Tukey’s post hoc analysis was used in C and EH. Data are representative of at least 3 independent experiments and are presented as mean ± SD (N = 3–5; *P < 0.05, **P < 0.01, ***P < 0.001).
Figure 3
Figure 3. α7nAChR expressed on AT2 cells is required for alveolar regeneration in vivo.
(A) PBS or LPS (2.5 mg/kg) was intratracheally delivered to SftpccreChrna7fl/fl mice or Chrna7fl/fl mice and was followed for 7 days. The flow cytometric gating strategy for detecting Sftpc+ cells (AT2 cells), Ki67+ cells (proliferating cells), and Sftpc+Ki67+ cells (proliferating AT2 cells). (B) The percentage of Sftpc+ cells in mouse lung. (C) The percentage of Ki67+ cells in mouse lung. (D) The number of Sftpc+Ki67+ cells per 105 lung cells. (E) The relative gene expression of Sftpc and Mki67 in lung tissue homogenate was tested by qPCR. (F) Representative immunofluorescence (IF) images showing Sftpc+ cells, Ki67+ cells, and Sftpc+Ki67+ cells in the lungs of SftpccreChrna7/f mice treated with LPS or Chrna7fl/fl mice treated with LPS on day 7 after injury (Ki67, red; Sftpc, green; DAPI, blue). Arrows indicate Sftpc+Ki67+ cells. Scale bars: 50 μm. (G and H) Quantification of Ki67+Sftpc+ cells in F. Each individual dot represents 1 section. (I) Representative IF images showing podoplanin+ (PDPN+) AT1 cell differentiation from Sftpc lineage–labeled cells on day 14 after injury in the lungs of indicated groups (tdTomato, red; PDPN, green; DAPI, blue). Scale bars: 50 μm. (J) Quantification of lineage-labeled PDPN+ AT1 cells in H. Each individual dot represents 1 section. One-way ANOVA with Tukey’s post hoc analysis was used in BE. Two-sided t test was used in G, H, and J. Data are representative of at least 3 independent experiments and are presented as mean ± SD (N = 3–5; *P < 0.05, **P < 0.01, ***P < 0.001).
Figure 4
Figure 4. Activation of α7nAChR on AT2 cells promotes alveolar organoid formation.
(A) Schematic of organoid coculture of Sftpc lineage–labeled cells (CD45CD31EPCAM+tdTomato+) with lung mesenchymal cells (CD45CD31EPCAM) isolated from α7nAChR-knockout (Chrna7–/–) mice and the intervention diagram; LPS (1 μg/mL) was added to simulate lung injury in vitro and methyllycaconitine citrate (MLA; α7nAChR antagonist, 10 μmol/L) 15 minutes before GTS-21 (selective α7nAChR agonist, 10 μmol/L) treatment. Times for renewing organoid medium and adding LPS, GTS-21, and MLA are indicated. The culture time varies in different experiments according to purpose. RS, R-Spondin-1. (B) Representative fluorescence images of AT2 organoids captured on day 10. Scale bars: 400 μm. (C) Statistical quantification of the total colony formation efficiency of alveolar organoids. Each individual dot represents 1 experiment in 1 mouse. (D) Statistical quantification of the size of alveolar organoids. Each individual dot represents 1 organoid. (E) Statistical quantification of total colony formation efficiency of alveolar organoids of different sizes. (F) Representative fluorescence images showing proliferating cells in AT2 organoids derived from the lungs of lineage-tracing mice. Organoids were treated with 5-ethynyl-2′-deoxyuridine (EdU) at an early time point (day 8) for 3 hours in cultures (tdTomato, red; EdU, green; DAPI, blue). Scale bars: 50 μm. One-way ANOVA with Tukey’s post hoc analysis was used in CE. Data are representative of at least 3 independent experiments and are presented as mean ± SD (*P < 0.05, ***P < 0.001).
Figure 5
Figure 5. Vagal-7nAChR signaling upregulates canonical WNT7B signaling in AT2 cells during LPS-induced lung injury.
(A and B) PBS or LPS (2.5 mg/kg) was intratracheally delivered to SftpccreChrna7fl/fl mice or Chrna7fl/fl mice and was followed for 7 days (N = 3–5 in each group). (A) qPCR analysis of genes that are key growth factors for lung regeneration in the lung tissue. (B) Statistical quantification of the relative concentration of wingless-type MMTV integration site family, member 7B (WNT7B) protein in the lung tissue tested by ELISA. (C) PBS, LPS (2.5 mg/kg), or GTS-21 (α7nAChR selective agonist, 4 mg/kg) was intratracheally (i.t.) delivered to lineage-tracing mice (Sftpc-creERT2R26RtdTomato) followed by PBS or GTS-21 intranasal administration (i.n.) at the 1st day, and Sftpc lineage–labeled cells were sorted for RNA-Seq and qPCR analysis. Specific time points for tamoxifen (TMX) injection and analysis are indicated (N = 3 in each group). (D) Heatmap of the transcriptional profiles of Wnt7b and other related genes in AT2 cells on day 7. (E) Volcano plot analysis of gene changes presented in D. (F) Protein interaction network among genes presented in D. (G) KEGG pathway and GO analysis of Wnt7b and other related genes presented in D. (H) AT2 cells were purified by FACS and then treated with PBS, LPS (1 μg/mL), GTS-21 (10 μmol/L), or MLA (10 μmol/L) in vitro, and the gene expression of Wnt7b was quantified by qPCR on day 5. One-way ANOVA with Tukey’s post hoc analysis was used in A, B, and H. Data are representative of at least 3 independent experiments and are presented as mean ± SD (*P < 0.05, **P < 0.01, ***P < 0.001).
Figure 6
Figure 6. α7nAChR-driven WNT7B signaling is an essential mediator of α7nAChR-promoted alveolar organoid formation.
(A) Schematic of organoid coculture of Sftpc lineage–labeled AT2 cells (CD45CD31EPCAM+tdTomato+) isolated from indicated mice, with lung mesenchymal cells (CD45CD31EPCAM) isolated from α7nAChR-knockout (Chrna7–/–) mice, and the intervention diagram. (B) Representative IF images of AT2 organoids. LPS (1 μg/mL) was added to simulate lung injury in vitro, and GTS-21(10 μmol/L) was used to activate α7nAChR in all groups. WNT7B (100 ng/mL) was added as indicated. Scale bars: 400 μm. (C) Statistical quantification of the total colony formation efficiency of alveolar organoids. Each individual dot represents 1 experiment. (D) Statistical quantification of the size of alveolar organoids. Each individual dot represents 1 organoid. One-way ANOVA with Tukey’s post hoc analysis was used in C and D. Data are representative of at least 3 independent experiments and are presented as mean ± SD (*P < 0.05, **P < 0.01, ***P < 0.001).
Figure 7
Figure 7. α7nAChR-driven WNT7B signaling is integral for α7nAChR-promoted AT2 cell proliferation and differentiation.
(A) Schematic of organoid coculture of Sftpc lineage–labeled cells (CD45CD31EPCAM+tdTomato+) isolated from indicated mice, with lung mesenchymal cells (CD45CD31EPCAM) isolated from α7nAChR-knockout (Chrna7–/–) mice, and the intervention diagram. (B) Effect of selective knockout of α7nAChR on AT2 cells and supplementation of WNT7B (100 ng/mL) on the proliferation of lineage-traced AT2 cells in organoids on day 10, as judged by Ki67 (proliferative marker) (tdTomato, red; Ki67, green; DAPI, blue). Scale bars: 200 μm. (C) Effect of selective knockout of α7nAChR on AT2 cells and supplementation of WNT7B (100 ng/mL) on the differentiation of lineage-traced AT2 cells in organoids on day 12, as judged by PDPN (AT1 marker) (tdTomato, red; PDPN, cyan; DAPI, blue). Scale bars: 200 μm. (D) qPCR analysis of Mki67 from mouse AT2 organoids. (E) qPCR analysis of Pdpn from mouse AT2 organoids. One-way ANOVA with Tukey’s post hoc analysis was used in D and E. Data are presented as mean ± SD (*P < 0.05).

Similar articles

Cited by

References

    1. Ware LB, Matthay MA. The acute respiratory distress syndrome. N Engl J Med. 2000;342(18):1334–1349. doi: 10.1056/NEJM200005043421806. - DOI - PubMed
    1. Wang H, et al. Nicotinic acetylcholine receptor alpha7 subunit is an essential regulator of inflammation. Nature. 2003;421(6921):384–388. doi: 10.1038/nature01339. - DOI - PubMed
    1. D’Andrea MR, Nagele RG. Targeting the alpha 7 nicotinic acetylcholine receptor to reduce amyloid accumulation in Alzheimer’s disease pyramidal neurons. Curr Pharm Des. 2006;12(6):677–684. doi: 10.2174/138161206775474224. - DOI - PubMed
    1. Martin L, et al. Alpha-7 nicotinic receptor agonists: potential new candidates for the treatment of schizophrenia. Psychopharmacology (Berl) 2004;174(1):54–64. doi: 10.1007/s00213-003-1750-1. - DOI - PubMed
    1. Koopman FA, et al. Vagus nerve stimulation inhibits cytokine production and attenuates disease severity in rheumatoid arthritis. Proc Natl Acad Sci U S A. 2016;113(29):8284–8289. doi: 10.1073/pnas.1605635113. - DOI - PMC - PubMed

Publication types

MeSH terms

Substances