Review
. 2023 Aug 7;155(8):e202313380.
doi: 10.1085/jgp.202313380. Epub 2023 Jul 6.

Fifty years of gating currents and channel gating

Affiliations
Review

Fifty years of gating currents and channel gating

Luigi Catacuzzeno et al. J Gen Physiol. .

Abstract

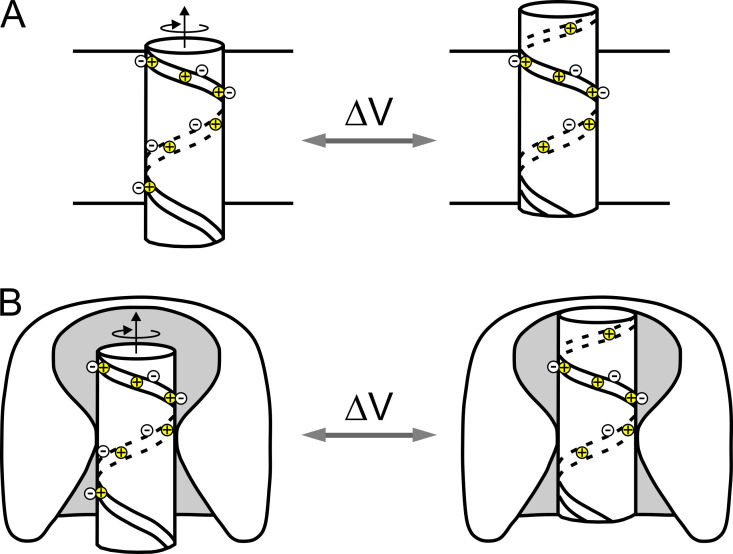
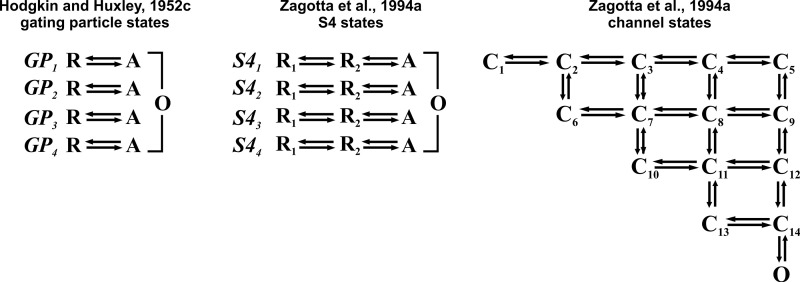
We celebrate this year the 50th anniversary of the first electrophysiological recordings of the gating currents from voltage-dependent ion channels done in 1973. This retrospective tries to illustrate the context knowledge on channel gating and the impact gating-current recording had then, and how it continued to clarify concepts, elaborate new ideas, and steer the scientific debate in these 50 years. The notion of gating particles and gating currents was first put forward by Hodgkin and Huxley in 1952 as a necessary assumption for interpreting the voltage dependence of the Na and K conductances of the action potential. 20 years later, gating currents were actually recorded, and over the following decades have represented the most direct means of tracing the movement of the gating charges and gaining insights into the mechanisms of channel gating. Most work in the early years was focused on the gating currents from the Na and K channels as found in the squid giant axon. With channel cloning and expression on heterologous systems, other channels as well as voltage-dependent enzymes were investigated. Other approaches were also introduced (cysteine mutagenesis and labeling, site-directed fluorometry, cryo-EM crystallography, and molecular dynamics [MD] modeling) to provide an integrated and coherent view of voltage-dependent gating in biological macromolecules. The layout of this retrospective reflects the past 50 years of investigations on gating currents, first addressing studies done on Na and K channels and then on other voltage-gated channels and non-channel structures. The review closes with a brief overview of how the gating-charge/voltage-sensor movements are translated into pore opening and the pathologies associated with mutations targeting the structures involved with the gating currents.


Conflict of interest statement

Disclosures: The authors declare no competing interests exist.

Figures

Figure 1.
Figure 1.
Hodgkin and Huxley’s charged gating particles. (A–C) Sketch illustrating the membrane relocation of the three-activating charged gating particles of Na channel upon membrane depolarization and repolarization. (D) Time courses of gating particles’ translocation (red trace) and Na currents (green trace) obtained using Eqs. 5 and 6 of Box 1 for the activation phase, and Eqs. 7 and 8 for the deactivation phase, respectively, considering three activation particles and one inactivation particle. (E) Theoretical voltage dependence of charged gating particles translocation, Q(V), and channel conductance, G(V), for a voltage-gated ion channel, obtained using Eqs. 9 and 10 of Box 1, respectively.
Figure 2.
Figure 2.
Gating current recordings. (A and B) Turn-on and turn-off of Na gating currents (top) and Na ion current (bottom) in response to a depolarizing step to 0 mV. The gating currents and the ion currents are from different axons (from Armstrong and Bezanilla, 1973). (C) Relation of the normalized charge vs. potential (Q(V)) and conductance vs. potential (G(V)) for the bacterial Na channel, NaChBac (from Kuzmenkin et al., 2004).
Figure 3.
Figure 3.
Immobilization of the gating charges. (A) The OFF-gating charge of the Na channel gets immobilized with long pulses. (B) The OFF-gating charge of the Na channel gets immobilized (circles) with long pulses in parallel with channel inactivation (line) (from Armstrong and Bezanilla, 1977).
Scheme 1.
Scheme 1.
Kinetic scheme of Na channel gating. The kinetic scheme shows that inactivation can be reached from a closed state as well as from the open state (from Vandenberg and Bezanilla, 1991a).
Figure 4.
Figure 4.
The sliding helix model. (A) Schematic of the sliding helix or helical screw model of channel gating as proposed by Catterall (1986) and Guy and Seetharamulu (1986), suggesting that the positive charges (mostly arginine), arranged in a spiral shape, pull the S4 segment inward at the negative potential of the resting state. Upon depolarization, the inward-directed forces are released and the S4 segments are pushed outwards following a spiral path which allows the positive charges to pair in succession with the negatively charged residues on neighboring transmembrane segments (from Catterall, 1986). (B) Evolution of the sliding-helix model to include the focused electric field and the water-filled vestibules on the extracellular and intracellular sides (modified from Catterall, 2000).
Figure 5.
Figure 5.
Native Na gating currents display a fast and a slow decay component. Fitting the gating current with a single exponential between the two indicated arrowheads uncovers a much slower component that develops over several ms and bore significant charge. Tetrodotoxin (TTX) was added to the artificial sea water (SW) that contained only 20% of natural Na concentration. The ion current, shown by the downward trace, was obtained in a separate experiment on the same axon, under similar conditions as those used for recording the gating current, except for the absence of external TTX. (from Armstrong and Bezanilla, 1977). Inset: Time courses of the fluorescence changes for each of the four S4 segments (from domains I–IV) of the Na channel expressed in Xenopus oocytes (from Chanda and Bezanilla, 2002).
Scheme 2.
Scheme 2.
Kinetic models of gating. Left: Hodgkin and Huxley’s model of the two-step charged gating particles translocation to open the K channel. GP, gating particles; R, resting; A, activated. Center and right: Gating models of Shaker consistent with a full set of experimental data showing conformational states of each of the four voltage sensors (S4) and the conformational states of the channel, respectively (from Zagotta et al., 1994a).
Figure 6.
Figure 6.
Gating current fluctuations from our Brownian model. (A) Total energy profile. (B) Plots of the mean current and variance. Microscopic currents in response to a depolarizing pulse to 0 mV were simulated 10,000 times, filtered with an eight-pole Bessel filter at a cutoff frequency of 8 kHz, and the resulting mean and variance assessed. (C) Plot of variance vs. mean current obtained from the energy profile of A. The solid line represents the best fit of the simulated data from the decaying part of the gating current using an equation derived from a single-step theoretical model of shot currents. The resulting apparent charge qapp is 2.1e0 (from Catacuzzeno et al., 2021a).
Figure 7.
Figure 7.
Evidence for multicharge steps from a Brownian model of gating. (A) Representative simulations upon pulsing to +10 mV (from a holding voltage of −110 mV), showing varying numbers of current peaks (a–d, top). For each simulation also shown are the voltage sensor movement and the charge transported. (B) Bar histogram of the number of events (N) carrying the indicated charge quantity (e0). Inset: Number of responses (N) with 1–4 peaks. (C) Dependence of qapp on the cutoff filter frequency. Data were obtained from Brownian simulated variance vs. mean current plots. The plot shown in the inset was obtained at a frequency of 32 kHz (from Catacuzzeno et al., 2021a).
Figure 8.
Figure 8.
Voltage-dependence of the apparent charge qapp. (A) Apparent charge (qapp) vs. V relationship obtained experimentally by Rodríguez et al. (1998). (B) Apparent charge (qapp) vs. V relationship simulated with the Brownian model by Catacuzzeno et al. (2021a). (C and D) Bar plots illustrating the number of peaks carrying 1, 2, 3, and 4 charges, respectively, at the applied voltages of +40 (top) and +140 mV (bottom), as assessed from the 40 simulations analyzed. Insets: Mean variance responses obtained at the same potential used in the corresponding histogram (from Catacuzzeno et al., 2021a).
Figure 9.
Figure 9.
First recordings of gating charge currents from ion channels. (A) Gating currents obtained by subtracting from the currents recorded at the indicated potentials the currents obtained with the same voltage pulses applied at a membrane potential range where channels do not activate (negative to resting potential). Pulse duration was shortened as depolarization increased. (B) Voltage dependence of the ON gating charge is described by a Boltzmann function, as expected from the classic gating model. Circles represent measurements from the experiment in A; squares are measurements at earlier times from a similar set of experimental traces (modified from Schneider and Chandler, 1973).
Scheme 3.
Scheme 3.
Rìos and coworkers’ 2-mode, 4-state model of charge interconversion in muscle Ca channels. See Gating currents from Ca channels for full description (from Brum et al., 1988a).
Figure 10.
Figure 10.
Gating currents from BK channels. (A) Cartoon of the voltage and Ca2+-gated BK channel highlighting the VSD, the pore domain (PD), and the Ca2+-sensing domain (CTD) (from Yang et al., 2015). (B) Representative gating current records of WT and neutralization mutants (indicated) in the S4 helix of the human BK channel. (C) Gating charges displacement (zQ) for BK WT and the mutants shown in B (modified from Carrasquel-Ursulaez et al., 2022).
Figure 11.
Figure 11.
Gating currents from voltage-gated Hv1 channel. (A) Experimental currents from monomeric Hv1 mutant N264R (black traces) in response to varying depolarizing pulses (level indicated) from a holding potential of −70 mV. The fitting procedures isolated the ON-gating current (blue traces) from the ion current (green traces). (B) Charge displacement as a function of voltage, Q(V) (filled circles). The experimental data were fitted by a Boltzmann function (solid line) with V1/2 = 52.8 mV and zδ = 1.2. Open circles represent the time constants of the gating current decays at the given depolarization and were fitted with a two-state model (solid line). For fitting parameters, see the original work (Carmona et al., 2018). (C) Plot comparing the OFF- and ON-gating charge obtained with pulses of different durations (from Carmona et al., 2018).
Figure 12.
Figure 12.
Gating currents from voltage-gated phosphatase (Ci-VSP). (A) Cartoon of the voltage-gated lipid phosphatase enzyme highlighting the VSD module (blue) and the enzymatic moiety (green). (B) Gating currents at varying depolarizations from voltage-gated lipid phosphatase. Inset shows the equivalence of the ON- and OFF-gating currents. (C) Charge translocation associated with the ON and the OFF component, as a function of voltage (from Okamura et al., 2018).

Similar articles

Cited by

References

    1. Adrian, R.H., and Almers W.. 1976. Charge movement in the membrane of striated muscle. J. Physiol. 254:339–360. 10.1113/jphysiol.1976.sp011235 - DOI - PMC - PubMed
    1. Aggarwal, S.K., and MacKinnon R.. 1996. Contribution of the S4 segment to gating charge in the Shaker K+ channel. Neuron. 16:1169–1177. 10.1016/S0896-6273(00)80143-9 - DOI - PubMed
    1. Aldrich, R.W., Corey D.P., and Stevens C.F.. 1983. A reinterpretation of mammalian sodium channel gating based on single channel recording. Nature. 306:436–441. 10.1038/306436a0 - DOI - PubMed
    1. Almers, W. 1978. Gating currents and charge movements in excitable membranes. Rev. Physiol. Biochem. Pharmacol. 82:96–190. 10.1007/BFb0030498 - DOI - PubMed
    1. Almers, W., and Armstrong C.M.. 1980. Survival of K+ permeability and gating currents in squid axons perfused with K+-free media. J. Gen. Physiol. 75:61–78. 10.1085/jgp.75.1.61 - DOI - PMC - PubMed