. 2023 Jul 6;21(7):e3002197.
doi: 10.1371/journal.pbio.3002197. eCollection 2023 Jul.

A systematic CRISPR screen reveals redundant and specific roles for Dscam1 isoform diversity in neuronal wiring

Affiliations

A systematic CRISPR screen reveals redundant and specific roles for Dscam1 isoform diversity in neuronal wiring

Haiyang Dong et al. PLoS Biol. .

Abstract

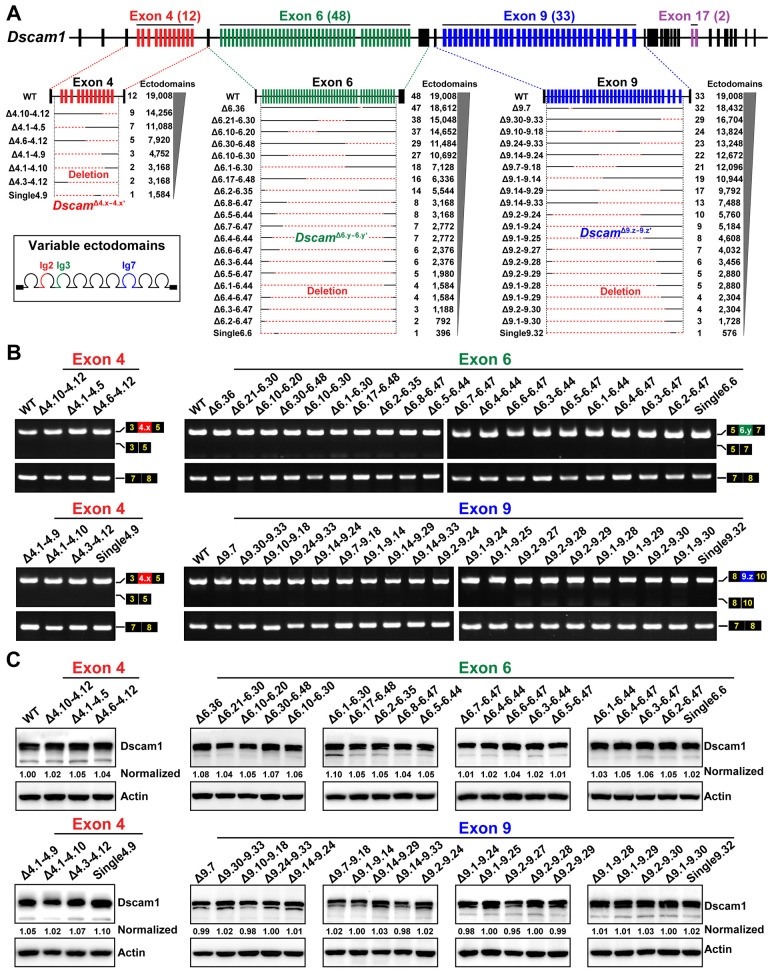
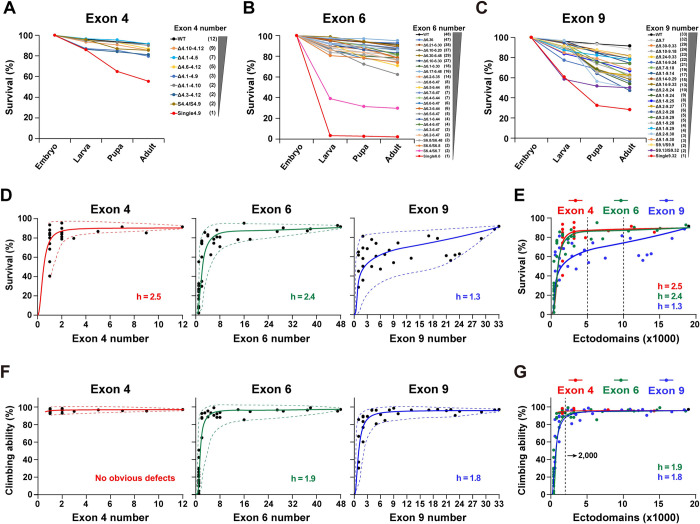
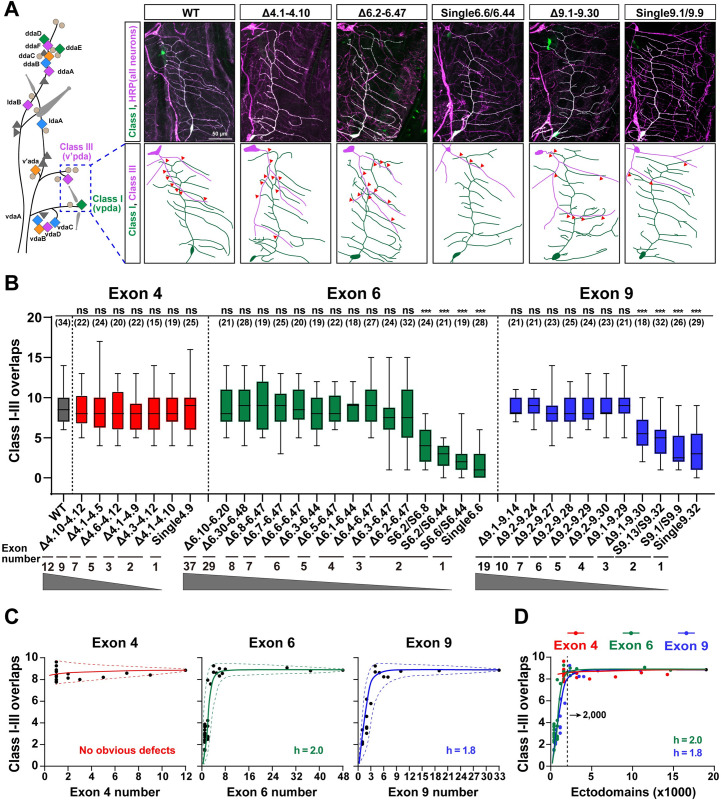
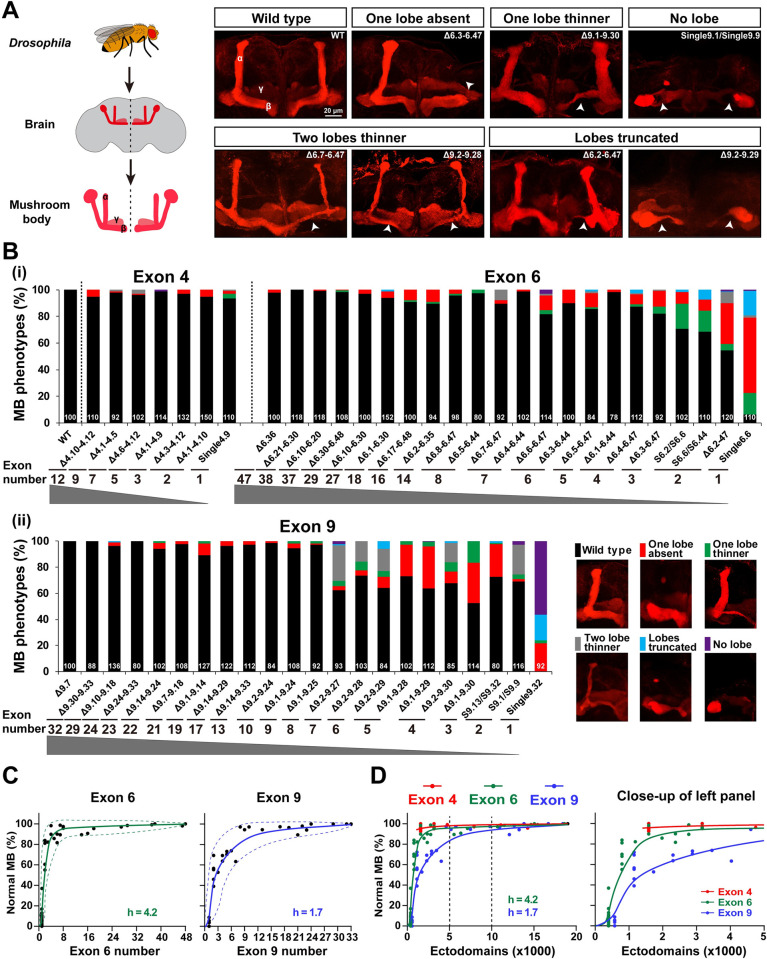
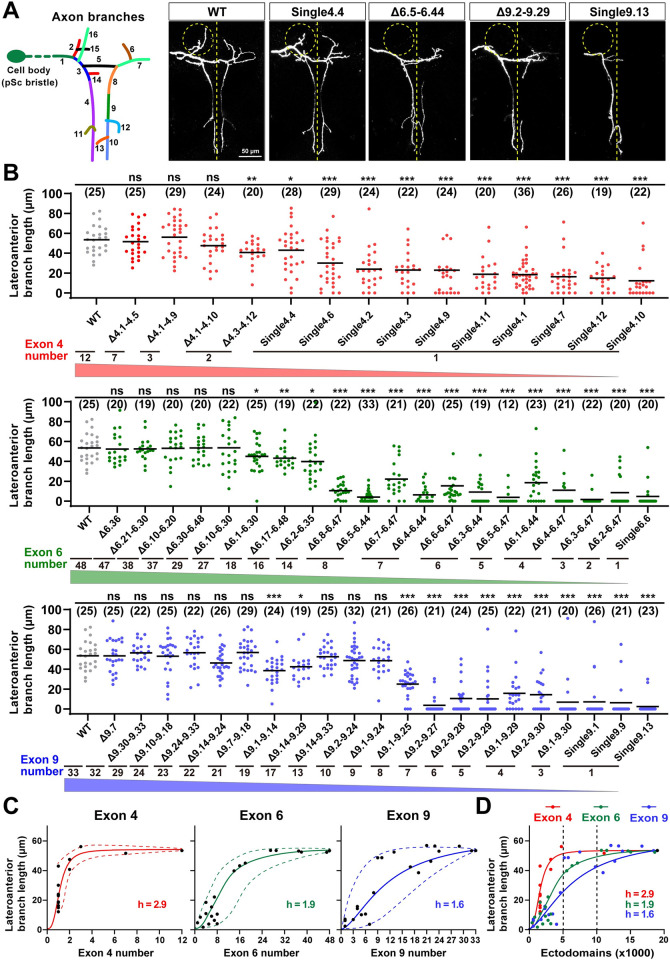
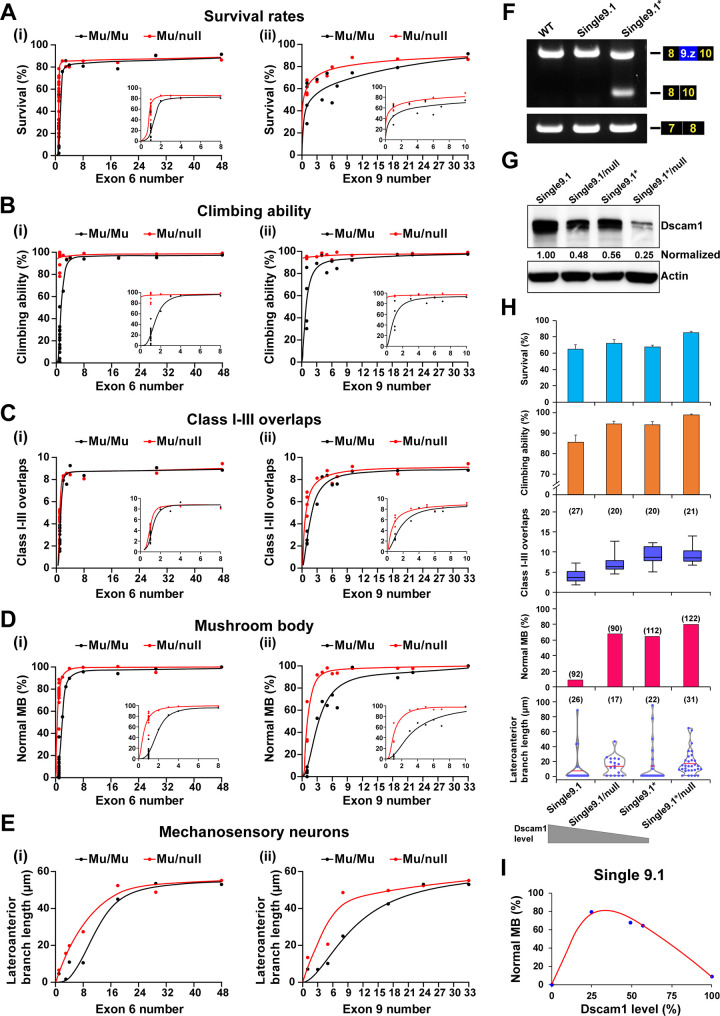
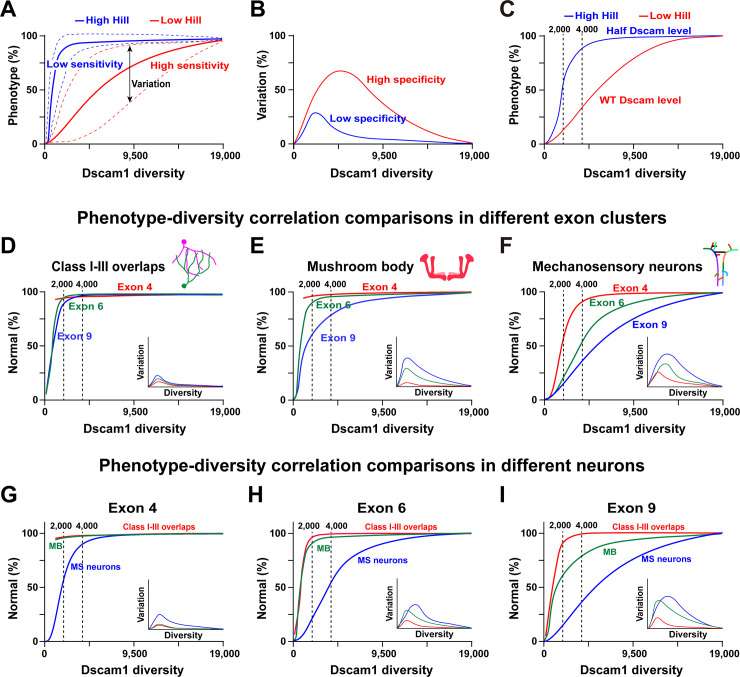
Drosophila melanogaster Down syndrome cell adhesion molecule 1 (Dscam1) encodes 19,008 diverse ectodomain isoforms via the alternative splicing of exon 4, 6, and 9 clusters. However, whether individual isoforms or exon clusters have specific significance is unclear. Here, using phenotype-diversity correlation analysis, we reveal the redundant and specific roles of Dscam1 diversity in neuronal wiring. A series of deletion mutations were performed from the endogenous locus harboring exon 4, 6, or 9 clusters, reducing to 396 to 18,612 potential ectodomain isoforms. Of the 3 types of neurons assessed, dendrite self/non-self discrimination required a minimum number of isoforms (approximately 2,000), independent of exon clusters or isoforms. In contrast, normal axon patterning in the mushroom body and mechanosensory neurons requires many more isoforms that tend to associate with specific exon clusters or isoforms. We conclude that the role of the Dscam1 diversity in dendrite self/non-self discrimination is nonspecifically mediated by its isoform diversity. In contrast, a separate role requires variable domain- or isoform-related functions and is essential for other neurodevelopmental contexts, such as axonal growth and branching. Our findings shed new light on a general principle for the role of Dscam1 diversity in neuronal wiring.


Conflict of interest statement

The authors declare that they have no competing interests.

Figures

Fig 1
Fig 1. Construction and molecular characterization of Dscam1 deletion mutants.
See also S1 Fig. (A) Schematic diagrams of mutants with reduced Dscam1 diversity in exon 4, 6, or 9 clusters. Red dotted lines indicate the fragments of deleted variable exons. Potential ectodomain diversity is shown on the right. (B) RT-PCR diagrams of head tissues of Dscam1 mutants. The overall inclusion frequency of variable exons in the mutants for each variable cluster was indistinguishable from the wild-type controls. (C) The protein levels in the head tissues of the Dscam1 mutants were similar to the wild-type controls. Dscam1 levels were normalized to β-actin, and the expression levels were then compared to the wild type, set to 1. Dscam1, Down syndrome cell adhesion molecule 1; RT-PCR, reverse transcription PCR; WT, wild type.
Fig 2
Fig 2. Reducing the Dscam1 diversity affects fly viability and locomotion ability.
See also S2 and S3 Figs. (A-C) Survival rates at each development stage in the wild-type and mutants with reduced numbers of exon 4 (A), exon 6 (B), or exon 9 (C). The number of remaining variable exons is shown on the right. (D) Survival rates plotted against the remaining numbers of variable exon 4s, exon 6s, and exon 9s. Survival rates positively correlated with the number of variable exons, and the best-fitting Hill function corresponds to a sigmoidal curve. The Hill coefficient (h) is the sensitivity parameter. The dotted lines represent the spectra of phenotypic variations, i.e., the variation range of phenotype defects among different mutants with the same degree of Dscam1 diversity. The minimum phenotypic defects are shown by the upper dashed line, and the lower dashed line shows the maximum phenotypic defects. (E) Survival rates as a function of the number of ectodomain isoforms. The survival phenotype was more sensitive to exon 9 numbers (lower h) than to exon 4 and 6 numbers. (F) Locomotion ability of the fly adults correlated with the number of variable exons 6 and 9. Reducing to a single exon 4 did not affect the climbing ability of flies. (G) Locomotion ability of fly adults as a function of the number of the ectodomain isoforms. Data used to generate graphs can be found in S1 Data. Dscam1, Down syndrome cell adhesion molecule 1; WT, wild type.
Fig 3
Fig 3. Reducing the Dscam1 diversity affects the overlaps between dendrites of class I and class III neurons.
See also S4 Fig. (A) A schematic diagram of the distribution of 4 types of da neurons (colored diamonds) is shown on the left. The diagram of dendrite overlaps of class I and III neurons in the wild-type and deletion mutants is shown on the right. All neurons were detected by anti-HRP antibody (magenta), and class I (vpda) neurons were labeled with GFP driven by Gal4221 (green; appears white because they overlap with magenta). Red arrowheads indicate crossing between class I and class III dendrites. Scale bar, 50 μm. (B) Overlaps between class I and class III dendrites of da neurons of different Dscam1 mutant flies. ns, not significant; ***p < 0.001 (Student t test, two-tailed). The numbers in parentheses represent the analyzed class I and III neurons. (C) Overlaps between class I–III dendrites largely correlated with the number of available variable exons 4, 6, and 9. The best-fitting Hill function corresponds to a sigmoidal curve. The dashed curves indicate the spectra of variation among different variants. The small variation spectra suggest that these isoforms have low specificity for this phenotype. (D) A comparison of phenotype–diversity correlates among variable exon 4, exon 6, and exon 9 clusters. The Hill coefficient (h) is similar between exons 6 and 9, suggesting that Dscam1 isoforms act largely in a variable exon cluster–independent manner. Data used to generate graphs can be found in S1 Data. da, dendritic arborization; Dscam1, Down syndrome cell adhesion molecule 1; HRP, horseradish peroxidase; WT, wild type.
Fig 4
Fig 4. Reduction of Dscam1 diversity affects MB morphology.
See also S5 and S6 Figs. (A) MB lobe morphology in wild-type and Dscam1 mutant animals was visualized with monoclonal antibody 1D4 (anti-FasII, red). Scale bar, 20 μm. (B) Quantification of the MB phenotypes in mutants with a deletion of variable exons 4, 6, and 9. The numbers at the bottom represent the number of MBs (i.e., brain hemispheres) examined for each genotype. (C) The normal MB phenotype rate largely correlated with the numbers of variable exon 6 (left panel) and exon 9 (right panel). The dashed curves show the spectra of phenotypic variation. (D) A comparison of the phenotype–diversity correlates among variable exon 4, 6, and 9 clusters. A close-up of the left panel is shown on the right. These data indicate that reducing Dscam1 diversity affects MB phenotype in an exon cluster–specific manner. Data used to generate graphs can be found in S1 Data. Dscam1, Down syndrome cell adhesion molecule 1; MB, mushroom body; WT, wild type.
Fig 5
Fig 5. The reduction of Dscam1 diversity affects axonal branching in MS neurons.
See also S7–S9 Figs. (A) Schematic of the axon trajectory of a single MS neuron within the VNC. Branch segments were assigned different colors for scoring. Representative dye tracing images of the wild-type and Dscam1 mutant flies. Dashed circles indicate the location of the lateroanterior branch. ns, not significant; *p < 0.05; **p < 0.01; ***p < 0.001 (Student t test, two-tailed). Scale bar, 50 μm. (B) Quantitative analysis of the length of lateroanterior branch in wild-type and Dscam1 mutant flies. Numbers in parentheses represent the number of pSc neurons observed in each genotype. (C) The average length of lateroanterior branch positively correlated with the number of variable exons 4, 6, and 9. The dashed curves show the spectra of phenotypic variation among different variants. (D) A comparison of phenotype–diversity correlates among variable exon 4, 6, and 9 clusters. Reducing Dscam1 diversity affected MS axonal branching in an exon cluster–specific manner. Data used to generate graphs can be found in S1 Data. Dscam1, Down syndrome cell adhesion molecule 1; MS, mechanosensory; VNC, ventral nerve cord; WT, wild type.
Fig 6
Fig 6. Effect of reducing Dscam1 expression level on the phenotype–diversity correlations.
See also S10 and S11 Figs. (A-E) A comparison of Dscam1 phenotype–diversity correlates between Mu/Mu (homozygous mutants, black lines) and Mu/null (mutant/null, red lines) mutants for survival rates (A), climbing ability (B), class I-III overlaps (C), MB (D), and MS neurons (E) phenotypes. Reducing Dscam1 expression levels could partially rescue defects caused by reduced diversity in DscamΔ6.y-6.y’ and DscamΔ9.z-9.z’ mutant flies. (F) RT-PCR was performed from the head tissues of wild-type, DscamSingle9.1, and DscamSingle9.1* mutant flies. The primers anneal to exons 8 and 10 or exons 7 and 8. (G) Western blot analysis. Dscam1 levels were normalized to β-actin, and the expression levels were compared to DscamSingle9.1, which was set to 1. (H) The normal phenotypes in mutants expressing a single exon 9.1 improved with the decrease in the Dscam1 expression level. (I) The relationship between the frequency of normal MBs versus the corresponding Dscam1 protein levels in the DscamSingle9.1 mutants. Data used to generate graphs can be found in S1 Data. Dscam1, Down syndrome cell adhesion molecule 1; MB, mushroom body; MS, mechanosensory; RT-PCR, reverse transcription PCR; WT, wild type.
Fig 7
Fig 7. Phenotype–diversity correlations reveal differential requirements of Dscam1 diversity in diverse neurons.
See also S12 Fig. (A) The normal phenotype is a sigmoidal function of Dscam1 diversity with various Hill coefficients. The Hill coefficient (h) is the sensitivity parameter. The dotted lines represent the spectra of phenotypic variation. (B) The spectra of phenotypic variation as a function of Dscam1 diversity and an indicator to assess isoform specificity. The larger variation spectra reflect higher isoform specificity. (C) Reducing the Dscam1 level affected the phenotype–diversity correlations considerably, as indicated by the higher Hill value. (D-F) A comparison of the phenotype–diversity correlations in 3 exon clusters. Exon 4, 6, or 9 clusters exhibited similar phenotype–diversity correlation curves in class I-III overlaps (D). The small spectra of variation suggest that this process was largely independent of the isoform identity. However, exon clusters 4, 6, or 9 exhibited considerable differences in the correlation curves in MB (E) and MS neurons (F), suggesting an association with a specific exon cluster. Moreover, the large spectra of variation are associated with the isoform identity. (G-I) Phenotype–diversity correlation comparisons of different neurons in individual exon 4 (G), 6 (H), and 9 (I) clusters. These data revealed the differential requirement of Dscam1 diversity in diverse neurons. Dscam1, Down syndrome cell adhesion molecule 1; MB, mushroom body; MS, mechanosensory.

Similar articles

Cited by

References

    1. Honig B, Shapiro L. Adhesion Protein Structure, Molecular Affinities, and Principles of Cell-Cell Recognition. Cell. 2020;181(3):520–535. doi: 10.1016/j.cell.2020.04.010 ; PubMed Central PMCID: PMC7233459. - DOI - PMC - PubMed
    1. Sanes JR, Zipursky SL. Synaptic Specificity, Recognition Molecules, and Assembly of Neural Circuits. Cell. 2020;181(3):536–556. doi: 10.1016/j.cell.2020.04.008 . - DOI - PubMed
    1. Mountoufaris G, Canzio D, Nwakeze CL, Chen WV, Maniatis T. Writing, Reading, and Translating the Clustered Protocadherin Cell Surface Recognition Code for Neural Circuit Assembly. Annu Rev Cell Dev Biol. 2018;34:471–493. doi: 10.1146/annurev-cellbio-100616-060701 . - DOI - PubMed
    1. Schmucker D, Clemens JC, Shu H, Worby CA, Xiao J, Muda M, et al.. Drosophila Dscam is an axon guidance receptor exhibiting extraordinary molecular diversity. Cell. 2000;101(6):671–684. doi: 10.1016/s0092-8674(00)80878-8 . - DOI - PubMed
    1. Wojtowicz WM, Wu W, Andre I, Qian B, Baker D, Zipursky SL. A vast repertoire of Dscam binding specificities arises from modular interactions of variable Ig domains. Cell. 2007;130(6):1134–1145. doi: 10.1016/j.cell.2007.08.026 ; PubMed Central PMCID: PMC2707357. - DOI - PMC - PubMed

Publication types

MeSH terms

LinkOut - more resources