

PKA regulatory subunit Bcy1 couples growth, lipid metabolism, and fermentation during anaerobic xylose growth in Saccharomyces cerevisiae
- PMID: 37410771
- PMCID: PMC10353814
- DOI: 10.1371/journal.pgen.1010593
PKA regulatory subunit Bcy1 couples growth, lipid metabolism, and fermentation during anaerobic xylose growth in Saccharomyces cerevisiae
Abstract
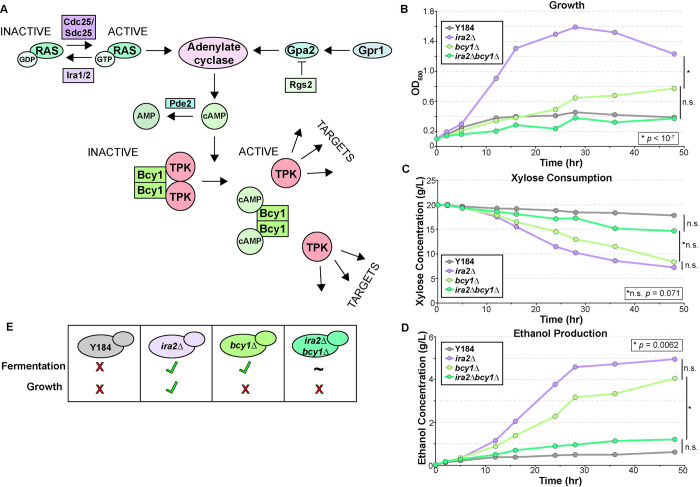
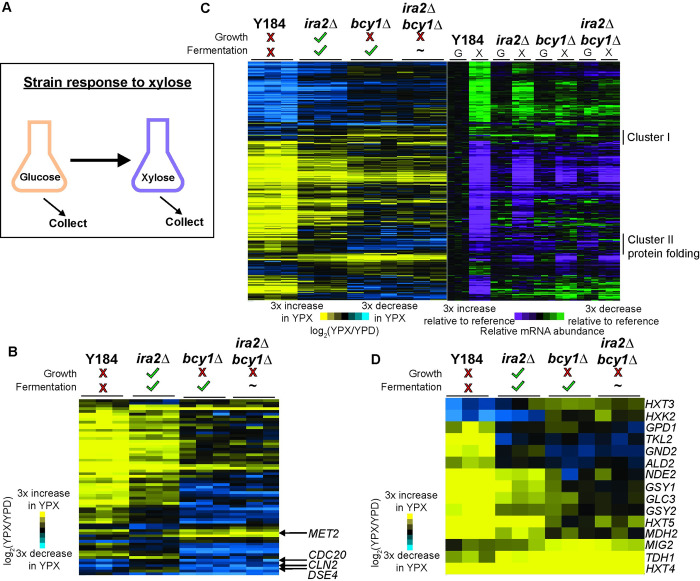
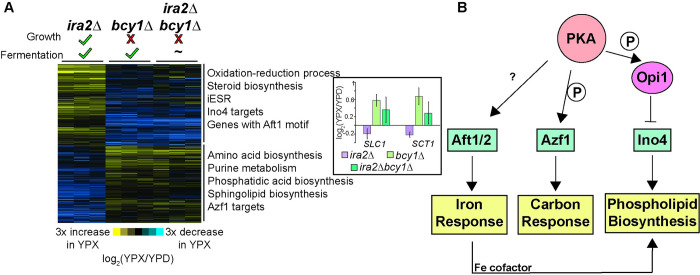
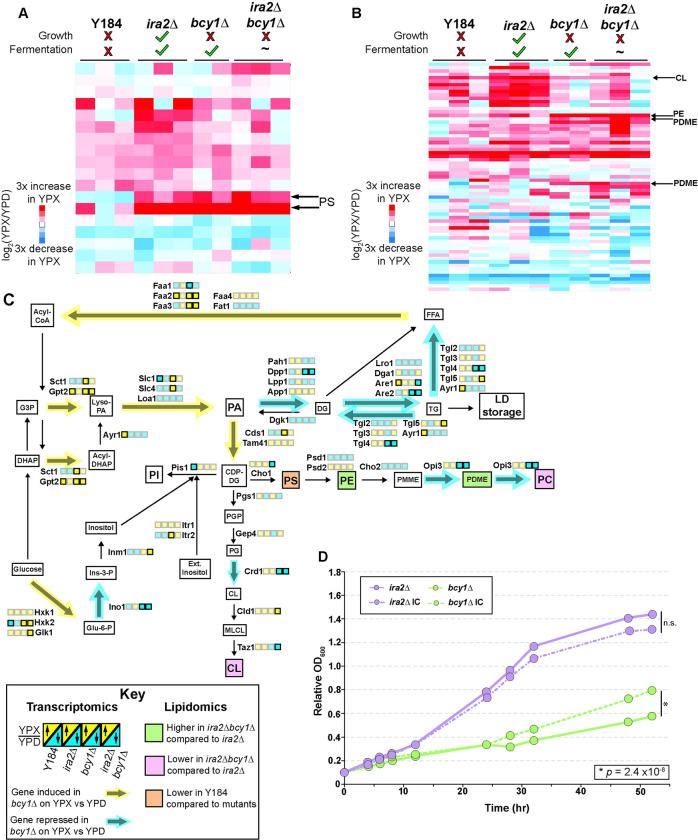
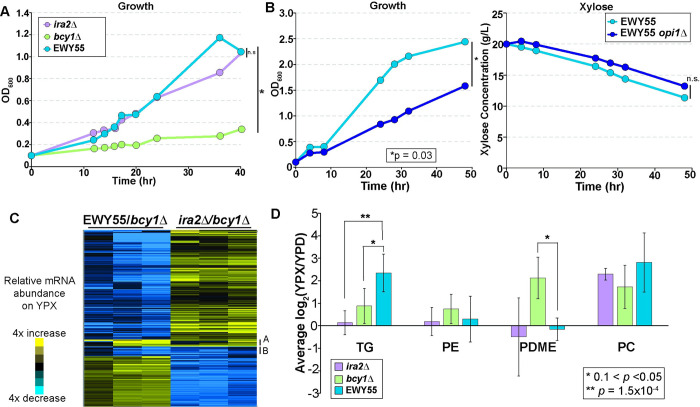
Organisms have evolved elaborate physiological pathways that regulate growth, proliferation, metabolism, and stress response. These pathways must be properly coordinated to elicit the appropriate response to an ever-changing environment. While individual pathways have been well studied in a variety of model systems, there remains much to uncover about how pathways are integrated to produce systemic changes in a cell, especially in dynamic conditions. We previously showed that deletion of Protein Kinase A (PKA) regulatory subunit BCY1 can decouple growth and metabolism in Saccharomyces cerevisiae engineered for anaerobic xylose fermentation, allowing for robust fermentation in the absence of division. This provides an opportunity to understand how PKA signaling normally coordinates these processes. Here, we integrated transcriptomic, lipidomic, and phospho-proteomic responses upon a glucose to xylose shift across a series of strains with different genetic mutations promoting either coupled or decoupled xylose-dependent growth and metabolism. Together, results suggested that defects in lipid homeostasis limit growth in the bcy1Δ strain despite robust metabolism. To further understand this mechanism, we performed adaptive laboratory evolutions to re-evolve coupled growth and metabolism in the bcy1Δ parental strain. The evolved strain harbored mutations in PKA subunit TPK1 and lipid regulator OPI1, among other genes, and evolved changes in lipid profiles and gene expression. Deletion of the evolved opi1 gene partially reverted the strain's phenotype to the bcy1Δ parent, with reduced growth and robust xylose fermentation. We suggest several models for how cells coordinate growth, metabolism, and other responses in budding yeast and how restructuring these processes enables anaerobic xylose utilization.
Copyright: © 2023 Wagner et al. This is an open access article distributed under the terms of the Creative Commons Attribution License, which permits unrestricted use, distribution, and reproduction in any medium, provided the original author and source are credited.
Conflict of interest statement
JJC is a consultant for Thermo Fisher Scientific.
Figures
Similar articles
-
Rewired cellular signaling coordinates sugar and hypoxic responses for anaerobic xylose fermentation in yeast.PLoS Genet. 2019 Mar 11;15(3):e1008037. doi: 10.1371/journal.pgen.1008037. eCollection 2019 Mar. PLoS Genet. 2019. PMID: 30856163 Free PMC article.
-
PKA and HOG signaling contribute separable roles to anaerobic xylose fermentation in yeast engineered for biofuel production.PLoS One. 2019 May 21;14(5):e0212389. doi: 10.1371/journal.pone.0212389. eCollection 2019. PLoS One. 2019. PMID: 31112537 Free PMC article.
-
Directed Evolution Reveals Unexpected Epistatic Interactions That Alter Metabolic Regulation and Enable Anaerobic Xylose Use by Saccharomyces cerevisiae.PLoS Genet. 2016 Oct 14;12(10):e1006372. doi: 10.1371/journal.pgen.1006372. eCollection 2016 Oct. PLoS Genet. 2016. PMID: 27741250 Free PMC article.
-
Strain engineering of Saccharomyces cerevisiae for enhanced xylose metabolism.Biotechnol Adv. 2013 Nov;31(6):851-61. doi: 10.1016/j.biotechadv.2013.03.004. Epub 2013 Mar 21. Biotechnol Adv. 2013. PMID: 23524005 Review.
-
Yeast Protein Kinase A Isoforms: A Means of Encoding Specificity in the Response to Diverse Stress Conditions?Biomolecules. 2022 Jul 8;12(7):958. doi: 10.3390/biom12070958. Biomolecules. 2022. PMID: 35883514 Free PMC article. Review.
Cited by
-
Advances in S. cerevisiae Engineering for Xylose Fermentation and Biofuel Production: Balancing Growth, Metabolism, and Defense.J Fungi (Basel). 2023 Jul 26;9(8):786. doi: 10.3390/jof9080786. J Fungi (Basel). 2023. PMID: 37623557 Free PMC article. Review.
-
Engineering transcriptional regulatory networks for improving second-generation fuel ethanol production in Saccharomyces cerevisiae.Synth Syst Biotechnol. 2024 Oct 28;10(1):207-217. doi: 10.1016/j.synbio.2024.10.006. eCollection 2025. Synth Syst Biotechnol. 2024. PMID: 39558946 Free PMC article. Review.
References
-
- Spellman PT, Sherlock G, Zhang MQ, Iyer VR, Anders K, Eisen MB, et al.. Comprehensive identification of cell cycle-regulated genes of the yeast Saccharomyces cerevisiae by microarray hybridization. Mol Biol Cell [Internet]. 1998. Oct 13 [cited 2020 Jun 26];9(12):3273–97. Available from: https://www.molbiolcell.org/doi/abs/ doi: 10.1091/mbc.9.12.3273 - DOI - PMC - PubMed
-
- Ewald JC, Kuehne A, Zamboni N, Skotheim JM. The Yeast Cyclin-Dependent Kinase Routes Carbon Fluxes to Fuel Cell Cycle Progression. Mol Cell [Internet]. 2016. May 19 [cited 2022 Jun 16];62(4):532–45. Available from: http://www.cell.com/article/S1097276516001283/fulltext. doi: 10.1016/j.molcel.2016.02.017 - DOI - PMC - PubMed
-
- Zhao G, Chen Y, Carey L, Futcher B. Cyclin-Dependent Kinase Co-Ordinates Carbohydrate Metabolism and Cell Cycle in S. cerevisiae. Mol Cell [Internet]. 2016. May 19 [cited 2019 Apr 26];62(4):546–57. Available from: https://www.sciencedirect.com/science/article/pii/S1097276516301022?via%.... - PMC - PubMed
-
- Blank HM, Papoulas O, Maitra N, Garge R, Kennedy BK, Schilling B, et al.. Abundances of transcripts, proteins, and metabolites in the cell cycle of budding yeast reveal coordinate control of lipid metabolism. Mol Biol Cell [Internet]. 2020. May 1 [cited 2020 Sep 28];31(10):1069–84. Available from: https://www.molbiolcell.org/doi/abs/10.1091/mbc.E19-12-0708 - DOI - PMC - PubMed
-
- Blank HM, Perez R, He C, Maitra N, Metz R, Hill J, et al.. Translational control of lipogenic enzymes in the cell cycle of synchronous, growing yeast cells. EMBO J [Internet]. 2017. Feb 15 [cited 2022 Jun 22];36(4):487–502. Available from: https://onlinelibrary.wiley.com/doi/full/10.15252/embj.201695050. - DOI - PMC - PubMed
Publication types
MeSH terms
Substances
LinkOut - more resources
Full Text Sources
Molecular Biology Databases
