. 2023 Jul 7;381(6653):92-100.
doi: 10.1126/science.ade5308. Epub 2023 Jul 6.

Chromatin expansion microscopy reveals nanoscale organization of transcription and chromatin

Affiliations

Chromatin expansion microscopy reveals nanoscale organization of transcription and chromatin

Mark E Pownall et al. Science. .

Abstract

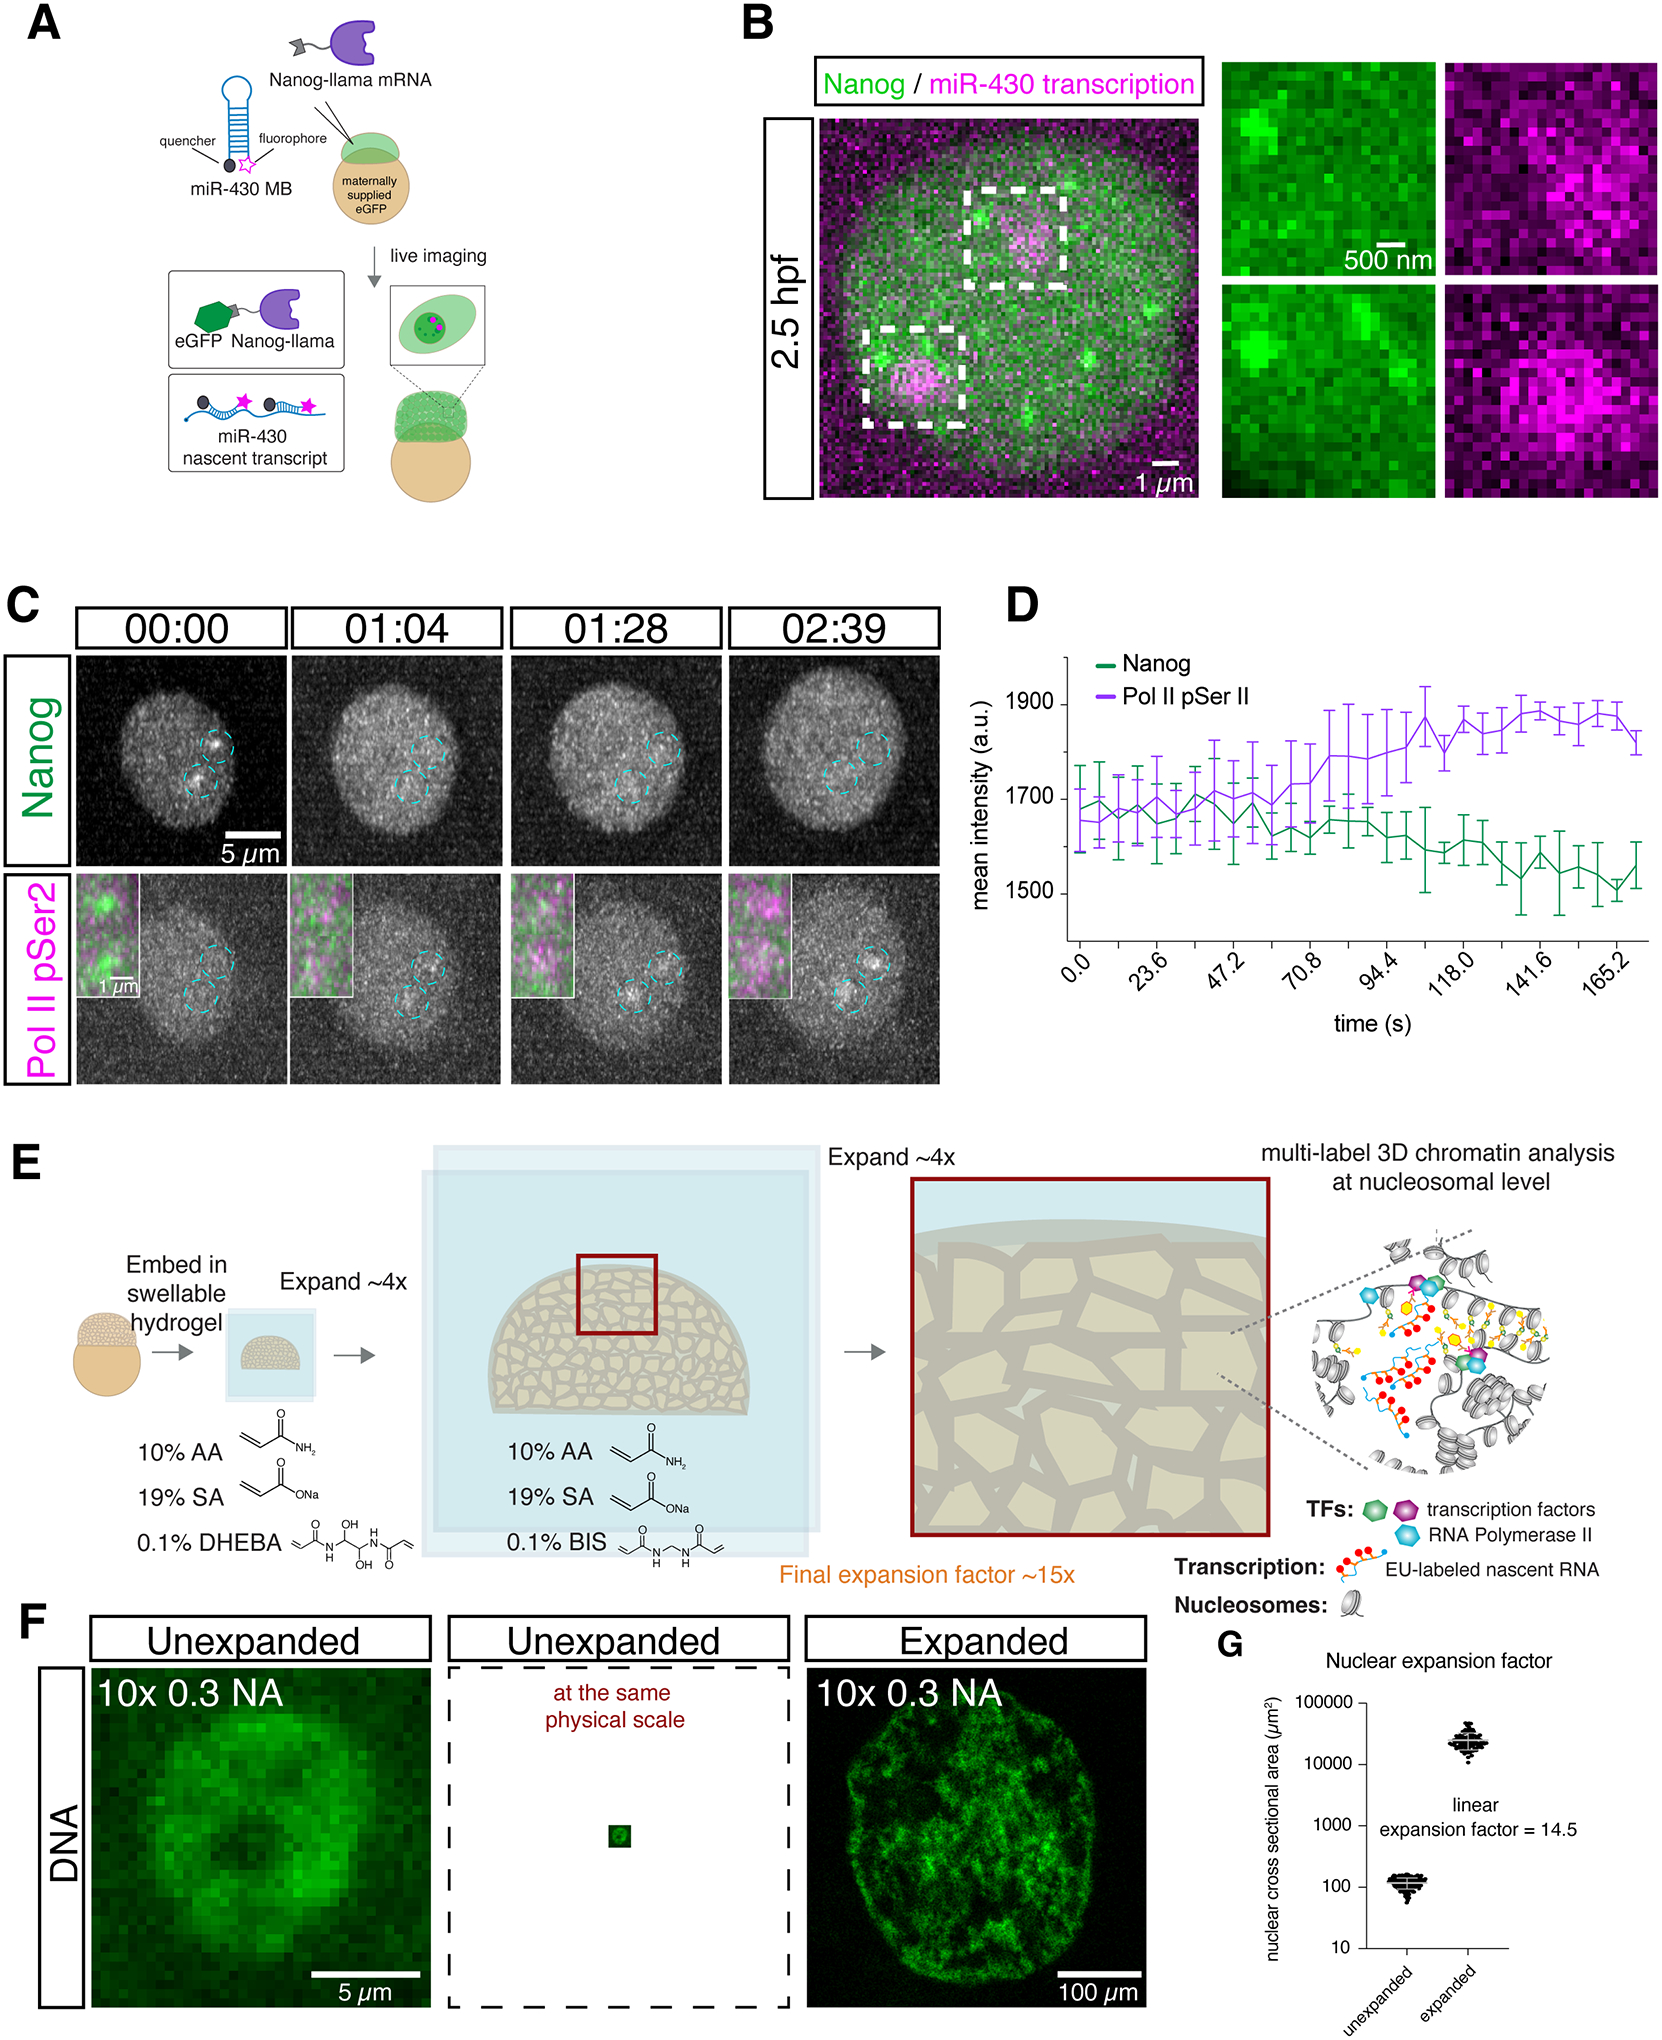
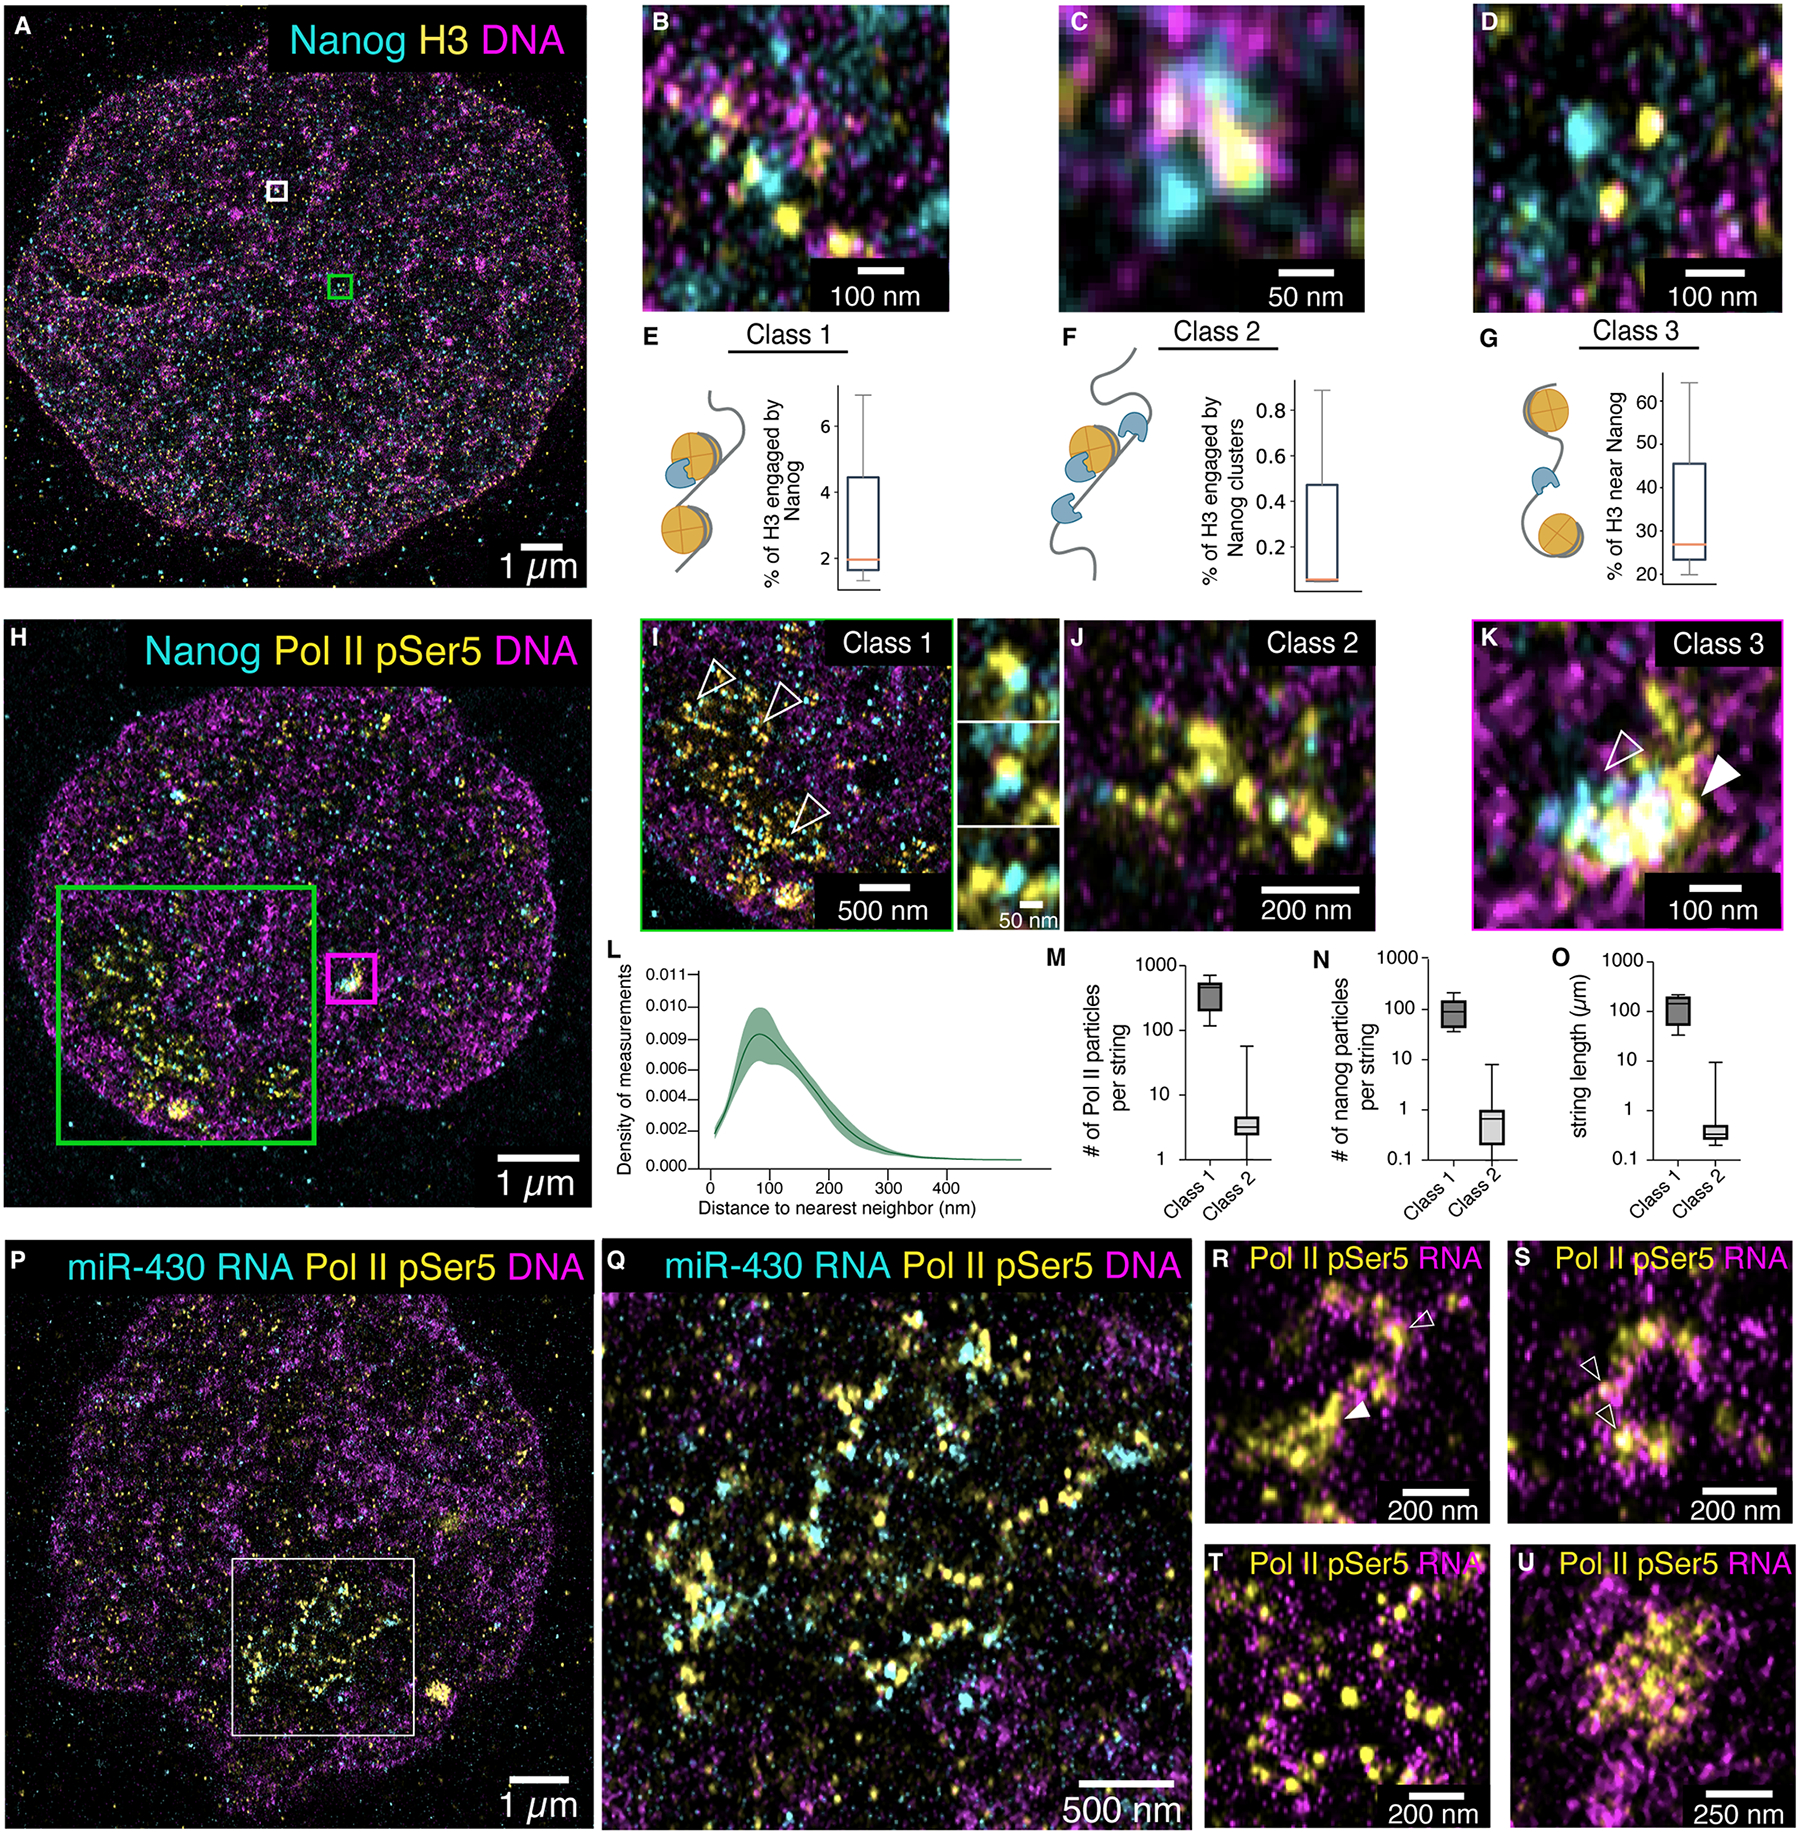
Nanoscale chromatin organization regulates gene expression. Although chromatin is notably reprogrammed during zygotic genome activation (ZGA), the organization of chromatin regulatory factors during this universal process remains unclear. In this work, we developed chromatin expansion microscopy (ChromExM) to visualize chromatin, transcription, and transcription factors in vivo. ChromExM of embryos during ZGA revealed how the pioneer factor Nanog interacts with nucleosomes and RNA polymerase II (Pol II), providing direct visualization of transcriptional elongation as string-like nanostructures. Blocking elongation led to more Pol II particles clustered around Nanog, with Pol II stalled at promoters and Nanog-bound enhancers. This led to a new model termed "kiss and kick", in which enhancer-promoter contacts are transient and released by transcriptional elongation. Our results demonstrate that ChromExM is broadly applicable to study nanoscale nuclear organization.


Conflict of interest statement

Competing interests: M.E.P and A.J.G are inventors on a provisional patent application filed by Yale University with the U.S. patent office covering the ChromExM method described here. J.B. has financial interests in Bruker Corp. and Hamamatsu Photonics. O.M. and J.B. filed patent applications with the U.S. patent office covering the pan-ExM method. O.M. and J.B. are co-founders of panluminate Inc. which is developing related products. The other authors declare no competing financial interests.

Figures

Figure 1.
Figure 1.. Nanog forms DNA-bound foci associated with zygotic transcription.
(A) Schematic detailing how Nanog and miR-430 transcription were visualized in living embryos. (B) Live imaging shows Nanog foci associated with miR-430 transcription at 2.5 hpf. n = 10 nuclei. (C) Live imaging shows Nanog foci are formed and disappear prior to Pol II elongation at 2.75 hpf. n = 2 nuclei, 1 embryo (D) Quantification of fluorescence intensity in (C). (E) Schematic showing the process of ChromExM and expected results. AA, acrylamide; SA, sodium acrylate, DHEBA, N,N’-(1,2-dihydroxyethylene)bisacrylamide; BIS, N,N′-methylenebis(acrylamide). (F) Unexpanded and expanded nuclei from two unrelated embryos stained for DNA and imaged with a 10× 0.3 NA objective demonstrate the enhanced resolution provided by ChromExM. (G) Quantification of the nuclear expansion factor determined by measuring the nuclear cross-sectional area. n = 171 unexpanded nuclei from 3 embryos and 104 expanded nuclei from 17 embryos.
Figure 2.
Figure 2.. ChromExM preserves chromatin architecture and resolves chromatin fibers and individual nucleosomes.
(A) Schematic showing how the chromatin is painted with photocleaved (PC) stripes to detect perturbations after expansion. (B) Expanded nucleus showing that photocleaved stripes remain parallel and sharp after expansion. The image is a maximum intensity projection of several z-slices. n = 20 nuclei from 3 embryos. (C) Quantification of relative inter-strip distance in photocleaved stripes versus a simulated control (Methods) shows minimal variation in the spacing between stripes after expansion. n = 3 nuclei from 3 embryos. (D) Schematic of in vitro assembled nucleosome arrays. (E) ChromExM image (left) showing nucleosome arrays with H3 staining and electron microscopy image of nucleosome arrays with a similar conformation as the expanded array. Red scale bar is not corrected for the expansion factor. (F) ChromExM image with metabolic DNA labelling at 2.75 hpf showing individual chromatin fibers and a schematic of chromatin. n = 6 nuclei, 5 embryos. (G) H3 staining imaged with confocal and STED microscopy resolves individual nucleosomes. n = 468 nucleosomes; 3 nuclei from 2 embryos.
Figure 3.
Figure 3.. Visualizing the nanoscale organization of Nanog, nucleosomes, Pol II, and transcription.
(A-D) Representative images showing Nanog and H3 staining at 4 hpf; (B) represents Class 1 organization. (C) represents the white boxed region in (A) and shows Class 2 organization. (D) represents the green boxed region in (A) and shows Class 3 organization. n = 3 nuclei from 2 embryos. (E-G) Box plots quantifying the percentage of H3 particles in each class of Nanog-H3 interactions. The median is denoted by the orange line. n = 104,347 distances. (H-K) Representative images showing Nanog and Pol II pSer5 staining at 4 hpf, n = 7 nuclei from 2 embryos. (I) represents the green boxed region in (H) and shows Class 1 organization; areas indicated by arrowheads are magnified to the right. (J) represents Class 2 organization. (K) represents the magenta boxed region in (H) and shows Class 3 organization; arrowheads indicate regions enriched for Nanog (open arrowhead) and Pol II pSer5 (closed arrowhead). (L) Density plot of the distance to nearest neighbor for Nanog and Pol II pSer5 particles; n = 169,866 distances. (M) Box plots quantifying the number of Pol II pSer5 particles in Class 1 (n = 36) and Class 2 (n = 5,682) strings. (N) Box plots quantifying the number of Nanog particles in Class 1 and Class 2 Pol II pSer5 strings. (O) Box plots quantifying the length of Pol II pSer5 strings in Class 1 and Class 2. (P-Q) ChromExM images showing Pol II pSer5 and miR-430 RNA detected by HCR (hybridization chain reaction) RNA FISH at 4 hpf. (Q) represents the boxed region in (P). (R-U) Representative images showing nascent RNA and Pol II pSer5 at 4 hpf. n = 7 nuclei from 3 embryos. Closed arrowhead in (R) indicates a central Pol II pSer5 hub with an emanating string of individual Pol II pSer5 particles associated with nascent transcripts (open arrowhead). Open arrowheads in S indicate individual Pol II pSer5 particles.
Figure 4.
Figure 4.. Nanog-bound enhancers and Pol II-bound promoters are kicked apart by transcription elongation.
(A-B) Representative images of Nanog and Pol II pSer5 in DMSO treated embryos at 4 hpf. n = 6 nuclei from 2 embryos. (C-D) Visualization of Pol II pSer5 strings identified in DMSO treated embryos at 4 hpf. (E-F) Representative images of Nanog and Pol II pSer5 in α-amanitin treated embryos. (G-H) Visualization of Pol II pSer5 strings identified in α-amanitin treated embryos. (I) Quantification of total Pol II pSer5 string length per nucleus in DMSO and α-amanitin treated embryos. P = 0.0002; unpaired t test. (J) Quantification of the number of Pol II pSer5 macroclusters detected in DMSO and α-amanitin treated embryos. P = 0.0304; unpaired t test. (K) Density plot of the distance to nearest neighbor for Nanog to Pol II pSer5 particles in DMSO and α-amanitin treated embryos. n = 221,335 and 229,706 distances, respectively. P < 0.001; Mann-Whitney U test. (L) Histogram showing the number of Pol II pSer5 particles within 200 nm of each Nanog particle in DMSO and α-amanitin treated embryos. P < 0.001; Mann-Whitney U test. (M) Line plot showing Pol II pSer5 binding across gene bodies +/− 2kb at zygotic genes in wild-type (WT) and α-amanitin treated embryos. (N) Representative genome tracks of pan-Pol II, Pol II pSer5, and Nanog binding showing accumulation of Pol II pSer5 at the promoter and Nanog-bound enhancers in the presence of α-amanitin. (O) Heatmaps showing Pol II pSer5 binding at Nanog-bound accessible regions in WT and α-amanitin treated embryos. Regions are ranked by Nanog ChIP-seq signal. (P) Schematic showing the kiss-and-kick model.

References

    1. Vastenhouw NL, Cao WX, Lipshitz HD, The maternal-to-zygotic transition revisited. Development 146, dev161471 (2019). - PubMed
    1. Lee MT, Bonneau AR, Giraldez AJ, Zygotic genome activation during the maternal-to-zygotic transition. Annu Rev Cell Dev Biol 30, 581–613 (2014). - PMC - PubMed
    1. Yartseva V, Giraldez AJ. (Elsevier, 2015), pp. 191–232. - PMC - PubMed
    1. Schulz KN, Harrison MM, Mechanisms regulating zygotic genome activation. Nature Reviews Genetics 20, 221–234 (2019). - PMC - PubMed
    1. Wike CL et al., Chromatin architecture transitions from zebrafish sperm through early embryogenesis. Genome Research 31, 981–994 (2021). - PMC - PubMed