. 2023 Aug 25;381(6660):eadg4521.
doi: 10.1126/science.adg4521. Epub 2023 Aug 25.

Oncogene-like addiction to aneuploidy in human cancers

Affiliations

Oncogene-like addiction to aneuploidy in human cancers

Vishruth Girish et al. Science. .

Abstract

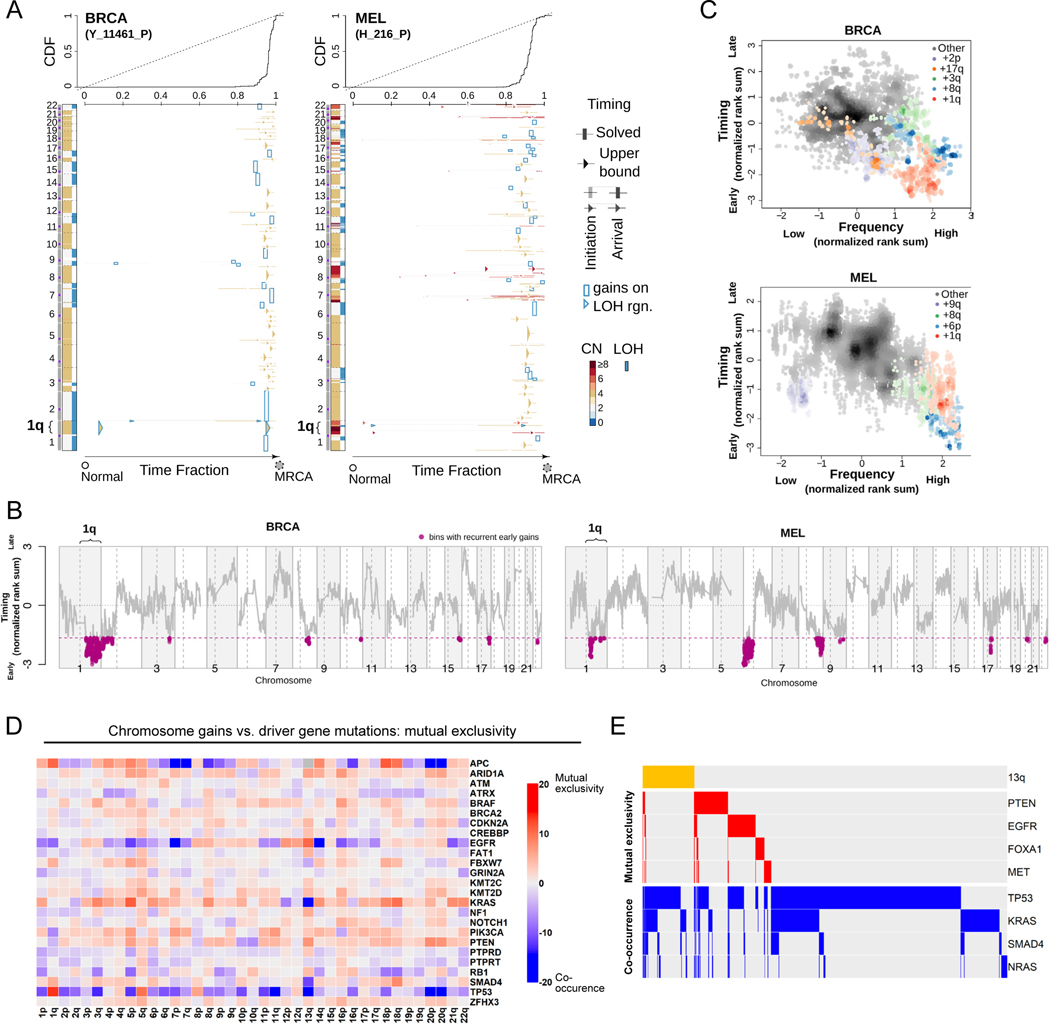
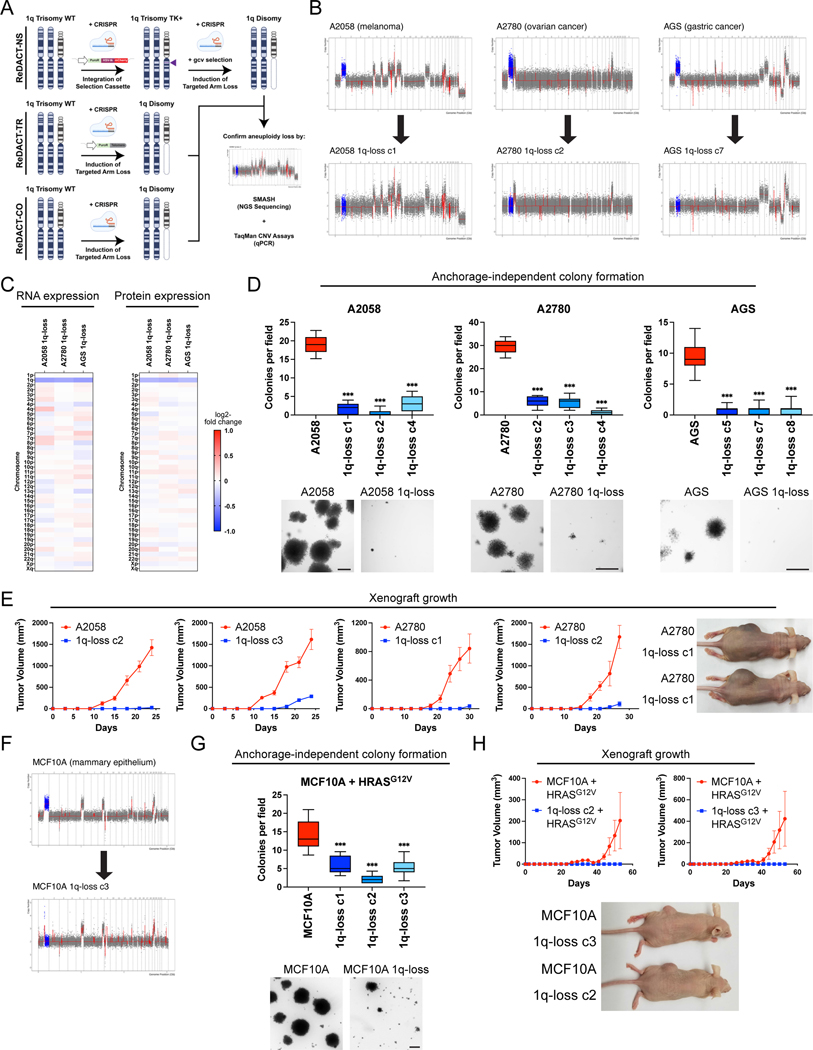
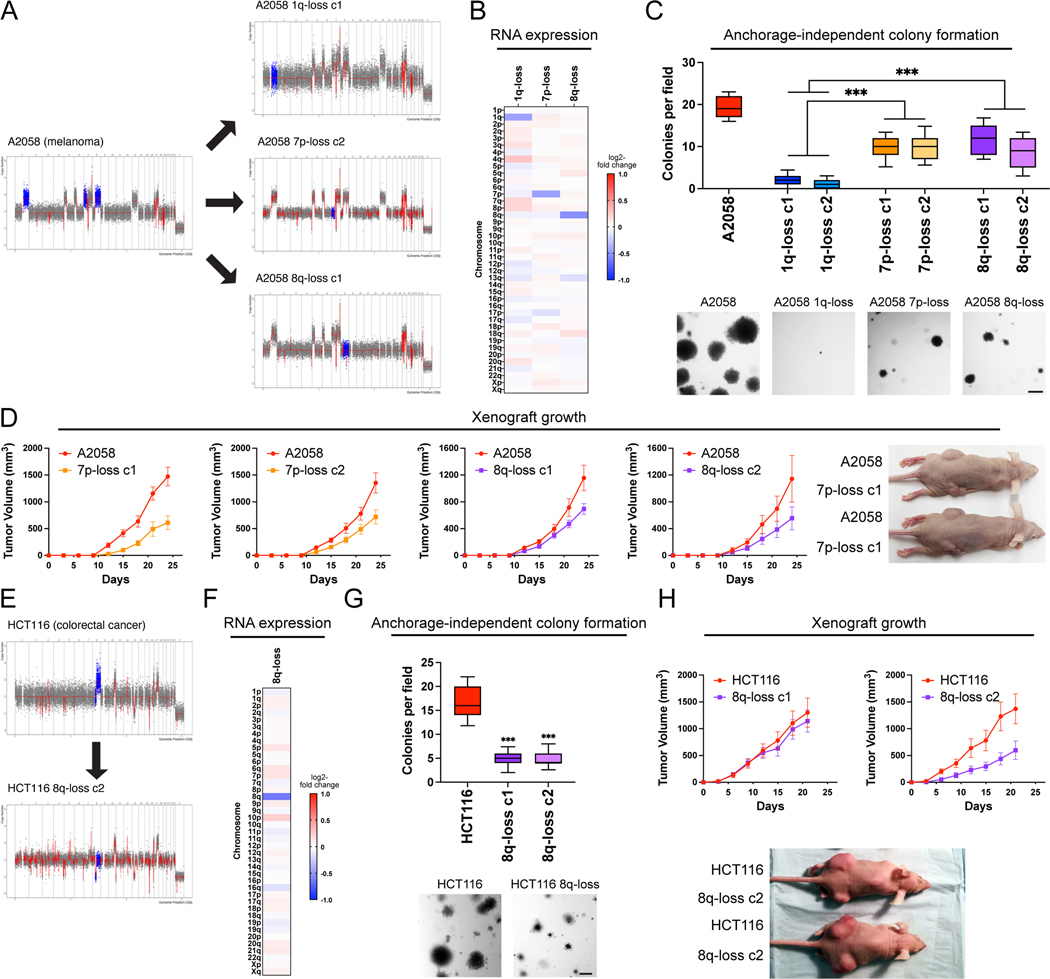
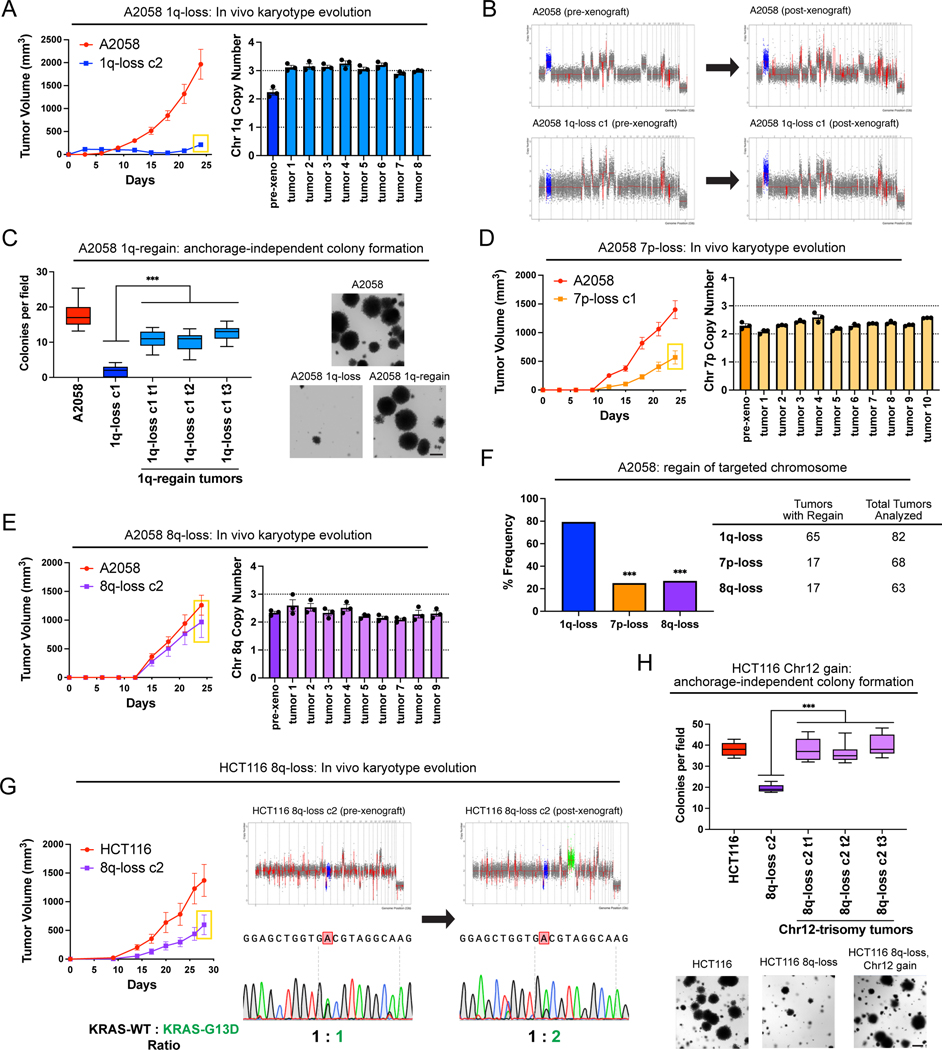
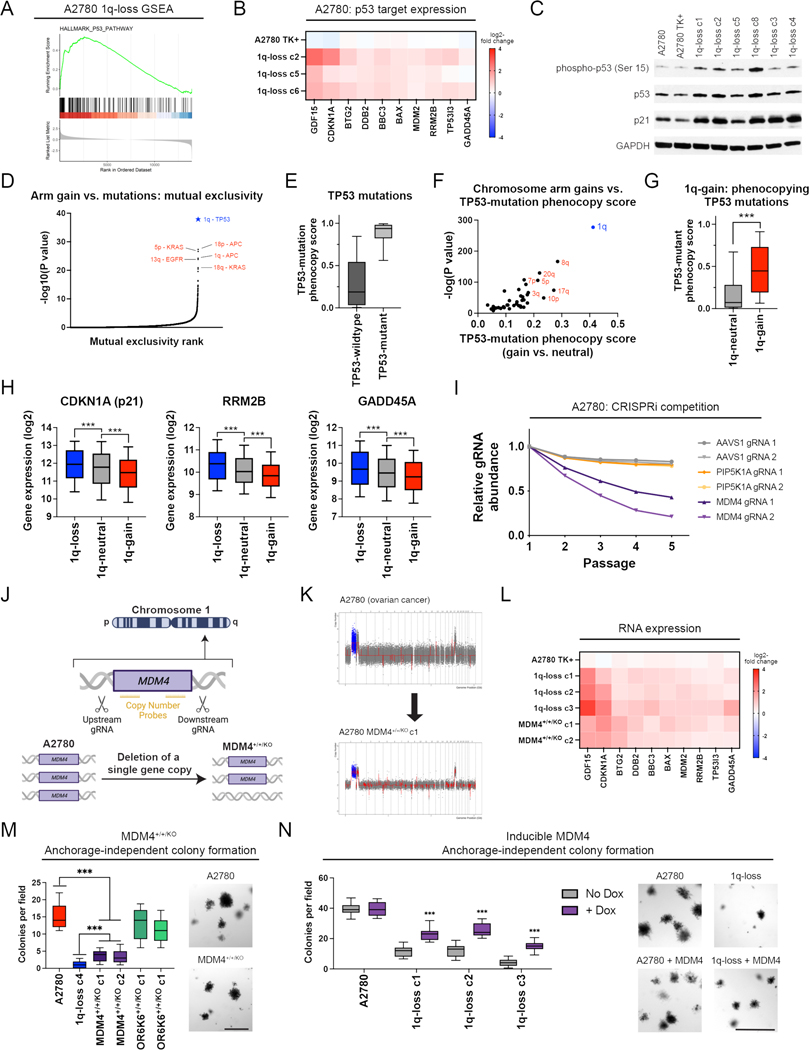
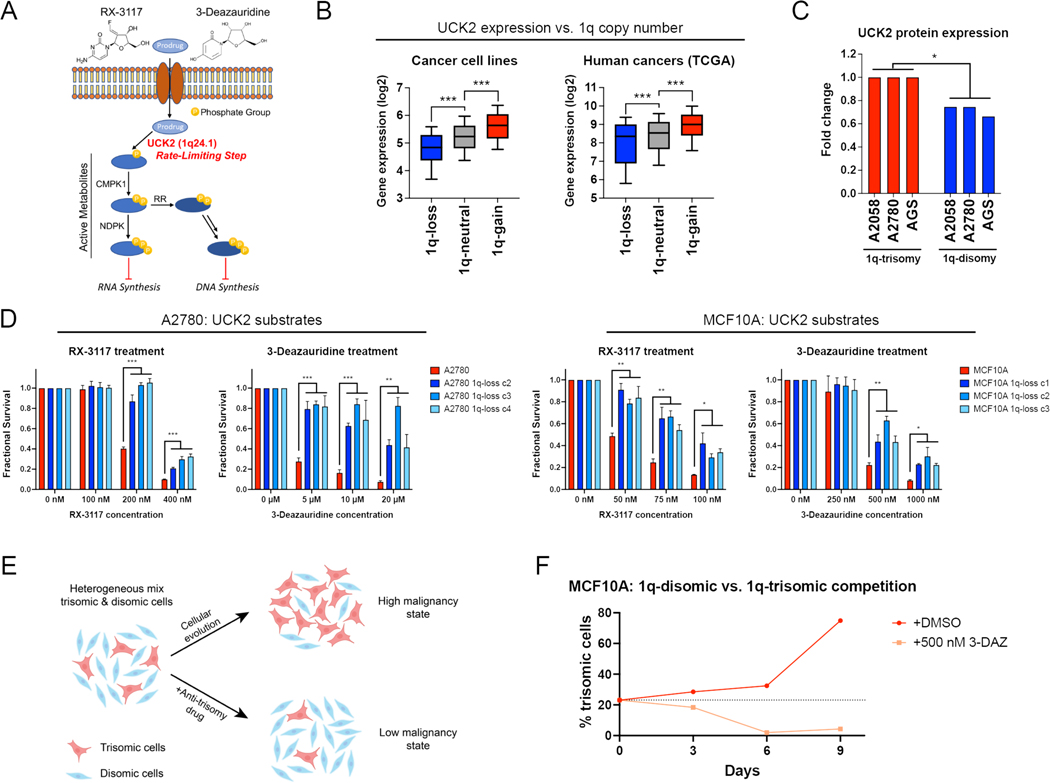
Most cancers exhibit aneuploidy, but its functional significance in tumor development is controversial. Here, we describe ReDACT (Restoring Disomy in Aneuploid cells using CRISPR Targeting), a set of chromosome engineering tools that allow us to eliminate specific aneuploidies from cancer genomes. Using ReDACT, we created a panel of isogenic cells that have or lack common aneuploidies, and we demonstrate that trisomy of chromosome 1q is required for malignant growth in cancers harboring this alteration. Mechanistically, gaining chromosome 1q increases the expression of MDM4 and suppresses p53 signaling, and we show that TP53 mutations are mutually exclusive with 1q aneuploidy in human cancers. Thus, tumor cells can be dependent on specific aneuploidies, raising the possibility that these "aneuploidy addictions" could be targeted as a therapeutic strategy.


Conflict of interest statement

Competing Interests. All other authors declare that they have no competing interests.

Figures

Figure 1.
Figure 1.. Specific chromosome gains arise early in tumor development and are mutually exclusive with driver gene mutations.
(A) The inferred timing of somatic copy number gains in the evolution of two tumors. A breast tumor is shown on the left and a melanoma on the right. Copy number (CN) states along the genome are shown on the left in each panel and color coded. The plot visualizes the time fraction of somatic evolution from germline to the most recent common ancestor (MRCA) of the patient tumor sample. For each copy number segment, the inferred timing is shown as a rectangle (exactly solved timing) or an arrow (upper bounds of timing when the timing solutions are not unique) with the same color-coding as its CN. The top panel shows the cumulative distribution (CDF) of the timing. Genome doubling (GD) can be observed as the punctuated gains occurring in a narrow time window, and chromosome 1q gains appear to be extremely early and preceding GD in these two tumors. (B) Recurrent early gains of chromosome 1q in BRCA (n = 38 tumor samples) and MEL (n = 37 tumor samples). For each tumor type, we converted the timing of gains into ranks for genomic bins within a patient and computed the rank sums across patients for each bin. The normalized rank sums for each genomic bin are shown for BRCA and MEL. The large negative values indicate recurrent early initiating gains. We used the normalized rank sums to test against the null hypothesis (no regions show recurrent early gain across patients). Bins from chromosome 1q reject this null for both tumor types (with 90% confidence level). (C) The timing of a gain compared to the frequency of its occurrence in BRCA (n = 38 tumor samples) and MEL (n = 37 tumor samples). The points on the plots show the timing of gain of a genomic bin versus its frequency of copy number gain. Colors represent chromosomal arms, and color darkness indicates the density of points. Both the timings and frequencies were transformed into normalized rank sums (see Methods). In total, 15 out of 21 BRCA patients and 24 out of 37 MEL patients exhibited arm-scale gains of chromosome 1q. (D) A pan-cancer analysis of mutual exclusivity between mutations in 25 commonly-mutated cancer genes and chromosome arm gain events. The complete results of this analysis are included in Table S1. (E) Mutual exclusivity and co-occurrence patterns between one representative chromosome gain (+13q, orange bars at the top), and point mutations in several different cancer driver genes.
Figure 2.
Figure 2.. Phenotypic effects of losing chromosome 1q-aneuploidy.
(A) Chromosomal engineering strategies for the targeted deletion of chromosome arms: (1) ReDACT-NS: using CRISPR-Cas9 homology-directed repair, we integrated a positive-negative selection cassette encoding a fluorescent reporter, a positive selection marker, and a negative selection marker (HSV thymidine kinase) at a centromere-proximal region on chromosome 1q. We induced arm loss by generating a dsDNA break centromere-proximal to the cassette with Cas9, and isolated clonal populations of cells that were ganciclovir-resistant. (2) ReDACT-TR: We induced arm loss by generating a dsDNA break at a centromere-proximal location with Cas9 while providing cells with an ectopic telomere seed sequence for repair. (3) ReDACT-CO: We induced arm loss by generating a dsDNA break at a centromere-proximal location with Cas9, and isolated clonal populations of cells. For all three approaches, we screened clonal populations of cells for targeted chromosome loss through TaqMan CNV assays and validated their karyotypes through SMASH sequencing. (B) Representative SMASH karyotypes of the 1q-disomic clones generated from the 1q-trisomic cancer cell lines A2780, AGS, and A2058. Chromosome 1q is highlighted in blue. A complete list of aneuploidy-loss clones and how they were generated is included in Table S3. (C) 1q-disomic clones display decreased RNA expression and protein expression of genes encoded on chromosome 1q. RNA expression data were obtained through bulk RNA-seq and represent the average expression of genes by chromosome arm across multiple 1q-disomic clones for each cell line. Protein expression data were obtained through mass spectrometry, and representative data from one 1q-disomic clone are shown for each cell line. Data are log2 transformed, normalized to the parental cell line, and adjusted so that the mean expression across all chromosomes is 0. (D) 1q-disomic clones exhibit decreased anchorage-independent growth. The micrographs display representative images of colony formation for 1q-trisomic and 1q-disomic clones. (E) 1q-disomic clones exhibit impaired xenograft growth in vivo. 1q-trisomic and 1q-disomic cells were injected contralaterally and subcutaneously into immunocompromised mice. The graphs display the mean ± SEM for each trial. Representative mice are shown on the right. (F) SMASH karyotype of a 1q-disomic clone generated from the mammary epithelial cell line MCF10A. Chromosome 1q is highlighted in blue. (G) 1q-disomic MCF10A clones transduced with HRASG12V exhibit decreased anchorage-independent growth relative to 1q-trisomic MCF10A cells. (H) 1q disomic MCF10A clones transduced with HRASG12V clones exhibit impaired xenograft growth in vivo. 1q-trisomic and 1q-disomic cells were injected contralaterally and subcutaneously into immunocompromised mice. The graphs display the mean ± SEM for each trial. Representative mice are shown below. For anchorage-independent growth assays in D and G, the boxplots represent the 25th, 50th, and 75th percentiles of colonies per field, while the whiskers represent the 10th and 90th percentiles. Unpaired t-test, n = 15 fields of view, data from representative trial (n ≥ 2 total trials). Representative images are shown below. Scale bars = 250 μm. **p < 0.005, ***p < 0.0005
Figure 3.
Figure 3.. Variable degrees of addiction to aneuploidy of chromosome 1q, 7p, and 8q.
(A) Representative SMASH karyotypes of the 1q-disomic, 7p-disomic, and 8q-disomic clones generated from the melanoma cell line A2058. Trisomy of chromosomes 1q, 7p, and 8q are highlighted in blue in the parental cell line on the left, and the respective targeted chromosome loss is highlighted in blue in the derived clones on the right. A complete list of aneuploidy-loss clones and how they were generated is included in Table S3. (B) 1q-disomic, 7p-disomic, and 8q-disomic clones in A2058 exhibit decreased RNA expression of genes encoded on the targeted chromosome. RNA expression data were obtained through bulk RNA-seq and represent the average expression of genes by chromosome arm across multiple aneuploidy-loss clones for each targeted chromosome. Data are log2 transformed, normalized to the parental cell line, and adjusted so that the mean expression across all chromosomes is 0. (C) 7p-disomic and 8q-disomic clones in A2058 exhibit a milder deficit in anchorage-independent growth as compared to 1q-disomic clones. The micrographs display representative images of colony formation for the indicated cell lines. (D) 7p-disomic and 8q-disomic clones in A2058 exhibit a moderate defect in xenograft growth. Wild-type (7p-trisomic and 8q-trisomic) cells and either 7p-disomic or 8q-disomic cells were injected contralaterally and subcutaneously into immunocompromised mice. The graphs display the mean ± SEM for each trial. Representative mice are shown on the right. (E) SMASH karyotype of an 8q-disomic clone generated from the colorectal cancer cell line HCT116. Chromosome 8q is highlighted in blue. (F) 8q-disomic clones in HCT116 exhibit decreased RNA expression of genes encoded on chromosome 8q. RNA expression data were obtained through bulk RNA-seq and represent the average expression of genes by chromosome arm across multiple aneuploidy-loss clones for each cell line. Data are log2 transformed, normalized to the parental cell line, and adjusted so that the mean expression across all chromosomes is 0. (G) 8q-disomic clones in HCT116 exhibit decreased anchorage-independent growth. The micrographs display representative images of colony formation for the indicated cell lines. (H) 8q-disomic clones in HCT116 exhibit variable xenograft growth. 8q-trisomic and 8q-disomic cells were injected contralaterally and subcutaneously into immunocompromised mice. The graphs display the mean ± SEM for each trial. Representative mice are shown below the graphs. For anchorage-independent growth assays in C and G, boxes represent the 25th, 50th, and 75th percentiles of colonies per field, while the whiskers represent the 10th and 90th percentiles. Unpaired t-test, n = 15 fields of view, data from representative trial (n ≥ 2 total trials). Representative images are shown below. Scale bars = 250 μm. ***p < 0.0005
Figure 4.
Figure 4.. Cancers rapidly recover chromosome 1q aneuploidy.
(A) A2058 1q-disomic cells frequently evolve to recover a third copy of chromosome 1q during xenograft growth. (B) Representative SMASH karyotypes of A2058 wildtype and 1q-disomic tumors. The initial karyotypes for these lines prior to the xenograft assay are shown on the left, and karyotypes of tumors following the xenograft assay are shown on the right. Chromosome 1q is highlighted in blue. (C) 1q-disomic clones that have evolved to regain 1q trisomy following xenograft growth exhibit increased anchorage-independent growth relative to the pre-xenograft 1q-disomic parental cells. (D) Variable evolution of 7p-disomic cells to recover a third copy of chromosome 7p during xenograft growth. (E) Variable evolution of 8q-disomic cells to recover a third copy of chromosome 8q during xenograft growth. (F) Regain of trisomy 1q occurs more frequently than regain of trisomy 7p or trisomy 8q. Tumors were classified as exhibiting regain if the mean copy number of the targeted chromosome was ≥ 2.5, as determined through TaqMan copy number assays. n = 213 tumors, chi-squared test. (G) HCT116 8q-disomic clones evolve to gain a copy of chromosome 12 during xenograft assays, resulting in the acquisition of an extra copy of the KRASG13D allele. Cell lines were rederived from tumors harvested at the endpoint of xenograft assays, and subjected to SMASH karyotyping and Sanger sequencing of KRAS. The xenograft growth curve is shown on the left, and representative SMASH karyotype profiles and Sanger sequencing chromatograms pre- and post-xenograft are shown on the right. Chromosome 8q is highlighted in blue and chromosome 12 is highlighted in green. (H) 8q-disomic clones that have evolved to acquire trisomy of chromosome 12 following xenograft growth exhibit increased anchorage-independent growth relative to the pre-xenograft 8q-disomic parental cells. For copy number profiling in A, D, and E, cell lines were rederived from tumors at the endpoint of the xenograft assays, and chromosome copy number was determined through TaqMan copy number assays. Mean ± SEM, n = 3 probes on targeted chromosome, data from representative trials are shown (n = 2 total trials). The corresponding xenograft assays are shown on the left. For the anchorage-independent growth assays in C and H, the boxes represent the 25th, 50th, and 75th percentiles of colonies per field, while the whiskers represent the 10th and 90th percentiles. Unpaired t-test, n = 15 fields of view, data from representative trial (n ≥ 2 total trials). Representative images are shown on the right. Scale bars = 250 μm. ***p < 0.0005
Figure 5.
Figure 5.. A single extra copy of MDM4 suppresses p53 signaling and contributes to the 1q trisomy addiction.
(A) GSEA analysis of A2780 RNA-seq data reveals upregulation of the p53 pathway in the 1q-disomic clones, relative to the parental trisomy. (B) A heatmap displaying the upregulation of 10 p53 target genes in A2780 1q-disomic clones. The TK+ clone indicates a clone that harbors the CRISPR-mediated integration of the HSV-TK transgene but that was not treated to induce chromosome 1q-loss. (C) Western blot analysis demonstrating activation of p53 signaling in 1q-disomic clones. GAPDH was analyzed as a loading control. The TK+ clone indicates a clone that harbors the CRISPR-mediated integration of the HSV-TK transgene but that was not treated to induce chromosome 1q-loss. (D) A waterfall plot highlighting the most-significant instances of mutual exclusivity between chromosome arm gains and mutations in cancer-associated genes. The complete dataset for mutual exclusivity and co-occurrence is included in Table S1. (E) Boxplots displaying the TP53-mutation phenocopy signature (45) in cancers from TCGA, split based on whether the cancers harbor a non-synonymous mutation in TP53. (F) A scatterplot comparing the association between chromosome arm gains and the TP53-mutation phenocopy signature (45) in TP53-wildtype cancers from TCGA. Cancers with chromosome 1q gains are highlighted in blue. (G) Boxplots displaying the TP53-mutation phenocopy signature (45) in cancers from TCGA, split based on whether tumors harbor a gain of chromosome 1q. Only TP53-wildtype cancers are included in this analysis. (H) Boxplots displaying the expression of three p53 target genes – CDKN1A (p21), RRM2B, and GADD45A – in cancers from TCGA split based on the copy number of chromosome 1q. Only TP53-wildtype cancers are included in this analysis. (I) A CRISPRi competition assay demonstrates that gRNAs targeting MDM4 drop out over time in A2780 cells. In contrast, gRNAs targeting AAVS1 and PIP5K1A, another gene encoded on chromosome 1q, exhibit minimal depletion. (J) A schematic displaying the strategy for using paired CRISPR gRNAs to delete a single copy of MDM4 in a cell line with a trisomy of chromosome 1q. (K) SMASH karyotype demonstrating maintenance of the chromosome 1q trisomy in an MDM4+/+/KO clone. Chromosome 1q is highlighted in blue. (L) 1q-disomic clones and MDM4+/+/KO clones in A2780 exhibit comparable upregulation of p53 transcriptional targets, as determined through TaqMan gene expression assays. (M) MDM4+/+/KO clones exhibit decreased anchorage-independent growth relative to the MDM4+/+/+ parental cell line. (N) Induction of MDM4 cDNA in 1q-disomic clones in A2780 increases anchorage-independent growth. For the graphs in E, G, H, M, and N, the boxplots represent the 25th, 50th, and 75th percentiles of the indicated data, while the whiskers represent the 10th and 90th percentiles of the indicated data. For the soft agar experiments in M and N, the data are from n = 15 fields of view, and a representative trial is shown (n ≥ 2 total trials). Scale bars = 250 μm. ***p < 0.0005
Figure 6.
Figure 6.. Gaining chromosome 1q increases sensitivity to UCK2 substrates.
(A) A schematic of the metabolism of two pyrimidine analogs, RX-3117 and 3-deazauridine. UCK2, a kinase encoded on chromosome 1q, phosphorylates these compounds to produce cytotoxic derivatives that can poison DNA and RNA synthesis. (B) Boxplots displaying the expression of UCK2 from the cancer cell line encyclopedia (left) and TCGA (right), divided based on the copy number of chromosome 1q. The boxplots represent the 25th, 50th, and 75th percentiles of the indicated data, while the whiskers represent the 10th and 90th percentiles of the indicated data. Data were analyzed using unpaired t-tests; n = 10,331 samples from TCGA and 942 samples from CCLE. (C) Expression of UCK2 protein in cancer cell lines with 1q trisomies or following aneuploidy-elimination. (D) Cellular sensitivity of A2780 and MCF10A treated with different concentrations of RX-3117 or 3-deazauridine. Mean ± SEM, data from representative trials are shown (n ≥ 3 total trials). (E) A schematic displaying cellular competition between trisomic and disomic cells. Under normal conditions, certain trisomies enhance cellular fitness, allowing these cells to overtake the population and enhance malignant growth (top). However, treatment with an “anti-trisomy” compound could selectively impair the growth of the aneuploid cells, keeping the population in a low-malignant state (bottom). (F) A cellular competition between fluorescently-labeled MCF10A 1q-trisomic and unlabeled 1q-disomic cells. These cells were mixed at a ratio of 20% to 80% and then cultured in either DMSO or 3-deazauridine. While the trisomic cells quickly dominate the population in drug-free medium, treatment with 3-deazauridine prevents the outgrowth of the 1q-trisomic subpopulation. Data from representative trial are shown (n = 2 total trials). *p < 0.05, ** p < 0.005, *** p < 0.0005

Update of

Comment in

References

    1. Taylor AM, Shih J, Ha G, Gao GF, Zhang X, Berger AC, Schumacher SE, Wang C, Hu H, Liu J, Lazar AJ, Cherniack AD, Beroukhim R, Meyerson M, Genomic and Functional Approaches to Understanding Cancer Aneuploidy. Cancer Cell. 33, 676–689.e3 (2018). - PMC - PubMed
    1. Gordon DJ, Resio B, Pellman D, Causes and consequences of aneuploidy in cancer. Nat. Rev. Genet 13, 189–203 (2012). - PubMed
    1. Boveri T, Concerning the Origin of Malignant Tumours by Theodor Boveri. Translated and annotated by Henry Harris. J. Cell Sci 121, 1–84 (2008). - PubMed
    1. Hardy PA, Zacharias H, Reappraisal of the Hansemann-Boveri hypothesis on the origin of tumors. Cell Biol. Int 29, 983–992 (2005). - PubMed
    1. Vasudevan A, Schukken KM, Sausville EL, Girish V, Adebambo OA, Sheltzer JM, Aneuploidy as a promoter and suppressor of malignant growth. Nat. Rev. Cancer 21, 89–103 (2021). - PubMed