. 2023 Jul 20;186(15):3277-3290.e16.
doi: 10.1016/j.cell.2023.06.001. Epub 2023 Jun 7.

Dispersal patterns and influence of air travel during the global expansion of SARS-CoV-2 variants of concern

Affiliations

Dispersal patterns and influence of air travel during the global expansion of SARS-CoV-2 variants of concern

Houriiyah Tegally et al. Cell. .

Abstract

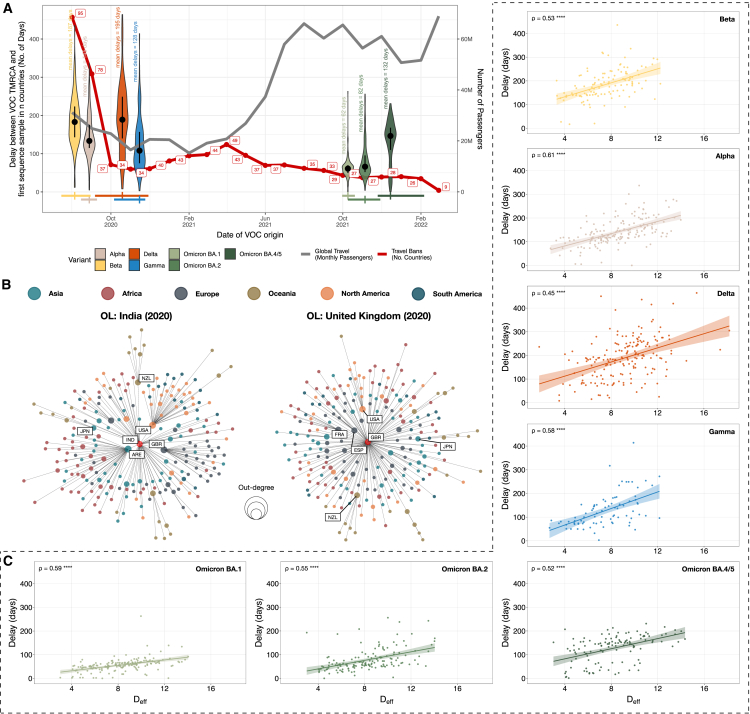
The Alpha, Beta, and Gamma SARS-CoV-2 variants of concern (VOCs) co-circulated globally during 2020 and 2021, fueling waves of infections. They were displaced by Delta during a third wave worldwide in 2021, which, in turn, was displaced by Omicron in late 2021. In this study, we use phylogenetic and phylogeographic methods to reconstruct the dispersal patterns of VOCs worldwide. We find that source-sink dynamics varied substantially by VOC and identify countries that acted as global and regional hubs of dissemination. We demonstrate the declining role of presumed origin countries of VOCs in their global dispersal, estimating that India contributed <15% of Delta exports and South Africa <1%-2% of Omicron dispersal. We estimate that >80 countries had received introductions of Omicron within 100 days of its emergence, associated with accelerated passenger air travel and higher transmissibility. Our study highlights the rapid dispersal of highly transmissible variants, with implications for genomic surveillance along the hierarchical airline network.

Keywords: SARS-CoV-2; genomics; global dispersal; mobility; phylogenetics; phylogeography; travel; variants.


Conflict of interest statement

Declaration of interests K.K. is the founder of BlueDot, a social enterprise that develops digital technologies for public health. C.H. is employed at BlueDot.

Figures

None
Graphical abstract
Figure 1
Figure 1
Spatiotemporal dispersal patterns of VOCs Global dissemination and continental source-sink dynamics for each VOC, determined from ancestral state reconstruction analysis. Virus lineage exchanges are aggregated at the sub-continental level, and curves linking any two locations are colored according to the mean dates of all viral movements inferred along this route. Sub-continental level denominations vary by region, where in some regions they denote countries (e.g., the US and Canada in North America), whereas in others they denote groups of countries (e.g., western Europe). The curves denote the direction of movement in an anti-clockwise direction. Circles are drawn proportional to the number of exports per sub-continental location. Source and sink continents are determined by calculating the net difference between viral exportation and importation events. The absolute numbers of exportation and importation events for each continent per VOC are shown in Figures S3B and S3C.
Figure 2
Figure 2
Regional and global dissemination hubs of VOCs Largest global and regional contributors to viral exports, stratified by VOC. Countries are shown here if they contribute >0.1% of exports globally or within Europe, or >0.5% within other regions.
Figure S1
Figure S1
Viral sampling, introductions, and exportations for various VOCs over time, related to Figure 1 (A) Connectivity matrix representing the number of VOC-specific exports between continents with a monthly temporal resolution. The number of exports is inferred from case-sensitive phylogeographic analysis (see STAR Methods for details). (B) Graphs show the time-varying progression of the numbers of sampled genomes in our analysis compared with the numbers of inferred introductions and exportations for Alpha, Beta, Gamma, Delta, Omicron BA.1, and Omicron BA.2 per continent.
Figure S2
Figure S2
Alpha, Beta, and Gamma global distributions, related to Figure 1 Maps show countries colored by their share of total global Alpha (A), Beta (B), or Gamma (C) incidence.
Figure S3
Figure S3
Correlations of incidence and travel to inferred VOC exportation numbers, related to Figures 1 and 2 (A) Graphs show scatter plots and regression lines denoting the numbers of variant-specific cases, volumes of air travel passengers, and inferred numbers of VOC exportations for each country Spearman rank correlation values are shown, with the level of significance indicated. (B) The net difference between viral exportation and importation events. (C) The absolute numbers of exportation and importation events for each continent per VOC. (D) Correlation of contribution of global viral exportation events and outgoing travel from countries. Graph shows a scatter plot and regression line denoting the share of each country’s contribution to global numbers of inferred exportations for all VOCs and the total number of outgoing air travel passengers from 2020 to 2022. The Spearman rank correlation value is shown, with the level of significance indicated. The outliers are primarily southern African countries, with global contributions to viral exports comparable to some small European and Asian countries but with visibly lower total outgoing passenger volumes. This can be attributed to the Beta variant, which primarily circulated in southern Africa. The outlier southern African countries shown in this figure likely made significant contributions to Beta exports globally despite their relatively lower connectivity.
Figure 3
Figure 3
Inferred origins of global VOC dissemination events (A) Changes in proportions of all inferred introductions from the country of presumed origin for each VOC (bars) and the number of countries inferred to be acting as onward sources of each VOC (purple line, with scale in the second y axis). Results shown are determined from 10 replicates of genome subsampling. Error bars indicate standard deviation. (B) Date of first inferred introduction per country, shown as circles, colored by location of origin, i.e., presumed origin (blue) or not (orange). The y axis represents countries, which are ranked and labeled by the median of their dates of first introduction (from 10 replicates). The lower x axis denotes the delay between the estimated median TMRCA (with confidence interval range dates shown for each VOC, as reported in published studies1,2,3,6,8,26). The bars on the right side of each panel represent the cumulative population where the variant has been reported, calculated as the sum of the country populations that have observed introductions up to that point.
Figure 4
Figure 4
Impact of global air travel on VOC dissemination (A) Delay (number of days since TMRCA) of each VOC to be first sampled in countries around the world, total global monthly air passenger volumes from September 2020 to March 2022, and the number of countries with active travel bans in the same period (data are sourced from the Oxford COVID-19 Government Response Tracker project [https://github.com/OxCGRT/covid-policy-tracker], where countries with international travel controls of levels 3 or 4 were counted as having travel bans in place). The corresponding mean of each violin plot is shown. The dot and error bars inside each group denote the median and interquartile range, respectively. Dates of VOC origin are taken as their published mean estimated dates of emergence (TMRCA), with crosses representing the median and high confidence range values.,,,,, The date of arrival of each VOC per country is taken to be the first sampling date of a sequenced case in GISAID (date of access: 18 September 2022). (B) The shortest path tree constructed using global air traffic data from Oct-2020, with India (left) and the United Kingdom (right) as the presumed origin location (OL). Each node represents a country and is colored according to the continent. The radial distance of each node from the presumed OL along the connecting branches represents the effective distance Deff. The radius of each node scales with the number of descendant nodes (out-degree). (C) Scatterplot and Spearman’s rank correlation coefficient of the effective distance Deff against delay in first sampling of VOCs in countries globally. The correlation coefficient is indicated for each VOC, with the level of significance indicated by the number of asterisks. A best-fit line is shown for each VOC, with the shaded band indicating 95% confidence interval.
Figure S4
Figure S4
Global dissemination of the Alpha and Delta variants in effective distance space, related to Figure 4 (A) The sequence of panels shows the first sampling of the Alpha variant in different countries along the shortest path tree, with the United Kingdom (GBR) as the presumed origin location (OL). Radial distance of each node from the central node represents the effective distance, Deff, from the presumed OL. Each node represents a country and is colored according to whether a sequence of the Alpha variant has been sampled (red) or not (dark gray). Light gray nodes represent countries with either no sampled sequences that are of the Alpha variant or countries that are not connected to the presumed OL in the air traffic network. (B) The sequence of panels shows the first sampling of the Delta variant in different countries along the shortest path tree, with India (IND) as the presumed origin location (OL). Radial distance of each node from the central node represents the effective distance, Deff, from the presumed OL. Each node represents a country and is colored according to whether a sequence of the Delta variant has been sampled (red) or not (dark gray). Light gray nodes represent countries with either no sampled sequences that are of the Delta variant or countries that are not connected to the presumed OL in the air traffic network.
Figure S5
Figure S5
Comparison of global air traffic networks observed in Oct-2020 and Oct-2021, related to Figure 4 Each row of panels corresponds to a presumed origin location associated with one of the VOCs. (Left) Effective distances calculated from global air traffic data observed in Oct-2020 versus Oct-2021. Each black dot represents a country; the red dashed line represents the expected positions of these countries had the air traffic network remained unchanged between 2020 and 2021. (Middle and right) Shortest path trees constructed from the global air traffic observed in Oct-2020 and Oct-2021, respectively. Each circle represents a country, colored according to its corresponding continent. Central red circle represents the presumed origin location. Radial distance of each node from the central node represents the effective distance from the presumed origin location.
Figure S6
Figure S6
Sensitivity analyses of effective distances, related to Figure 4 (A) Correlation between air passenger flow and effective distances. Log of number of air passengers traveling directly from the presumed origin location (OL) to each country versus effective distance, Deff, calculated from the global air traffic network relevant to each VOC. Number of countries with no observed direct passenger flow from the presumed OL is indicated in each panel. (B and C) Sensitivity analysis of the United Arab Emirates as a secondary transit hub in the global dissemination of the Delta variant. (B) Effective distance before versus after the United Arab Emirates (ARE) is removed as an intermediate node in the air traffic network. Orange circles represent countries that are descendants of ARE in the shortest path tree, i.e., countries with shortest path that traverses from India through ARE. Black crosses represent countries that are not descendants of ARE and therefore have an effective distance that is unaffected by the removal of ARE. (C) Shortest path tree before (left) and after (right) the removal of ARE as an intermediate node. Highlighted nodes represent countries that are descendants of ARE prior to the removal. Red node at the center represents India, the presumed origin location of the Delta variant.
Figure 5
Figure 5
Continental epidemiology of SARS-CoV-2 cases, mortality, testing, and vaccination (A) The progression of daily reported cases per continent from February 2020 to October 2022 (log scale, first y axis). The 7-day rolling average of daily reported case numbers is colored by the inferred proportion of variants responsible for the infections, as calculated by genomic surveillance data (GISAID date of access: 1 October 2022) averaged over 20 days. The line shows the 7-day rolling average of the number of daily tests per thousand population per region (scale shown in the second y axis) aggregated for countries for which these data are available for each continent. (B) The 7-day rolling average of daily reported deaths colored by the inferred proportion of variants, as calculated for case data, with an assumption of time lag of 20 days between infection and death applied (see more details in method details). The dashed line displays the proportion of people fully vaccinated per region (scale on second y axis), where those that received all doses prescribed by the initial vaccination protocol are considered fully vaccinated.
Figure S7
Figure S7
Methodology sensitivity analysis, related to STAR Methods (A–C) Genomic counts and proportions, or presumed origin country vs. other countries for Alpha, Beta, and Gamma, when genomic subsampling is performed either proportional to VOC-specific case counts or VOC-specific deaths. This comparison was performed to ascertain potential biases in testing rates in the resulting sampling proportions. We found that the sampling proportions for each country remains consistent whichever strategy is used and opt to perform the rest of the analysis with case sampling. (D and E) Justification for the use of evolutionary rates. Graphs show the range of 90% maximum posterior region of inferred node dates (in number of days) and the confidence of reconstructed node states as proxies for robustness of inference, either as an averaged measure for all nodes or by node number, from deepest nodes for the adjusted evolutionary rate vs. the standard evolutionary rate. Results are shown for one phylogenetic reconstruction of Delta and Omicron BA.1 datasets.
Figure S8
Figure S8
VOC introduction dates per country, shown either as the first sequenced date on GISAID or the date of first inferred introduction from our phylogenetic analysis, related to discussion The first sequenced dates are shown as a red circle, and the first inferred introductions are shown either in dark gray if they happen after the first sequenced date or light gray if it happens before. If the first inferred introduction happens after the first sequenced sample, it means that there had already been introductions of the variant much before the introductions that successfully seeded epidemic growth in respective countries. For instance, this is predominantly the case for Delta, where it is known that the variant was spreading before observable epidemic growth (due to still ongoing waves of Alpha, Beta, and Gamma locally). If, on the contrary, the first inferred introduction is estimated to be before the first sequenced sample, then it means that the respective country had not yet detected the variant by the time epidemic growth had already been seeded. This is shown to be the case for several of the countries that received the earliest introductions of Alpha, Beta, Gamma, and the Omicron subvariants, demonstrating a lag between detection by genomic sequencing and epidemic expansion of variants.

Update of

References

    1. Hill V., Du Plessis L., Peacock T.P., Aggarwal D., Colquhoun R., Carabelli A.M., Ellaby N., Gallagher E., Groves N., Jackson B., et al. The origins and molecular evolution of SARS-CoV-2 lineage B.1.1.7 in the UK. Virus Evol. 2022;8:veac080. doi: 10.1093/ve/veac080. - DOI - PMC - PubMed
    1. Tegally H., Wilkinson E., Giovanetti M., Iranzadeh A., Fonseca V., Giandhari J., Doolabh D., Pillay S., San E.J., Msomi N., et al. Detection of a SARS-CoV-2 variant of concern in South Africa. Nature. 2021;592:438–443. doi: 10.1038/s41586-021-03402-9. - DOI - PubMed
    1. Faria N.R., Mellan T.A., Whittaker C., Claro I.M., Candido D.D.S., Mishra S., Crispim M.A.E., Sales F.C.S., Hawryluk I., McCrone J.T., et al. Genomics and epidemiology of the P.1 SARS-CoV-2 lineage in Manaus, Brazil. Science. 2021;372:815–821. doi: 10.1126/science.abh2644. - DOI - PMC - PubMed
    1. Tao K., Tzou P.L., Nouhin J., Gupta R.K., de Oliveira T., Kosakovsky Pond S.L., Fera D., Shafer R.W. The biological and clinical significance of emerging SARS-CoV-2 variants. Nat. Rev. Genet. 2021;22:757–773. doi: 10.1038/s41576-021-00408-x. - DOI - PMC - PubMed
    1. Volz E., Mishra S., Chand M., Barrett J.C., Johnson R., Geidelberg L., Hinsley W.R., Laydon D.J., Dabrera G., O’Toole Á., et al. Assessing transmissibility of SARS-CoV-2 lineage B.1.1.7 in England. Nature. 2021 doi: 10.1038/s41586-021-03470-x. - DOI - PubMed

Publication types

Supplementary concepts