. 2023 Jul 20;186(15):3166-3181.e18.
doi: 10.1016/j.cell.2023.06.003. Epub 2023 Jul 5.

Human embryo live imaging reveals nuclear DNA shedding during blastocyst expansion and biopsy

Affiliations

Human embryo live imaging reveals nuclear DNA shedding during blastocyst expansion and biopsy

Ana Domingo-Muelas et al. Cell. .

Abstract

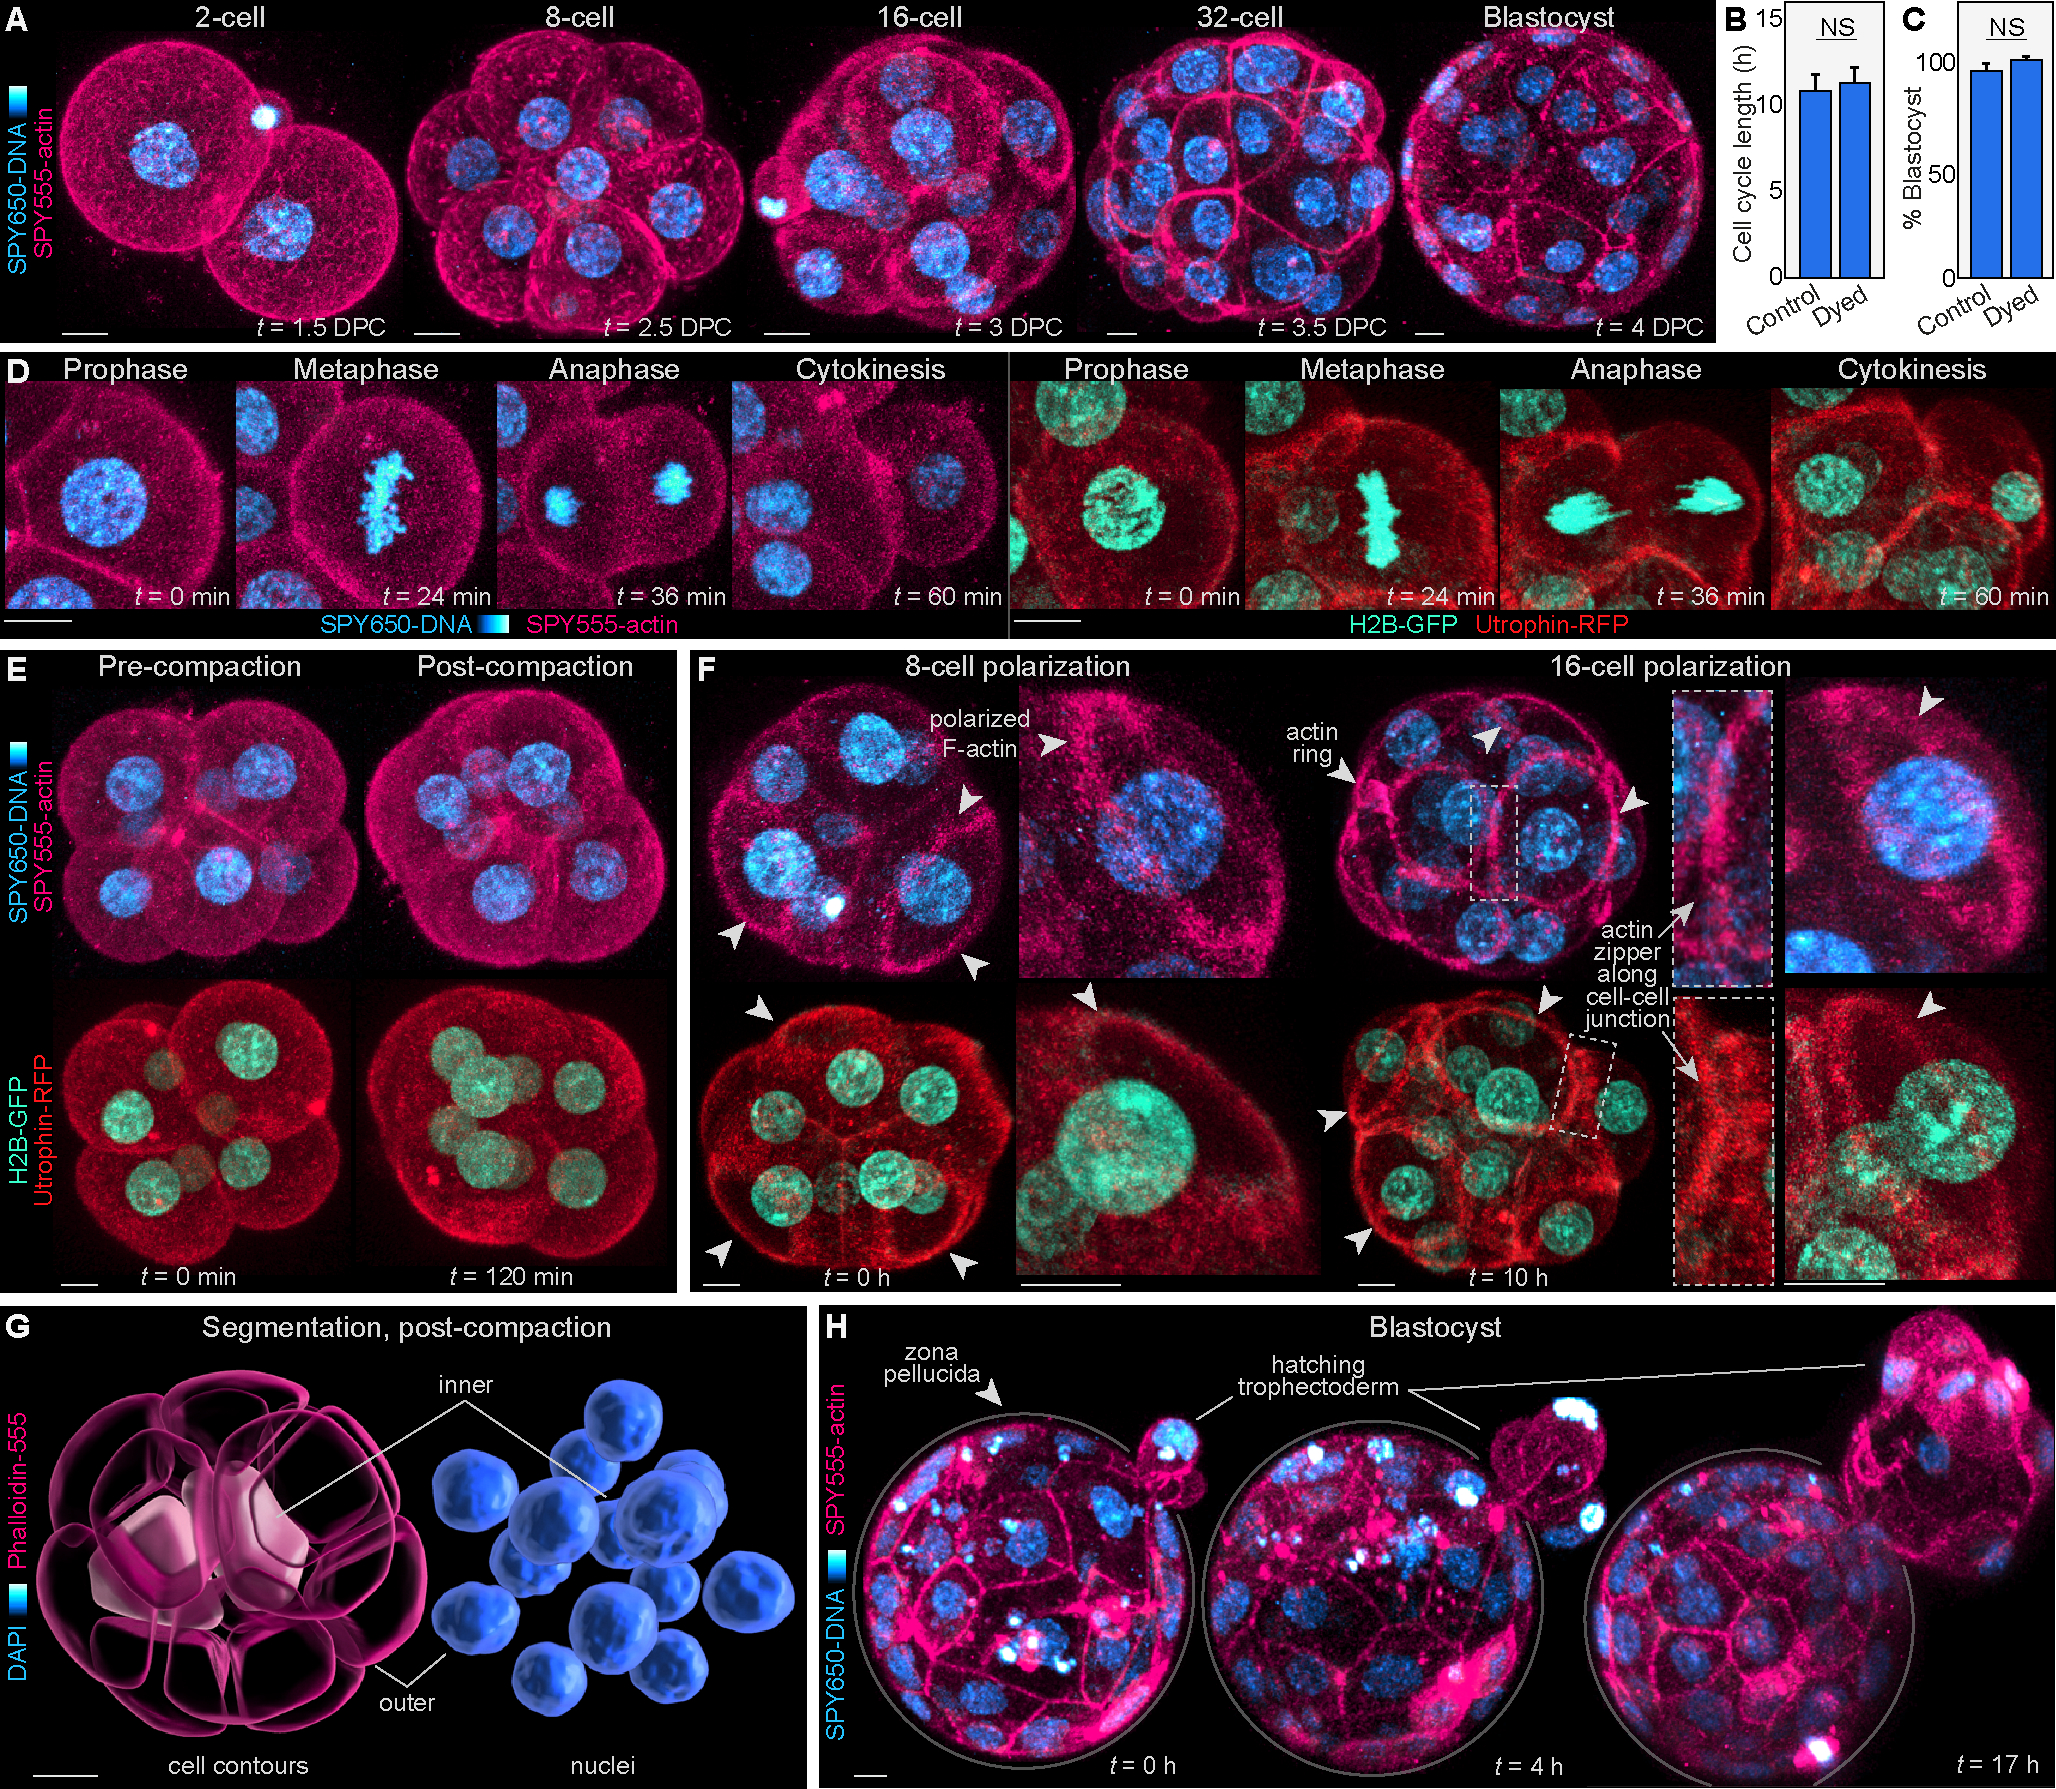
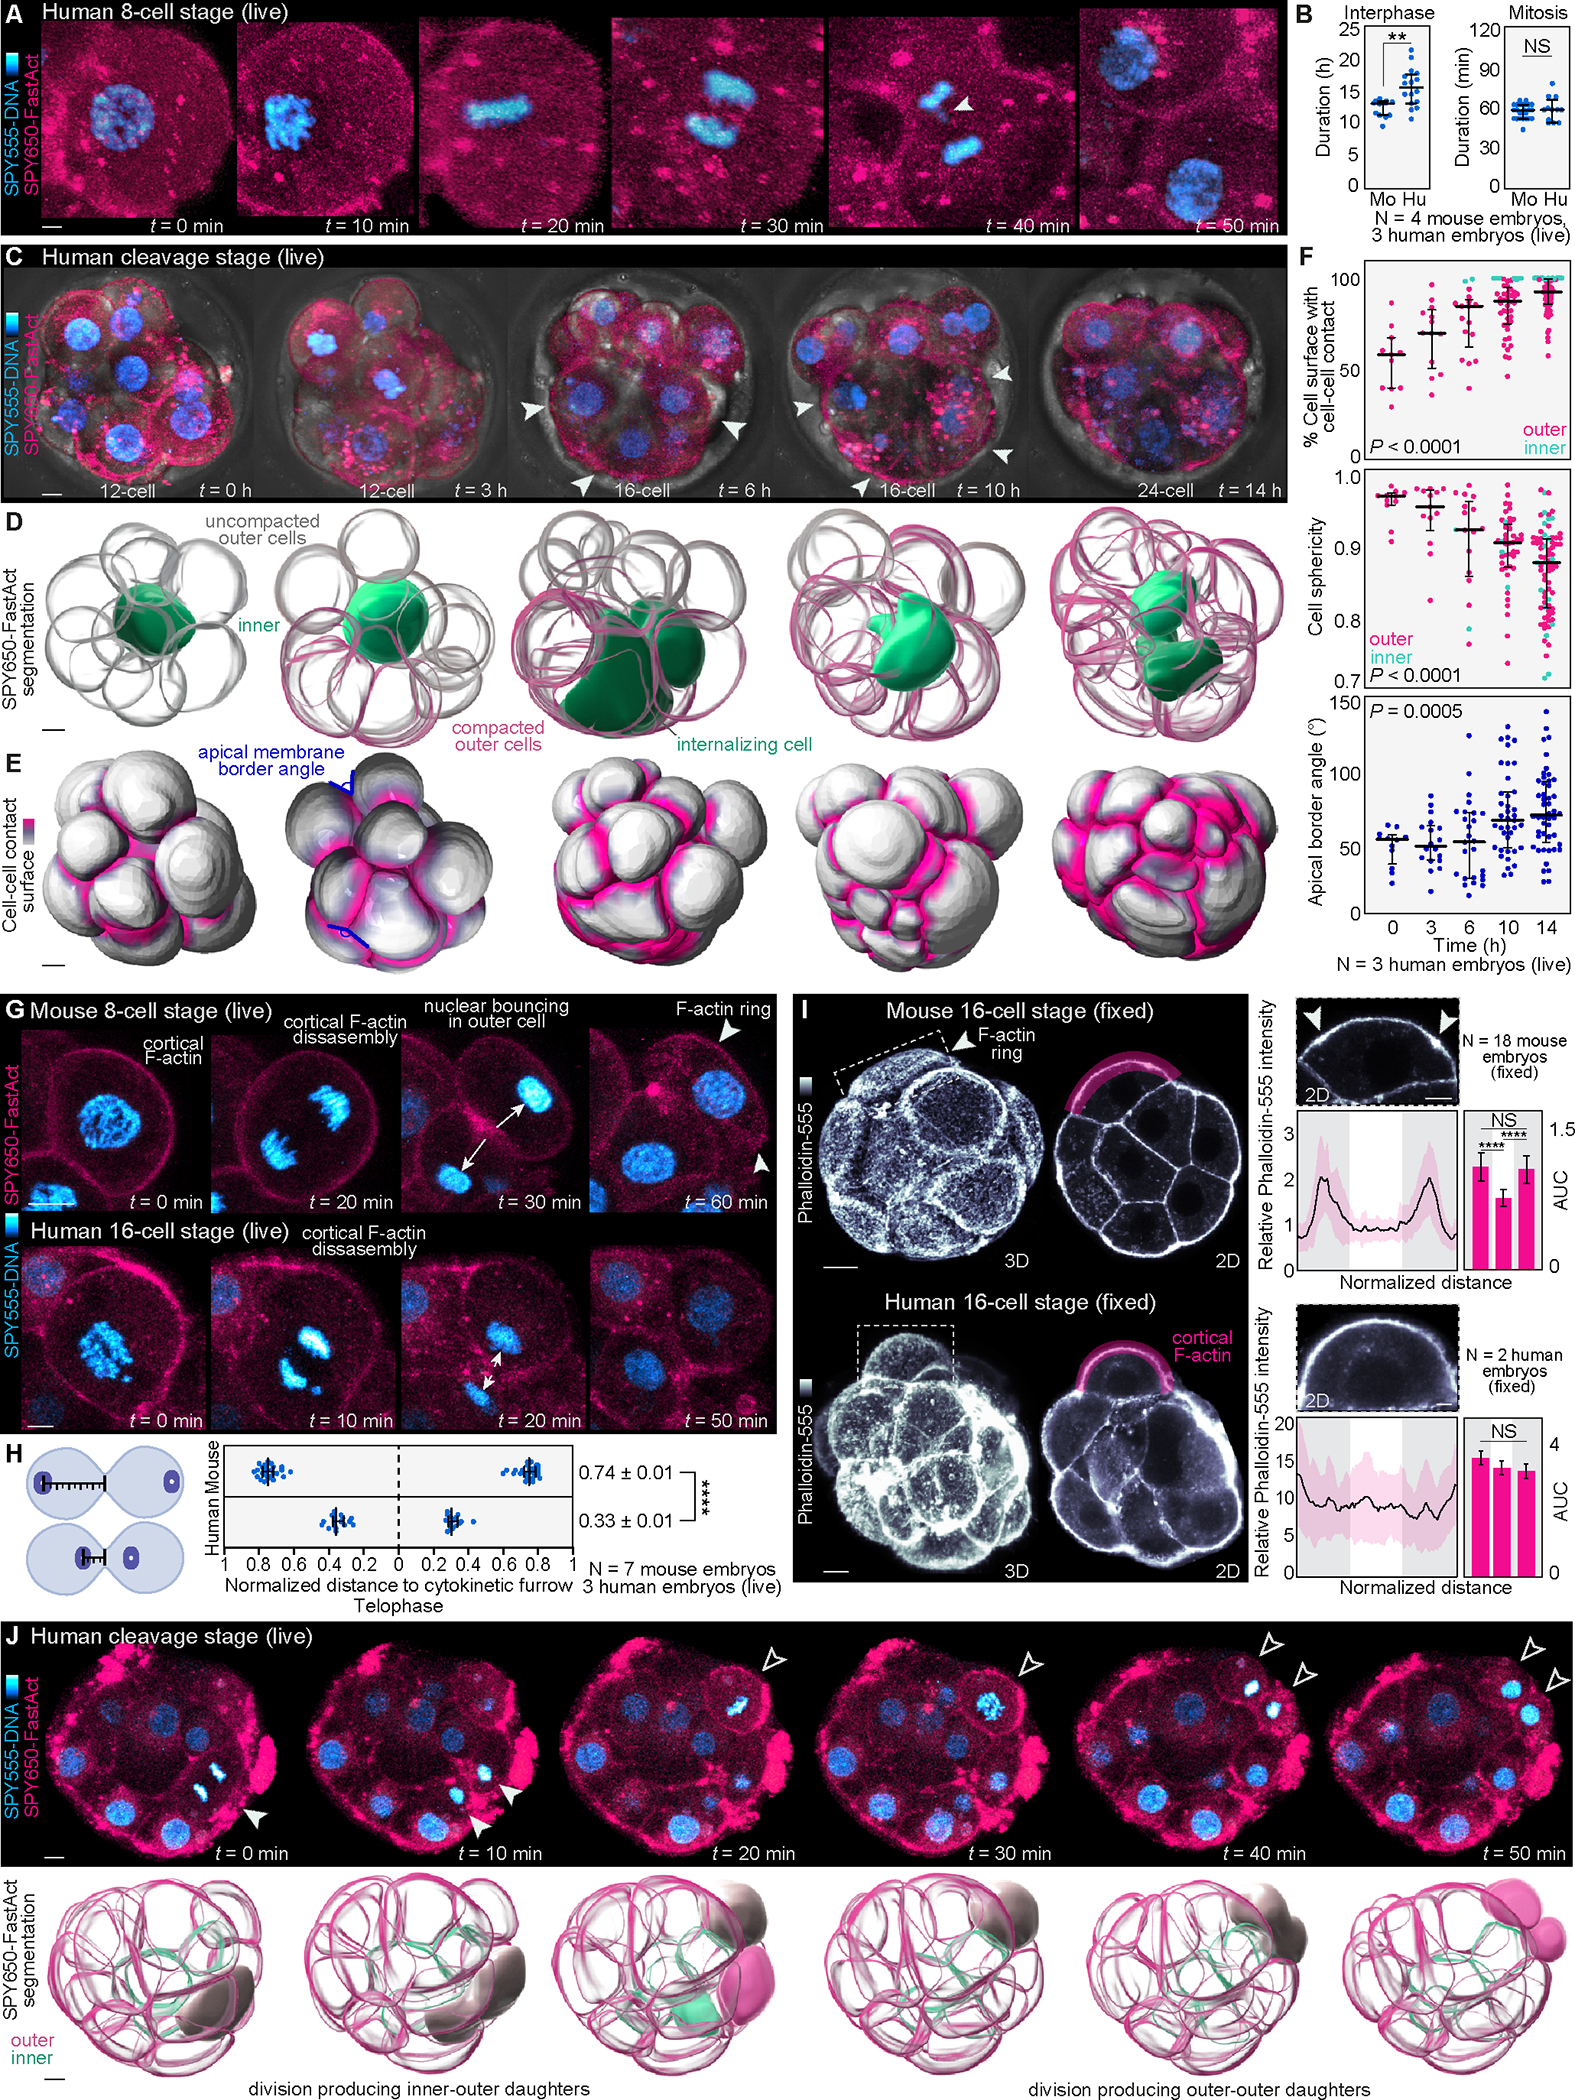
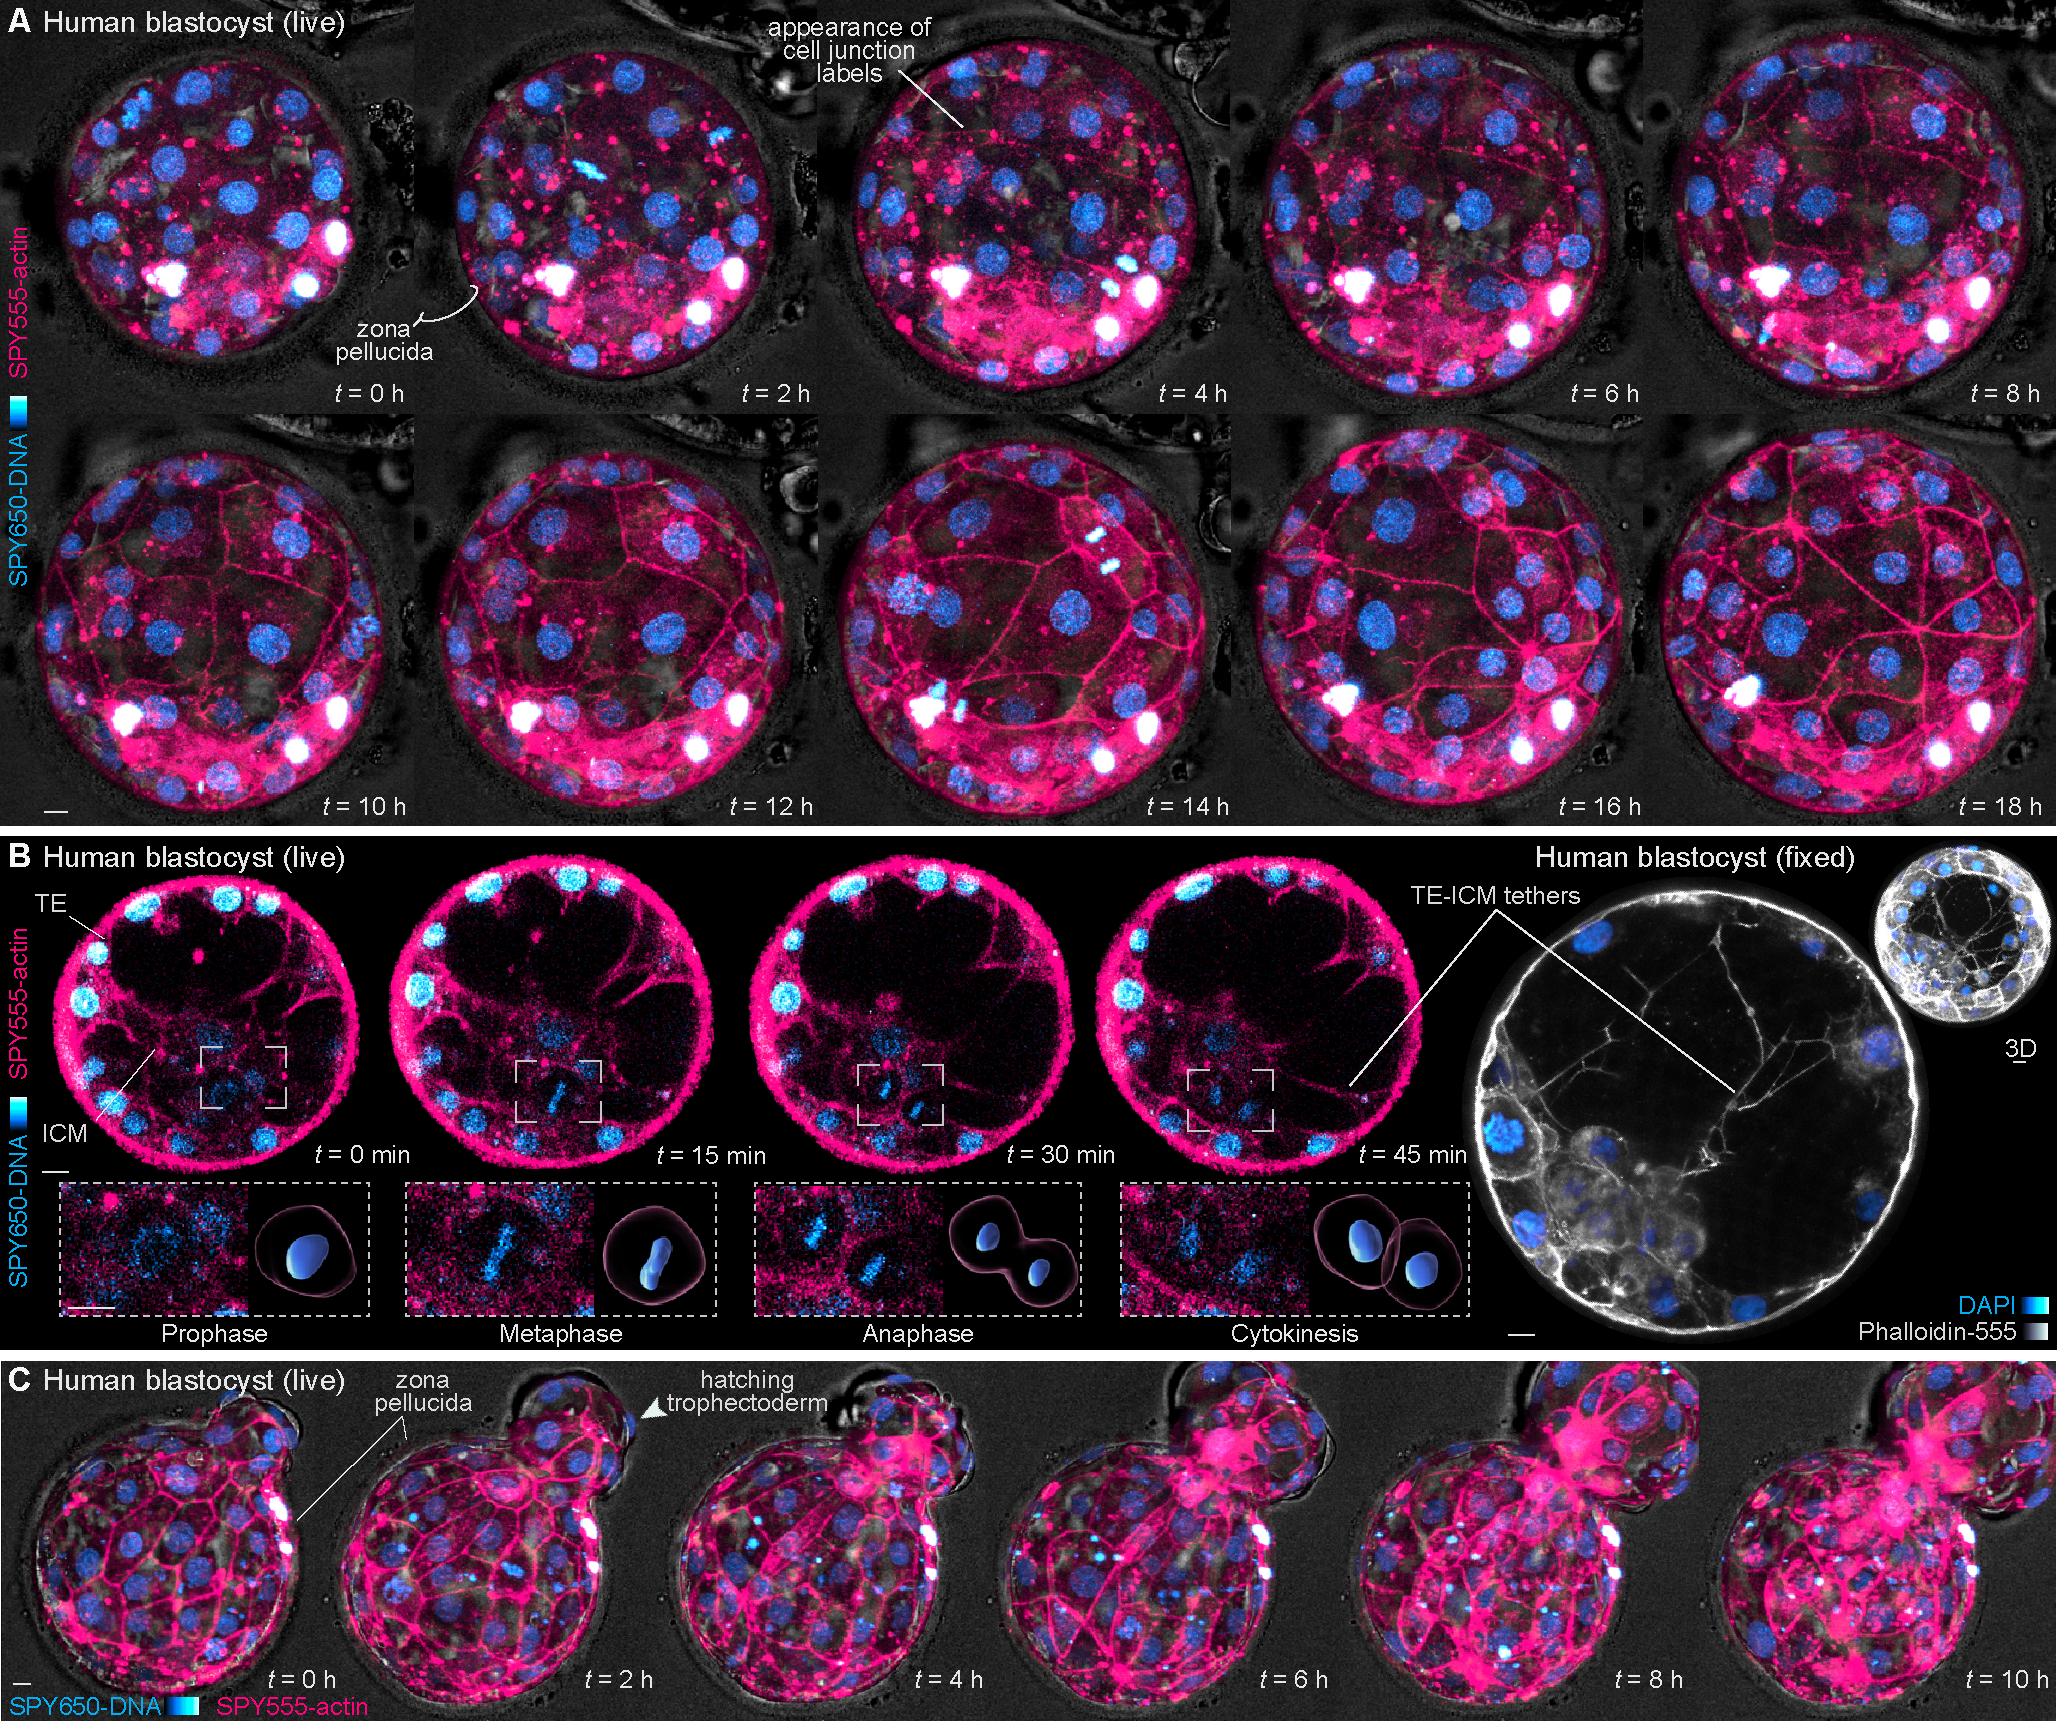
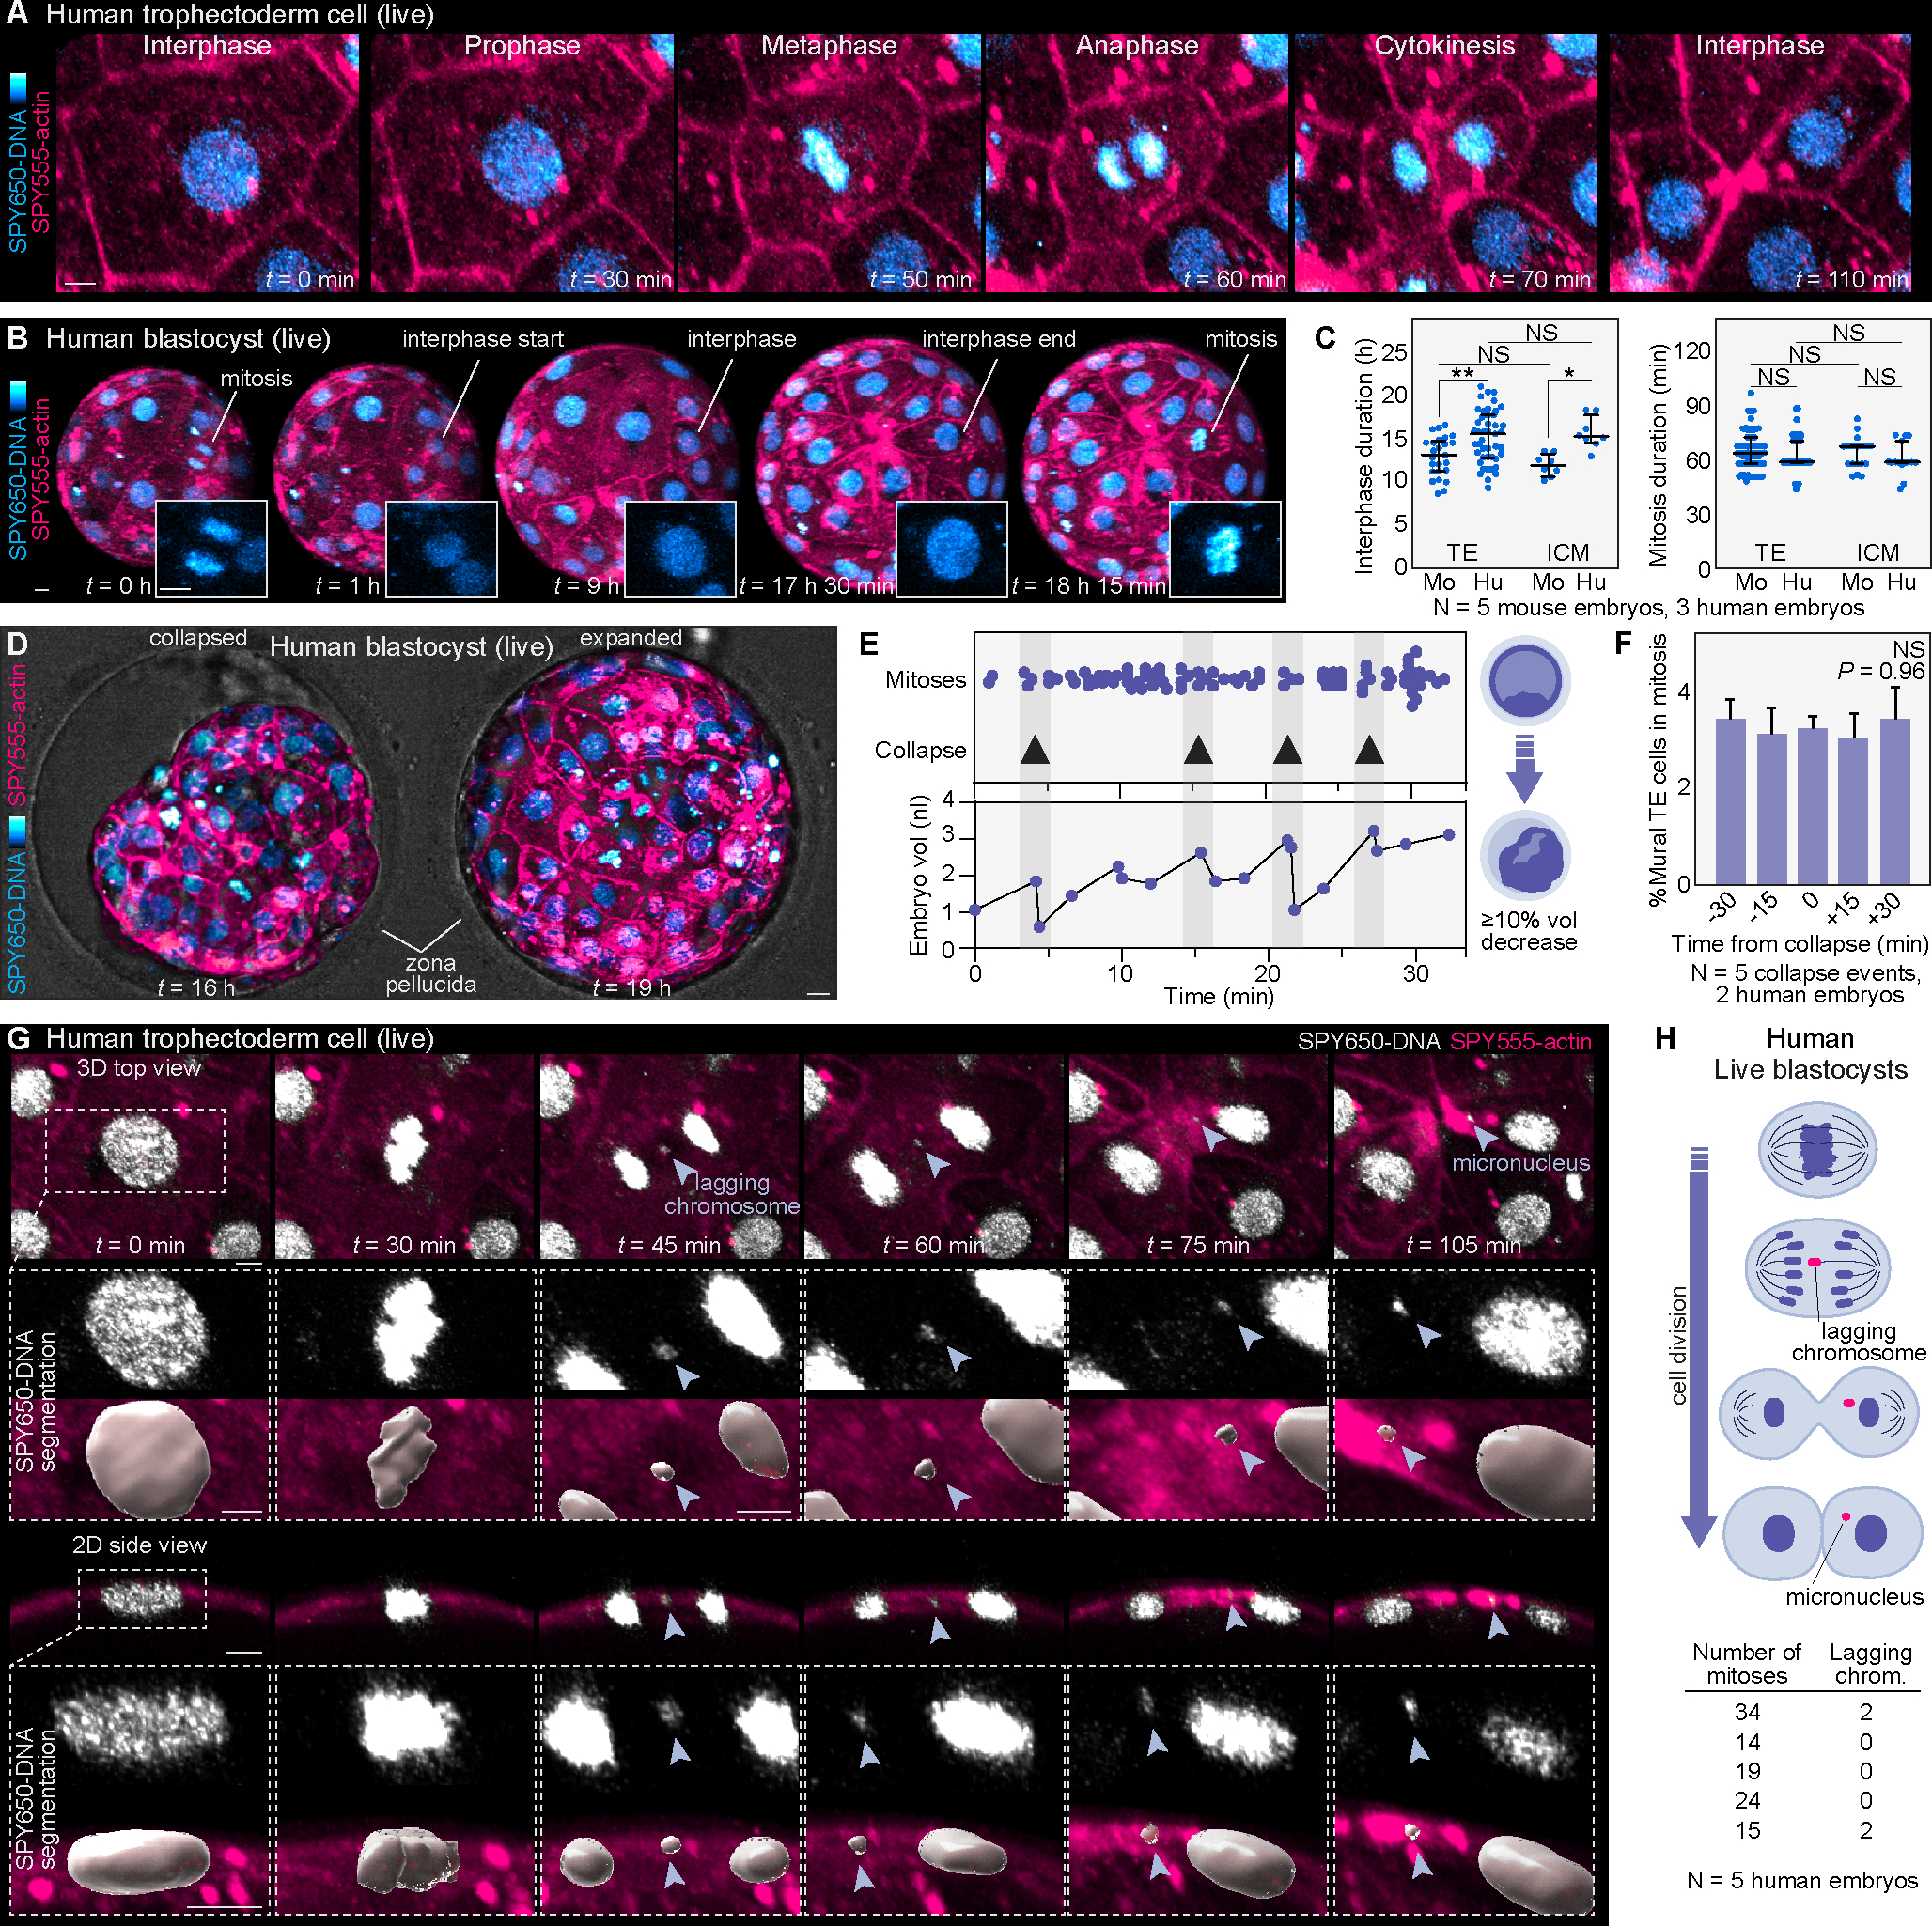
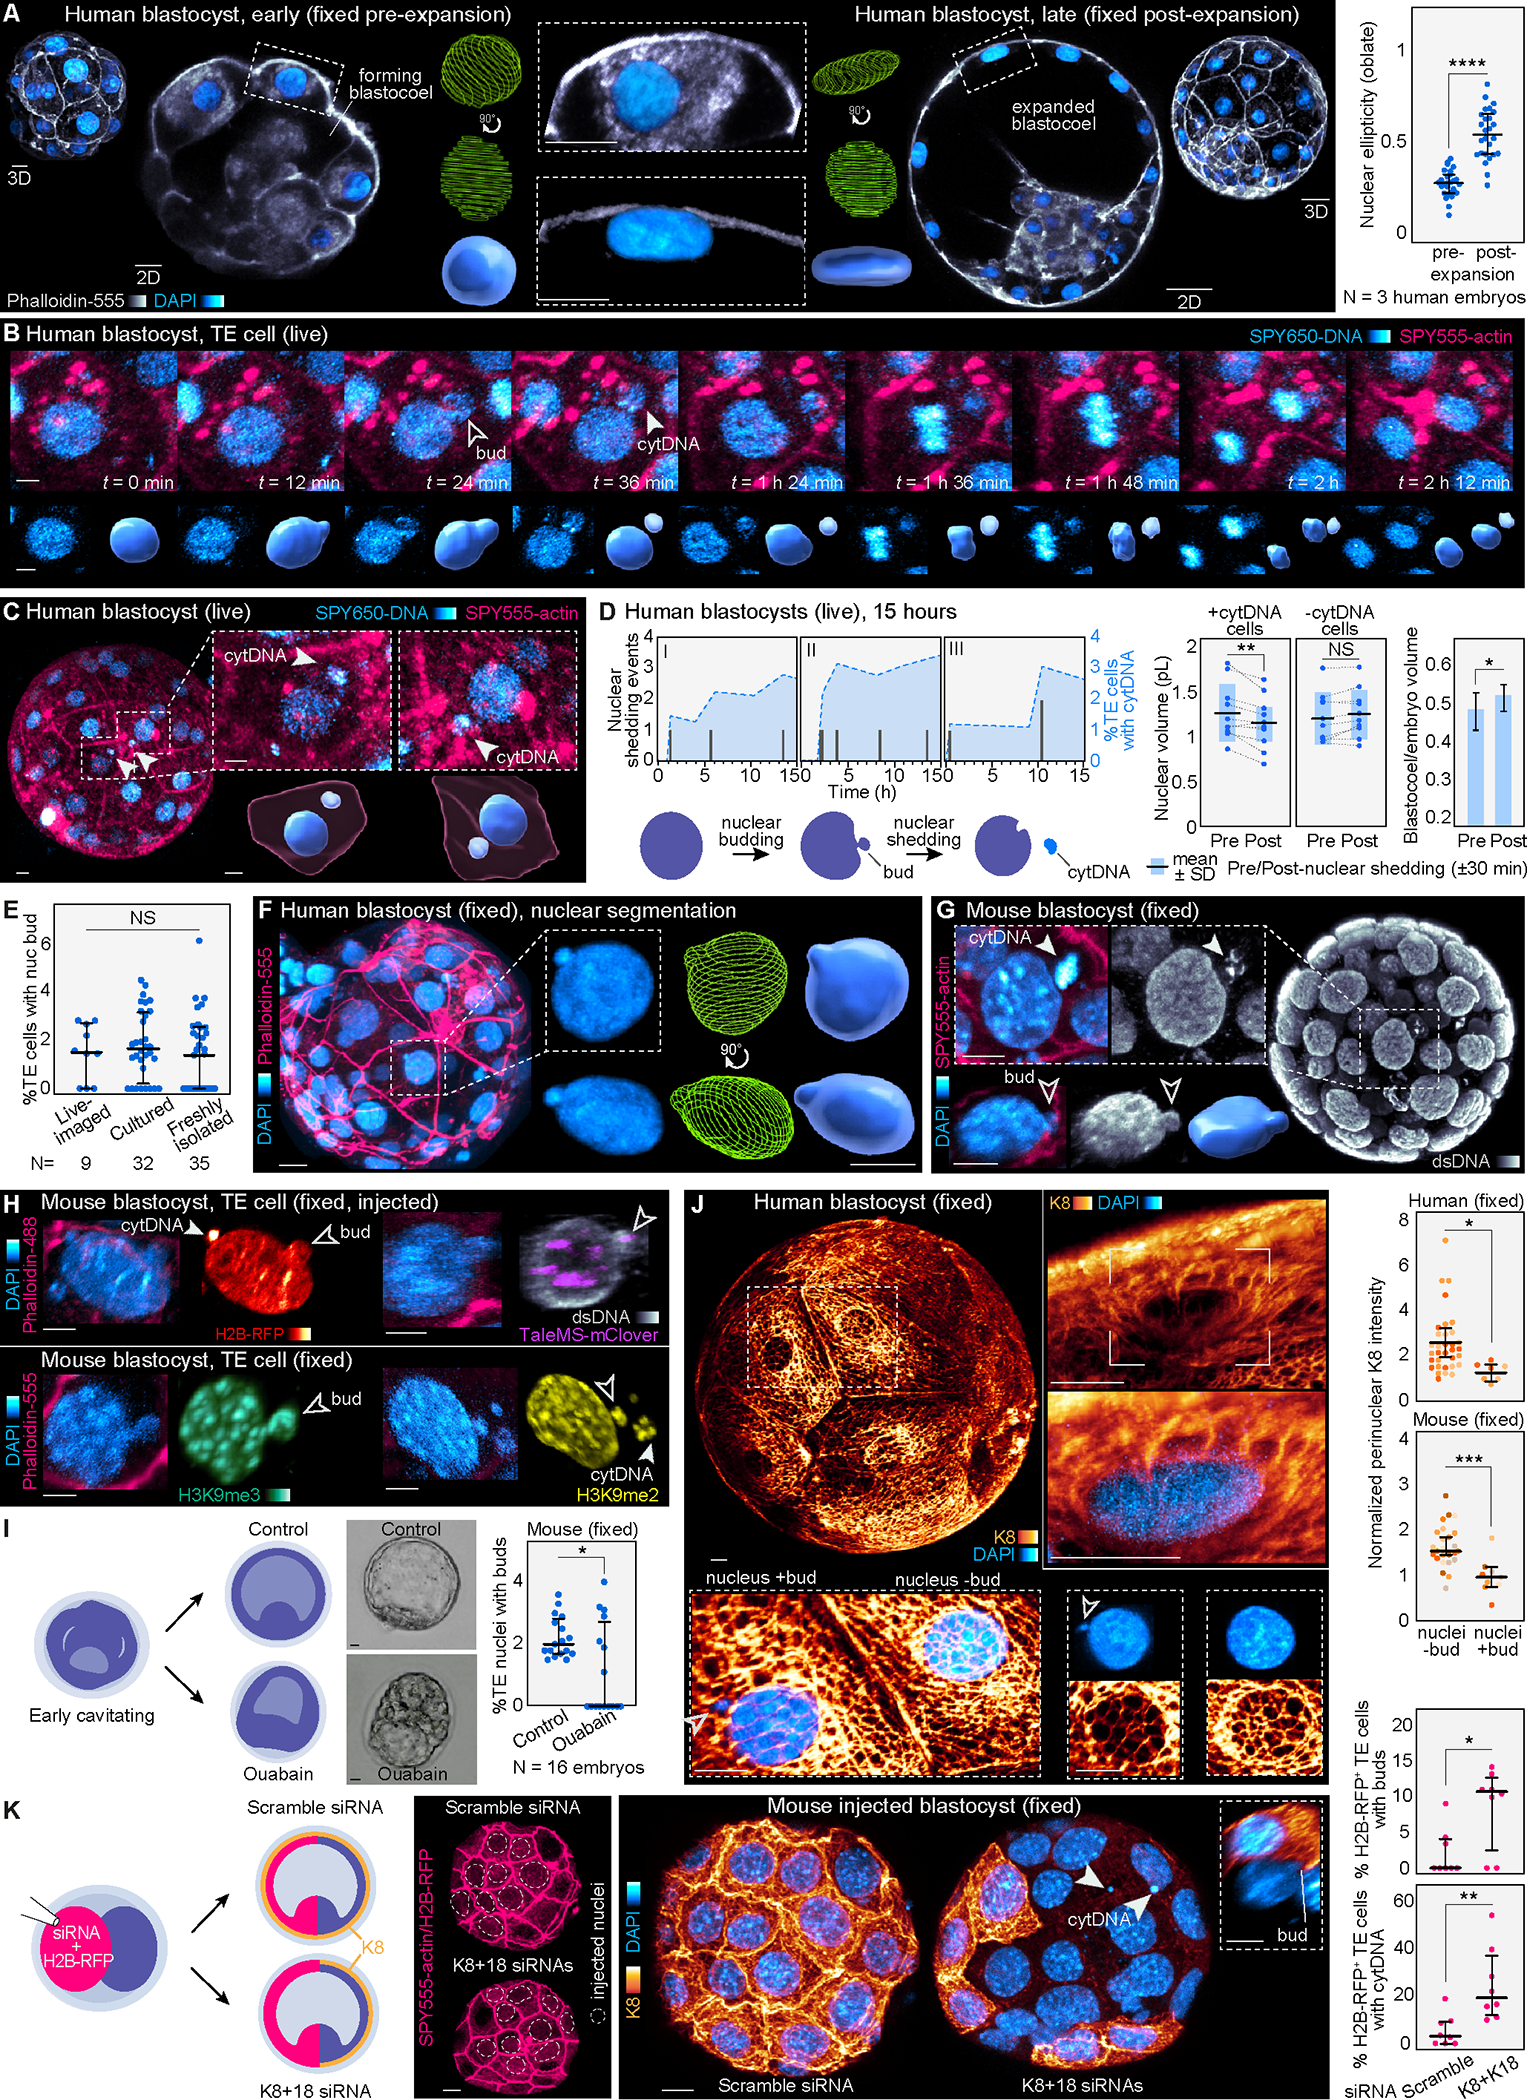
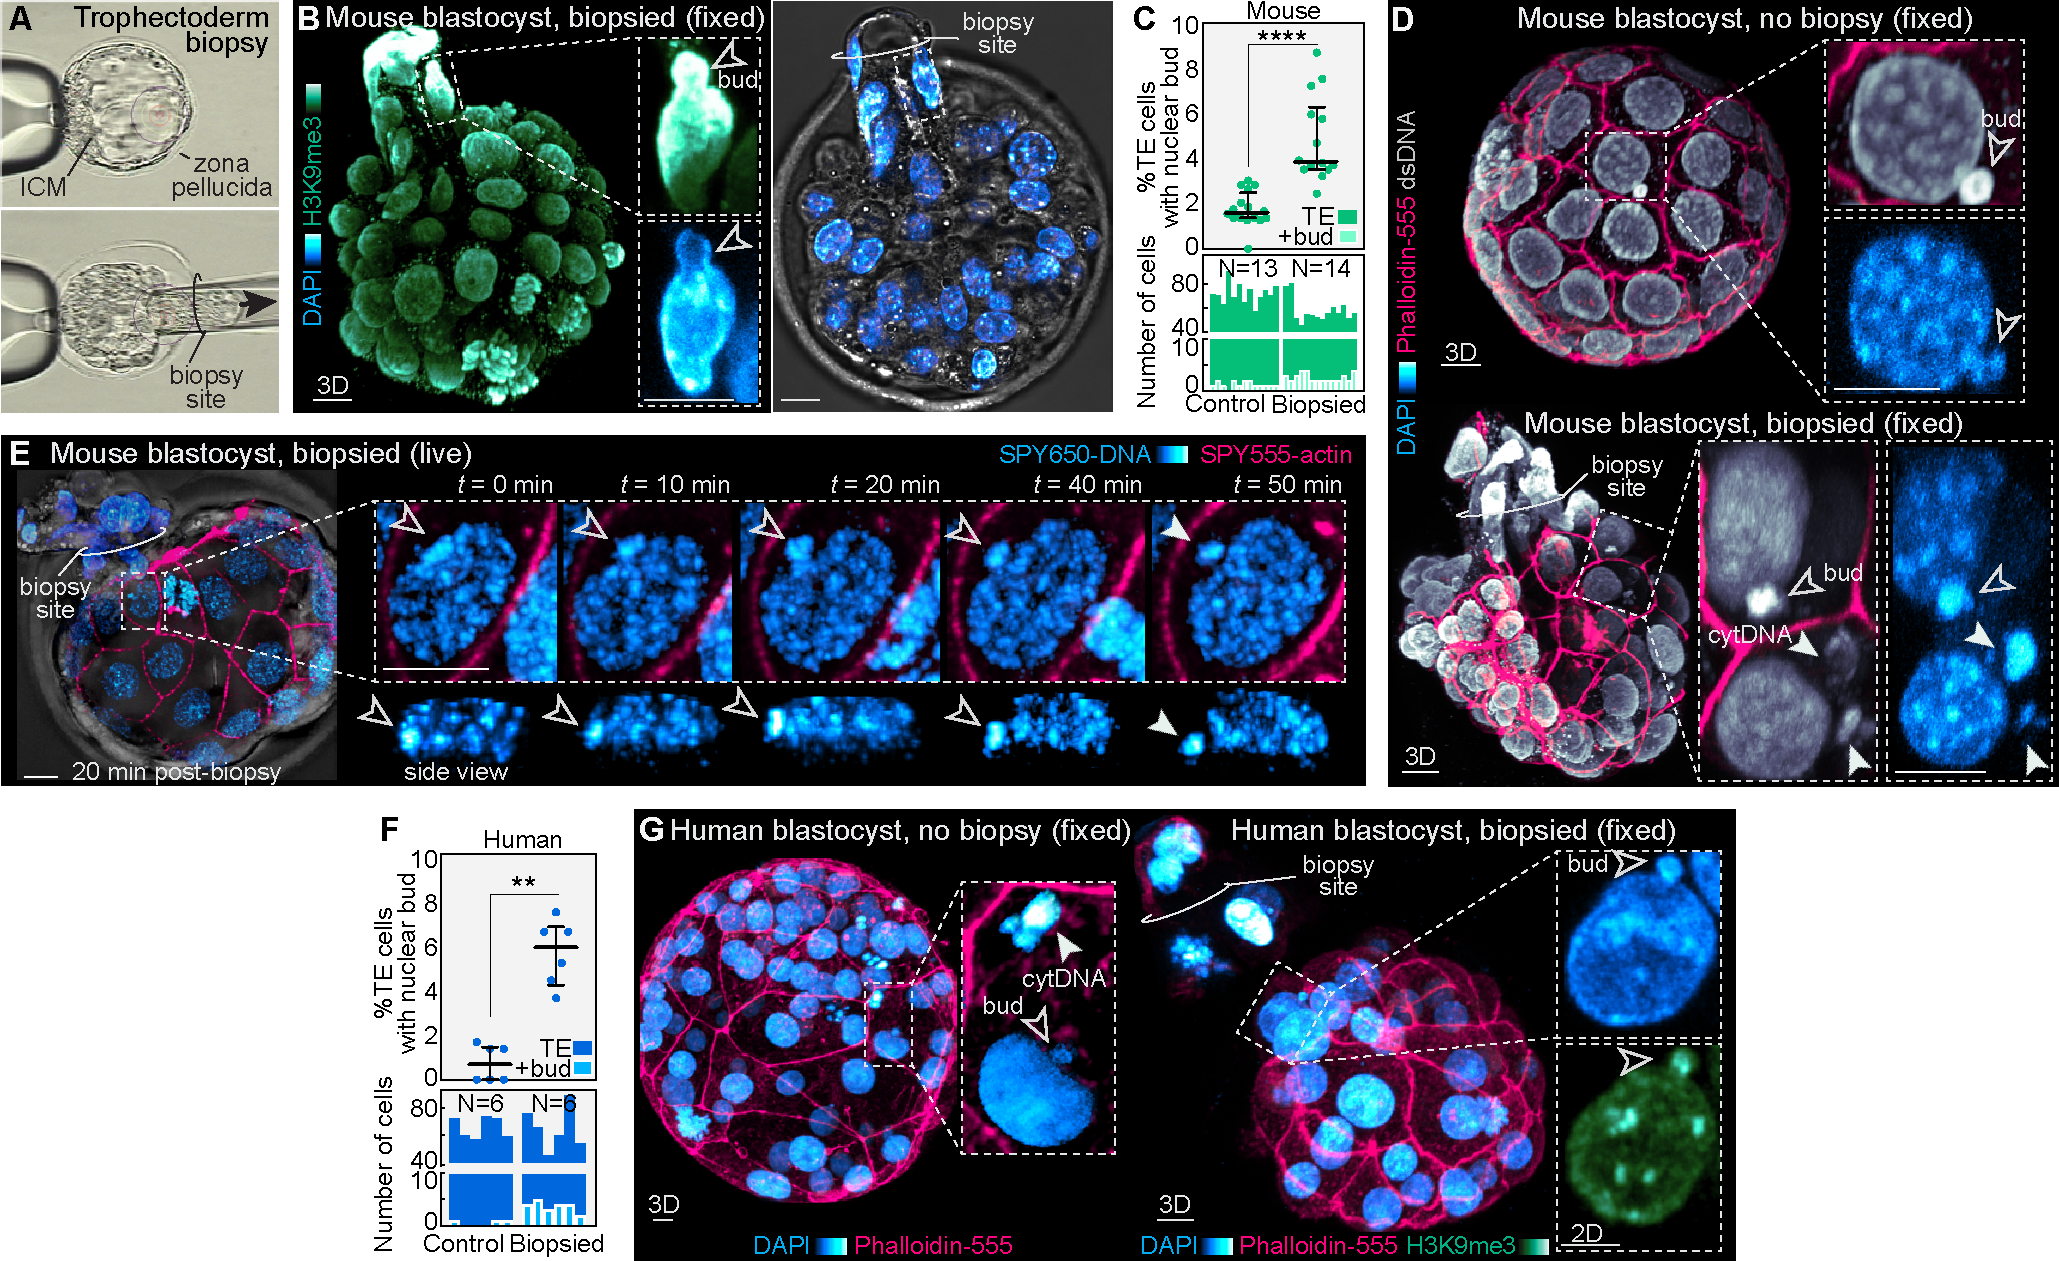
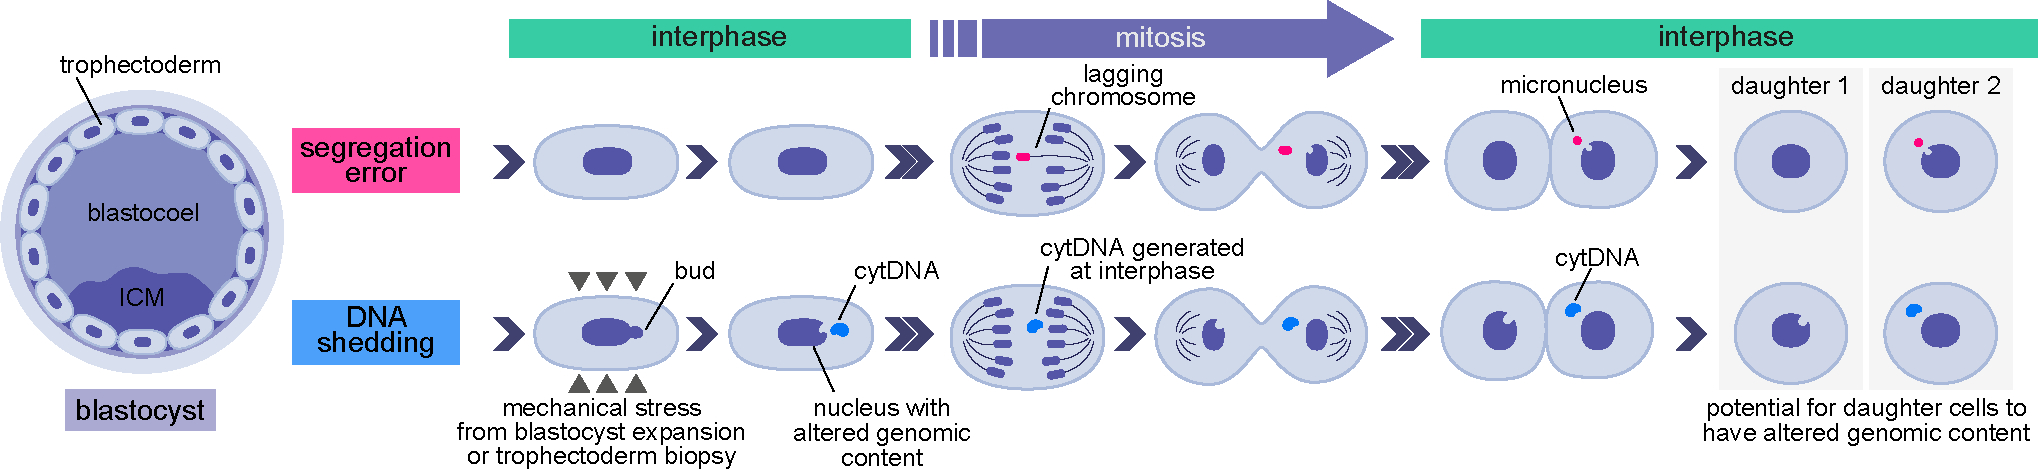
Proper preimplantation development is essential to assemble a blastocyst capable of implantation. Live imaging has uncovered major events driving early development in mouse embryos; yet, studies in humans have been limited by restrictions on genetic manipulation and lack of imaging approaches. We have overcome this barrier by combining fluorescent dyes with live imaging to reveal the dynamics of chromosome segregation, compaction, polarization, blastocyst formation, and hatching in the human embryo. We also show that blastocyst expansion mechanically constrains trophectoderm cells, causing nuclear budding and DNA shedding into the cytoplasm. Furthermore, cells with lower perinuclear keratin levels are more prone to undergo DNA loss. Moreover, applying trophectoderm biopsy, a mechanical procedure performed clinically for genetic testing, increases DNA shedding. Thus, our work reveals distinct processes underlying human development compared with mouse and suggests that aneuploidies in human embryos may not only originate from chromosome segregation errors during mitosis but also from nuclear DNA shedding.

Keywords: aneuploidy; human embryo; live imaging; preimplantation; trophectoderm biopsy.


Conflict of interest statement

Declaration of interests D.S. is on the Scientific Advisory Board of Igenomix, consults to ALIFE and Legacy and is Deputy Editor of Human Reproduction. C.S. is Scientific Advisor of Igenomix.

Figures

Figure 1.
Figure 1.. Imaging live mouse embryos with fluorescent dyes can bypass the need for genetic manipulation or mRNA injection.
(A) Live-imaging of mouse embryos labeled with SPY650-DNA and SPY555-actin at various developmental stages. (B) Embryos stained with the SPY dyes display similar cell cycle lengths at the 4- to 8-cell stage. The control group was measured using brightfield in non-dyed embryos (N = 18 embryos per group; NS = not significant by student’s t-test). (C) Blastocyst progression rates were similar between dyed and non-dyed embryos (N = 3 independent experiments; NS = not significant by student’s t-test). (D–H) The combination of SPY650-DNA and SPY555-actin allows visualization of central events characterizing preimplantation development, similar to embryos microinjected with H2B-GFP and Utrophin-RFP mRNAs. These include the main phases of mitosis (D), embryo compaction (E), formation of F-actin-rich apical domains and of F-actin rings that undergo zippering along cell-cell junctions (F), visualization of the first inner cells of the embryo that will form the ICM, which can be computationally segmented within the 16-cell embryo (G), and blastocyst hatching (H). In (D-F), embryos microinjected with mRNA for H2B-GFP and Utr-RFP are shown for comparison with the SPY650-DNA and SPY555-actin approach. Scale bars, 10 μm. See also Figures S1 and S2, and Videos S1 and S2.
Figure 2.
Figure 2.. Non-invasive imaging reveals cell dynamics underlying early human preimplantation development.
(A) Live-imaging of cleavage stage human embryos labeled with SPY555-DNA and SPY650-FastAct allows visualization of the main phases of mitosis. (B) Comparison of interphase and mitosis duration between mouse (Mo) and human (Hu) cleavage stage (16- to 32-cell) embryos (N = 4 mouse and 3 human embryos, n = 12 and 16 cells (interphase) and n = 31 and 12 cells (mitosis) for mouse and human, respectively; **P< 0.01, NS = not significant by student’s t-test). (C) Example of a cleavage-stage human embryo undergoing compaction. Arrowheads show compacting cells. (D) Computational segmentation of embryos shown in (C) enables visualization of changes in cell morphology during compaction. Note that compaction occurs in an asynchronous manner and that an inner cell becomes completely enclosed by its neighbors during the compaction process. (E) and (F) Analysis of changes in cell-cell contact, cell sphericity and angle between apical membranes as proxies for compaction (N = 3 cleavage stage human embryos, and n = 11, 13, 17, 44, 77 cells at 0, 3, 6, 10, 14h, respectively; ****P< 0.0001 by one-way ANOVA, Kruskal-Wallis test). (G) Analysis of nuclear position and apical polarization following division in live embryos. In mouse embryos, the cell nucleus bounces against the apical cell cortex at the end of cytokinesis triggering formation of an F-actin ring. In the human embryo cell nuclei remain closer to the cytokinetic furrow (arrows) without bouncing against the cortex. Arrowheads highlight an actin ring in mouse. (H) Distance of the nucleus to the cytokinetic furrow is measured for each mitotic pair at telophase (N = 7 mouse and 3 human embryos, n = 50 and 32 cells for mouse and human, respectively; ****P< 0.0001 by two-tailed unpaired student’s t-test). (I) Most outer cells display F-actin rings in mouse embryos shown by Phalloidin-555 staining. The human apical domain enriches F-actin but does not form ring-like structures. Quantification of F-actin intensity along the apical cortex (magenta region) to highlight the presence (arrows) or absence of F-actin rings. For comparisons, the apical cortex was divided into thirds and the area under the curve (AUC) was calculated (N = 18 mouse embryos and 2 human embryos; n = 29 mouse cells and 11 human cells; ****P< 0.0001, NS = not significant by one-way ANOVA test). (J) Live-imaging also exposes the first lineage segregation events generating outer-outer and inner-outer progeny in human. Upper images show 2D planes with dividing cells. Lower panels show segmented 3D reconstructions. The examples demonstrate a division producing outer-inner progeny and a second division producing outer-outer progeny. Graphs show median with interquartile range. The zona pellucida was masked out in human live embryos to improve visualization. Scale bars, 10 μm. See also Figure S3 and Video S3.
Figure 3.
Figure 3.. Dynamics of human blastocyst formation.
(A) Live-imaging of a human blastocyst stained with SPY650-DNA and SPY555-actin. After 1–2 hours cell-cell junctions become clearly labeled by SPY555-actin. (B) 2D planes of a blastocyst during cavitation. A cell division within the ICM can be tracked over time and computationally segmented. Imaging through the blastocyst also reveals tether-like structures projecting between the trophectoderm and ICM validated by Phalloidin-555 staining in fixed embryos. (C) Selected frames of a live human embryo undergoing hatching. The zona pellucida was masked out in live human embryos to improve embryo visualization. Scale bars, 10 μm. See also Figure S4.
Figure 4.
Figure 4.. Cell divisions and chromosome segregation errors in the human blastocyst.
(A) Example of mitosis in the human trophectoderm. (B) Tracking interphase duration in the human trophectoderm by identifying nuclei with interphase morphology and measuring the time between mitoses. Insets show chromatin morphology. (C) Comparison of interphase and mitosis duration between mouse (Mo) and human (Hu) trophectoderm and ICM (N = 5 mouse and 3 human embryos, n = 25, 45, 8, 8 cells (interphase) and n = 96, 187, 18, 15 cells (mitosis); **P< 0.01, *P< 0.05, NS = not significant by one-way ANOVA test). (D) Examples of blastocyst collapse and expansion. (E) Analysis of cell divisions relative to embryo collapse events (probed by measuring embryo volume). Note the lack of correlation between divisions and embryo volume. (F) Quantification and comparison of mural trophectoderm mitoses at different time points before and after embryo collapse (N = 5 collapse events in 2 human embryos; NS = not significant by Kruskal-Wallis test). (G) Live-imaging with SPY650-DNA and SPY555-actin showing the formation of a micronucleus from a lagging chromosome during the mitosis of a trophectoderm cell in a human blastocyst in 3D top and 2D sectional views. Insets show magnified images of the process and surface segmentations of the DNA signal. (H) Scheme representing micronucleus formation from a lagging chromosome during mitosis. Quantification of the number of mitoses with lagging chromosomes relative to the total number of mitotic events analyzed in human blastocysts (N = 5 human embryos). Graphs show median with interquartile range. The zona pellucida was masked out in human live embryos to improve visualization. Scale bars, 10 μm. See also Figure S4, and Videos S3 and S4.
Figure 5.
Figure 5.. Identification of nuclear budding and DNA shedding.
(A) Images of early and late human blastocysts stained for DAPI and Phalloidin-555. Nuclear segmentation highlights the change in nuclear morphology. Analysis of nuclear morphology in live embryos labeled with SPY650-DNA reveals flattening of trophectoderm nuclei in the expanded human blastocyst (N = 3 human embryos, n = 27 and 26 cells for pre- and post-expansion, respectively; ****P< 0.0001 by two-tailed unpaired t-test). (B) Live-imaging in human blastocysts demonstrates the appearance of nuclear buds and cytDNA followed by cell division. Lower panels show the SPY650-DNA signal segmented. (C) Images of live human blastocysts uncover SPY650-DNA–labeled structures within the cytoplasm in expanded blastocysts. Insets show the segmented SPY650-DNA and SPY555-actin signals. (D) Quantification of nuclear DNA shedding events producing cytDNA in three human embryos over time. Analysis of nuclear and blastocoel volumes pre- and post-DNA loss. Note the reduction in nuclear volume following DNA loss. Neighboring control nuclei (without DNA loss) maintain the same volume (N = 11 DNA loss events in 3 human embryos; **P< 0.01, *P< 0.05, NS = not significant by two-tailed paired student’s t-test). Scheme depicts nuclear budding and cytDNA formation. (E) Quantification of the percentage of trophectoderm cells with nuclear buds in mouse embryos dyed and live-imaged, cultured without dyes, and freshly isolated and immediately fixed at 4 d.p.c. (N = 9 live-imaged, 32 cultured and 35 freshly isolated embryos, NS = not significant by Kruskal-Wallis test). (F) Computational segmentation of human trophectoderm nuclei showing nuclear buds. (G) Detection of cytDNA structures and nuclear buds in an expanded mouse blastocyst fixed and stained with DAPI, and with antibodies against double-stranded DNA. (H) Immunostaining showing the presence of histone H2B-RFP, the pericentromeric marker TaleMS-mClover, and histone modifications H3K9me2 and H3K9me3 in nuclear buds and cytDNA in trophectoderm cells of expanded mouse blastocysts. (I) Treatment with ouabain prevents cavity expansion and reduces the percentage of trophectoderm cells with buds (N = 16 mouse embryos per group; *P< 0.05 by Mann-Whitney U test). (J) Human blastocyst showing keratin network around most trophectoderm cell nuclei. Higher magnification images highlight the cage-like organization of keratin filaments surrounding the nucleus. Analysis of K8 fluorescence intensity shows lower perinuclear K8 levels in cells with nuclear buds (N = 3 human and 7 mouse embryos labeled by color, n = 33 and 7 cells (human) and n = 26 and 9 cells (mouse); ***P< 0.001, *P< 0.05, by Mann-Whitney U test). (K) siRNAs for K8+K18 injected in half of the embryo disrupt the keratin network and cause an increased number of cells with nuclear buds and cytDNA compared to scramble siRNA-injected embryos (N = 8 embryos per group, **P< 0.01, *P< 0.05, by Mann-Whitney U test). Dashed circles show injected nuclei confirmed by H2B-RFP signal. Inset shows a nuclear bud in a knockdown cell. Graphs show median with interquartile range. The zona pellucida was masked out in human live embryos to improve visualization. Scale bars, 10 μm See also Figures S5–S7, and Videos S4–S6.
Figure 6.
Figure 6.. Trophectoderm biopsy causes nuclear budding.
(A) Example of biopsy procedure performed on a mouse blastocyst. (B) Representative image of a fixed biopsied embryo labeled for H3K9me3 and DAPI reveals nuclear buds. (C) and (D) Analysis shows an increased percentage of trophectoderm cells with nuclear buds in biopsied versus non-biopsied mouse blastocysts, visualized by DAPI staining and immunofluorescence for double-stranded DNA. Dot plot of percent trophectoderm cells with nuclear buds above and bar graph depicting absolute number of trophectoderm cells with nuclear buds per embryo below. Each bar represents one embryo (N = 13 control and 14 biopsied mouse embryos; ****P< 0.0001 by Mann-Whitney U test). (E) Live-imaging of a mouse blastocyst labeled with SPY650-DNA and SPY555-actin 20 min post-biopsy reveals the appearance of nuclear buds and generation of cytDNA structures. (F) and (G) Analysis of biopsied human embryos reveal a similar increase in nuclear budding (N = 6 human embryos per group; **P< 0.01 by Mann-Whitney U test). Graphs show median with interquartile range. Scale bars, 10 μm. See also Figure S7 and Video S7.
Figure 7.
Figure 7.. Scheme of processes producing DNA loss in the embryo.
Chromosome segregation errors occurring during cell mitosis can frequently account for aneuploidy in the preimplantation embryo. Our data show that cell nuclei can also shed DNA into the cytoplasm during interphase, as a consequence of mechanical stress experienced during blastocyst cavity expansion or biopsy. Following subsequent cell divisions, cells with chromosome segregation errors or DNA shedding may produce progeny with abnormal genomic contents.

Comment in

References

    1. Adamson GD, de Mouzon J, Chambers GM, Zegers-Hochschild F, Mansour R, Ishihara O, Banker M, and Dyer S (2018). International Committee for Monitoring Assisted Reproductive Technology: world report on assisted reproductive technology, 2011. Fertil. Steril. 110, 1067–1080. 10.1016/j.fertnstert.2018.06.039. - DOI - PubMed
    1. Niakan KK, Han J, Pedersen RA, Simon C, and Pera RA (2012). Human pre-implantation embryo development. Development 139, 829–841. 10.1242/dev.060426. - DOI - PMC - PubMed
    1. Fierro-Gonzalez JC, White MR, Silva J, and Plachta N (2013). Cadherin-dependent filopodia control preimplantation embryo compaction Nat. Cell Biol. 15, 1424–1433. - PubMed
    1. Samarage CR, White MD, Alvarez YD, Fierro-Gonzalez JC, Henon Y, Jesudason EC, Bissiere S, Fouras A, and Plachta N (2015). Cortical Tension Allocates the First Inner Cells of the Mammalian Embryo. Dev. Cell 34, 435–447. - PubMed
    1. Zenker J, White MD, Gasnier M, Alvarez YD, Lim HYG, Bissiere S, Biro M, and Plachta N (2018). Expanding Actin Rings Zipper the Mouse Embryo for Blastocyst Formation. Cell 173, 776–791 e717. 10.1016/j.cell.2018.02.035. - DOI - PubMed

Publication types

LinkOut - more resources