

WindowSHAP: An efficient framework for explaining time-series classifiers based on Shapley values
- PMID: 37414368
- PMCID: PMC10552726
- DOI: 10.1016/j.jbi.2023.104438
WindowSHAP: An efficient framework for explaining time-series classifiers based on Shapley values
Abstract
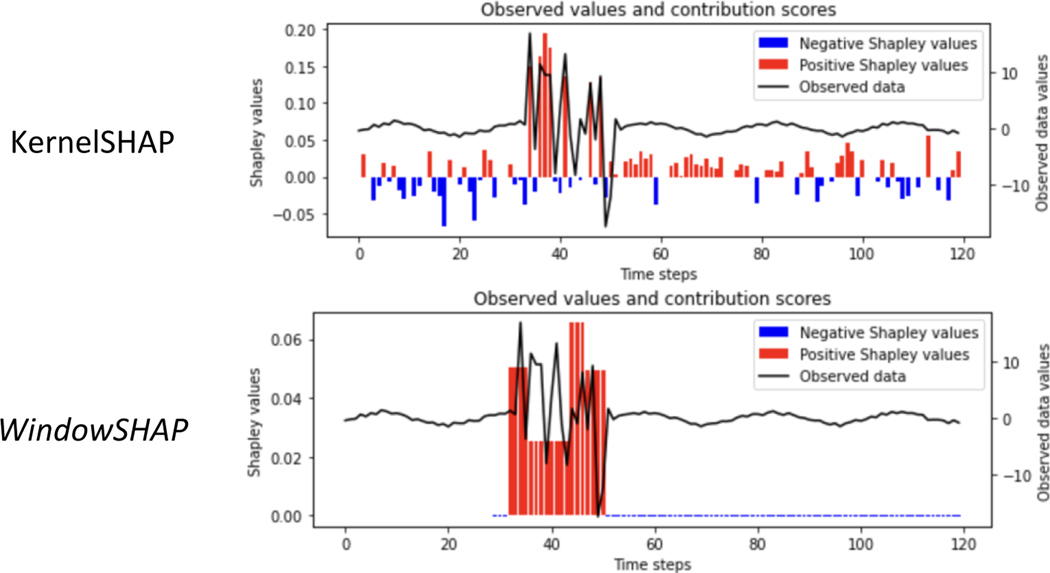
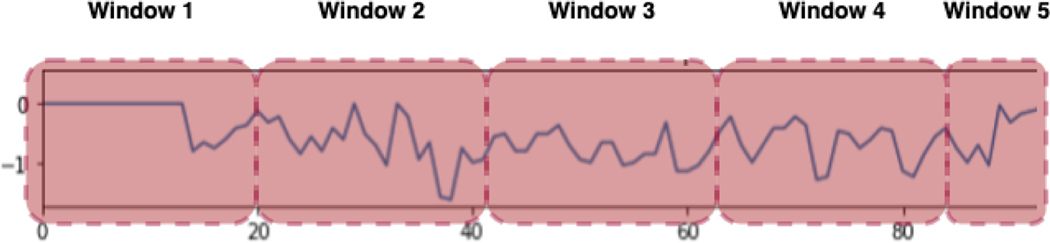
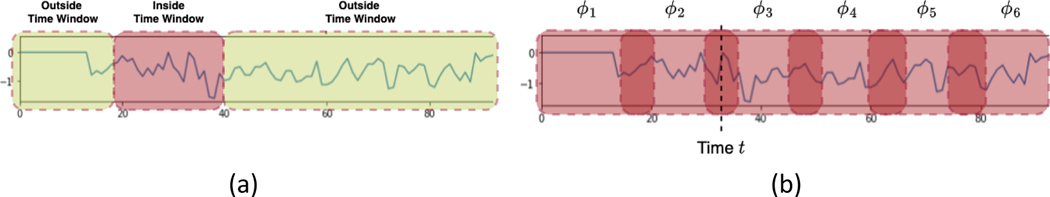
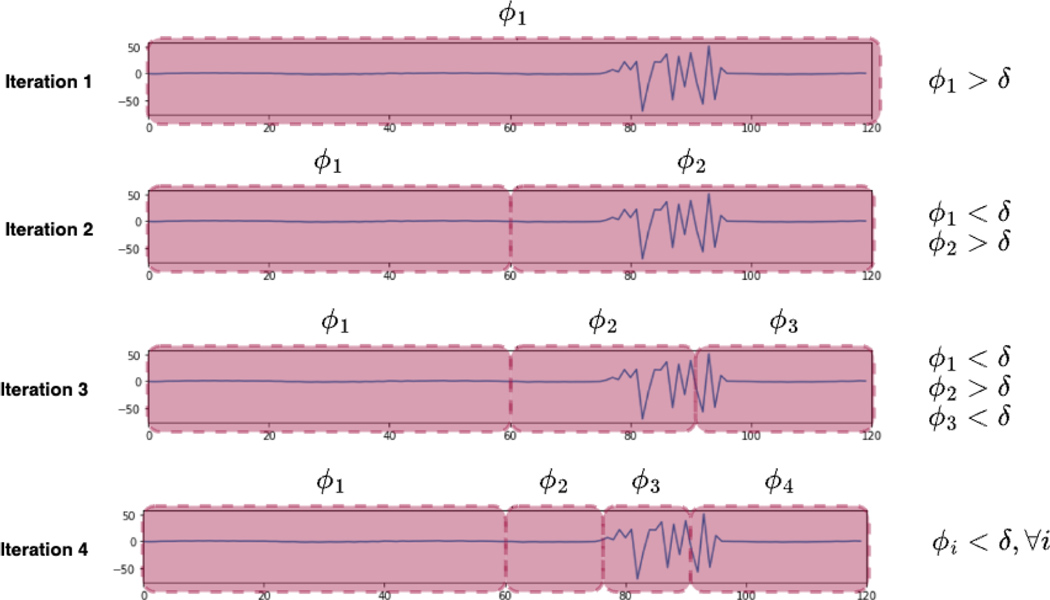
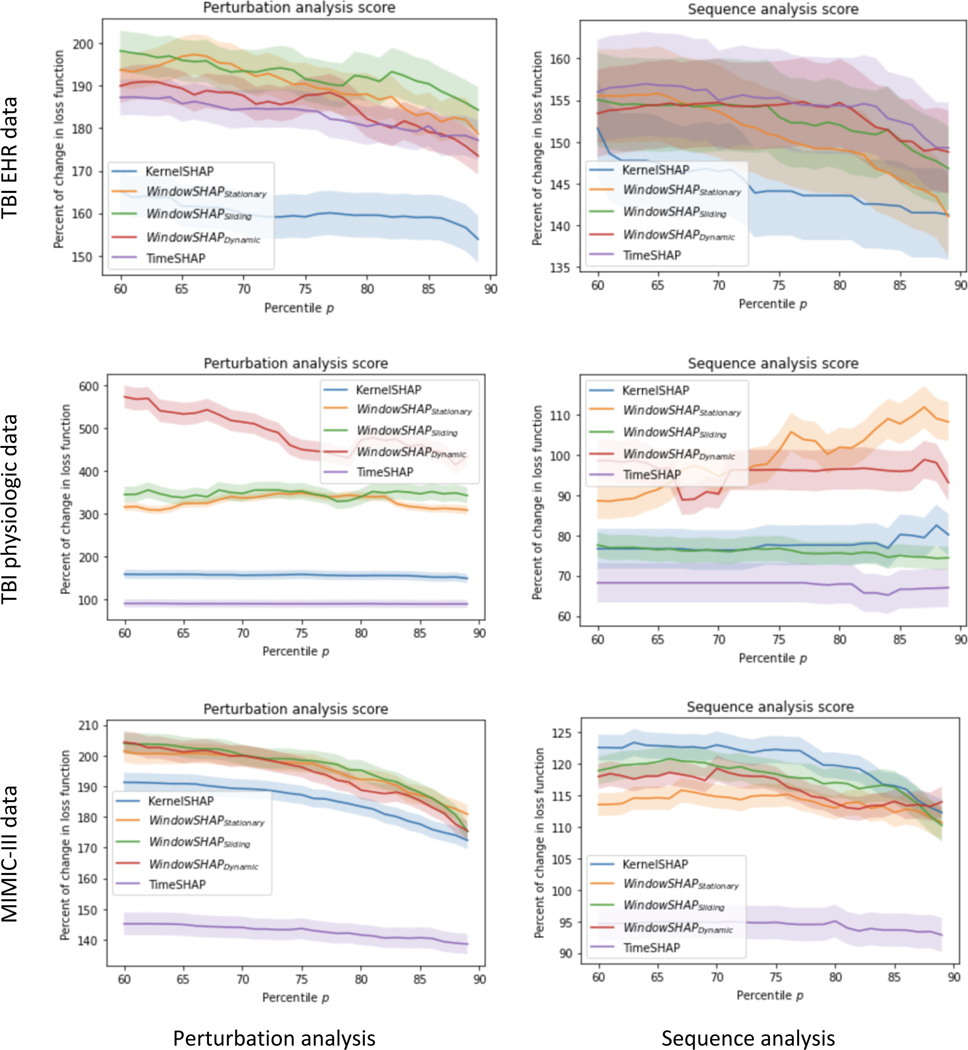
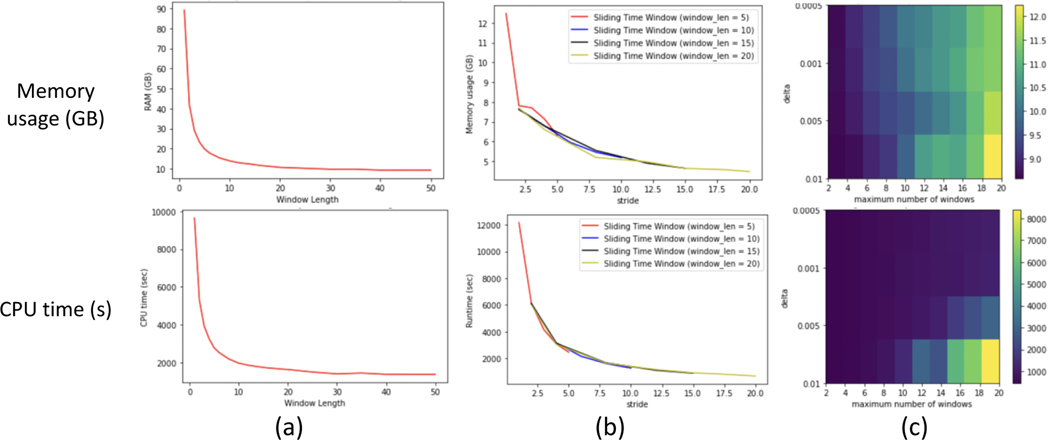
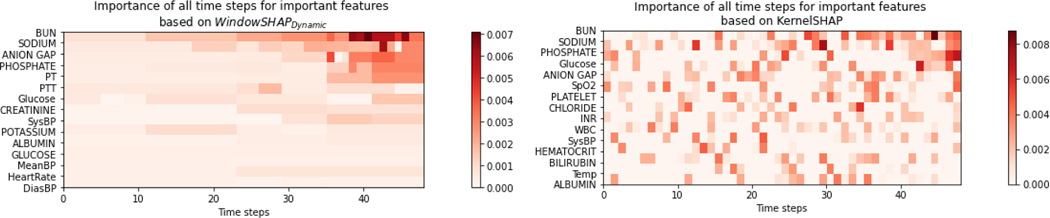
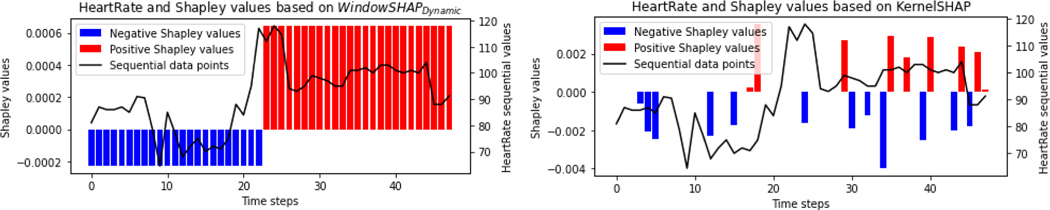
Unpacking and comprehending how black-box machine learning algorithms (such as deep learning models) make decisions has been a persistent challenge for researchers and end-users. Explaining time-series predictive models is useful for clinical applications with high stakes to understand the behavior of prediction models, e.g., to determine how different variables and time points influence the clinical outcome. However, existing approaches to explain such models are frequently unique to architectures and data where the features do not have a time-varying component. In this paper, we introduce WindowSHAP, a model-agnostic framework for explaining time-series classifiers using Shapley values. We intend for WindowSHAP to mitigate the computational complexity of calculating Shapley values for long time-series data as well as improve the quality of explanations. WindowSHAP is based on partitioning a sequence into time windows. Under this framework, we present three distinct algorithms of Stationary, Sliding and Dynamic WindowSHAP, each evaluated against baseline approaches, KernelSHAP and TimeSHAP, using perturbation and sequence analyses metrics. We applied our framework to clinical time-series data from both a specialized clinical domain (Traumatic Brain Injury - TBI) as well as a broad clinical domain (critical care medicine). The experimental results demonstrate that, based on the two quantitative metrics, our framework is superior at explaining clinical time-series classifiers, while also reducing the complexity of computations. We show that for time-series data with 120 time steps (hours), merging 10 adjacent time points can reduce the CPU time of WindowSHAP by 80 % compared to KernelSHAP. We also show that our Dynamic WindowSHAP algorithm focuses more on the most important time steps and provides more understandable explanations. As a result, WindowSHAP not only accelerates the calculation of Shapley values for time-series data, but also delivers more understandable explanations with higher quality.
Keywords: Explainable artificial intelligence; Model interpretation; Shapley value; Time-series data.
Copyright © 2023 Elsevier Inc. All rights reserved.
Conflict of interest statement
Declaration of Competing Interest The authors declare the following financial interests/personal relationships which may be considered as potential competing interests: Amin Nayebi reports financial support was provided by National Science Foundation. Brandon Foreman reports financial support was provided by National Institutes of Health.
Figures
Similar articles
-
Calculation of exact Shapley values for explaining support vector machine models using the radial basis function kernel.Sci Rep. 2023 Nov 10;13(1):19561. doi: 10.1038/s41598-023-46930-2. Sci Rep. 2023. PMID: 37949930 Free PMC article.
-
Explaining multivariate molecular diagnostic tests via Shapley values.BMC Med Inform Decis Mak. 2021 Jul 8;21(1):211. doi: 10.1186/s12911-021-01569-9. BMC Med Inform Decis Mak. 2021. PMID: 34238309 Free PMC article.
-
An Empirical Comparison of Explainable Artificial Intelligence Methods for Clinical Data: A Case Study on Traumatic Brain Injury.AMIA Annu Symp Proc. 2023 Apr 29;2022:815-824. eCollection 2022. AMIA Annu Symp Proc. 2023. PMID: 37128424 Free PMC article.
-
Explainability and white box in drug discovery.Chem Biol Drug Des. 2023 Jul;102(1):217-233. doi: 10.1111/cbdd.14262. Epub 2023 Apr 27. Chem Biol Drug Des. 2023. PMID: 37105727 Review.
-
Shallow and deep learning classifiers in medical image analysis.Eur Radiol Exp. 2024 Mar 5;8(1):26. doi: 10.1186/s41747-024-00428-2. Eur Radiol Exp. 2024. PMID: 38438821 Free PMC article. Review.
Cited by
-
An explainable long short-term memory network for surgical site infection identification.Surgery. 2024 Jul;176(1):24-31. doi: 10.1016/j.surg.2024.03.006. Epub 2024 Apr 18. Surgery. 2024. PMID: 38616153 Free PMC article.
-
Practical guide to SHAP analysis: Explaining supervised machine learning model predictions in drug development.Clin Transl Sci. 2024 Nov;17(11):e70056. doi: 10.1111/cts.70056. Clin Transl Sci. 2024. PMID: 39463176 Free PMC article. Review.
-
Surveying haemoperfusion impact on COVID-19 from machine learning using Shapley values.Inflammopharmacology. 2024 Aug;32(4):2285-2294. doi: 10.1007/s10787-024-01494-z. Epub 2024 May 19. Inflammopharmacology. 2024. PMID: 38762840
References
-
- Samek W, Wiegand T, and Müller K-R, “Explainable Artificial Intelligence: Understanding, Visualizing and Interpreting Deep Learning Models,” arXiv:1708.08296, Aug. 2017, Accessed: Mar. 02, 2022. [Online]. Available: http://arxiv.org/abs/1708.08296
-
- Selbst A. and Powles J, “‘Meaningful Information’ and the Right to Explanation,” in Proceedings of the 1st Conference on Fairness, Accountability and Transparency, PMLR, PMLR, Jan. 2018, pp. 48–48. Accessed: Sep. 20, 2022. [Online]. Available: https://proceedings.mlr.press/v81/selbst18a.html
-
- Lipton ZC, Kale DC, and Wetzel R, “Modeling Missing Data in Clinical Time Series with RNNs,” vol. 56, 2016, [Online]. Available: http://arxiv.org/abs/1606.04130
Publication types
MeSH terms
Grants and funding
LinkOut - more resources
Full Text Sources
Medical
Research Materials
