. 2023 Jul 6;6(9):e202201683.
doi: 10.26508/lsa.202201683. Print 2023 Sep.

Characterizing control of memory CD8 T cell differentiation by BTB-ZF transcription factor Zbtb20

Affiliations

Characterizing control of memory CD8 T cell differentiation by BTB-ZF transcription factor Zbtb20

Nicholas K Preiss et al. Life Sci Alliance. .

Abstract

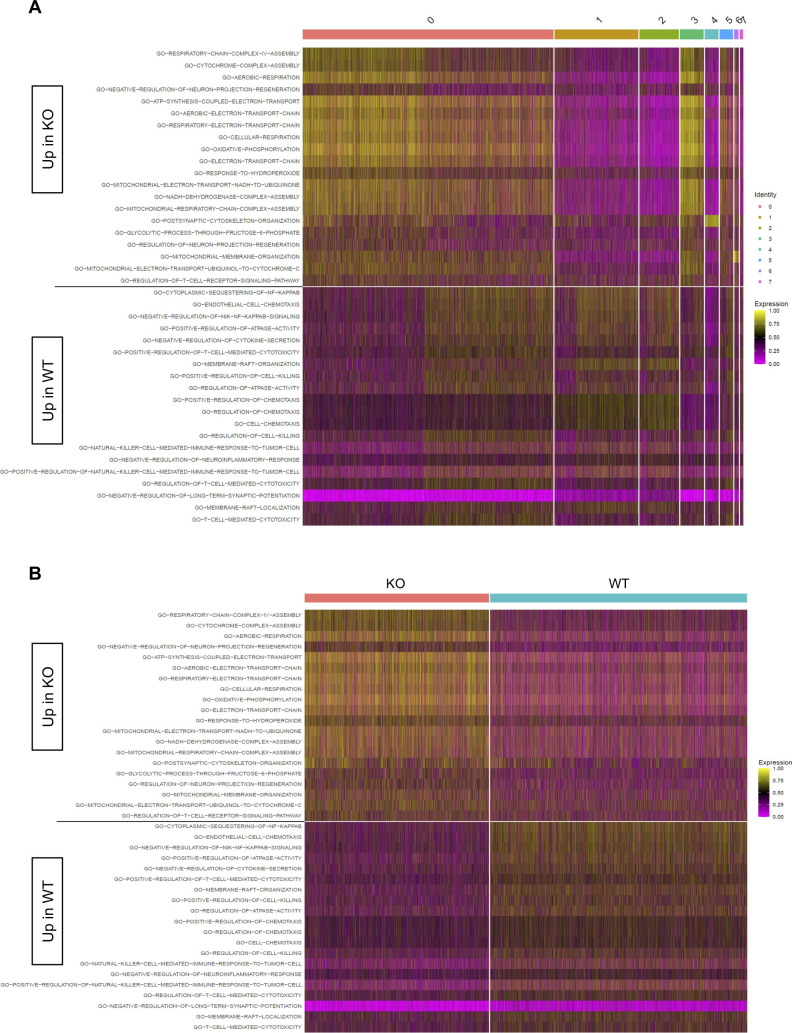
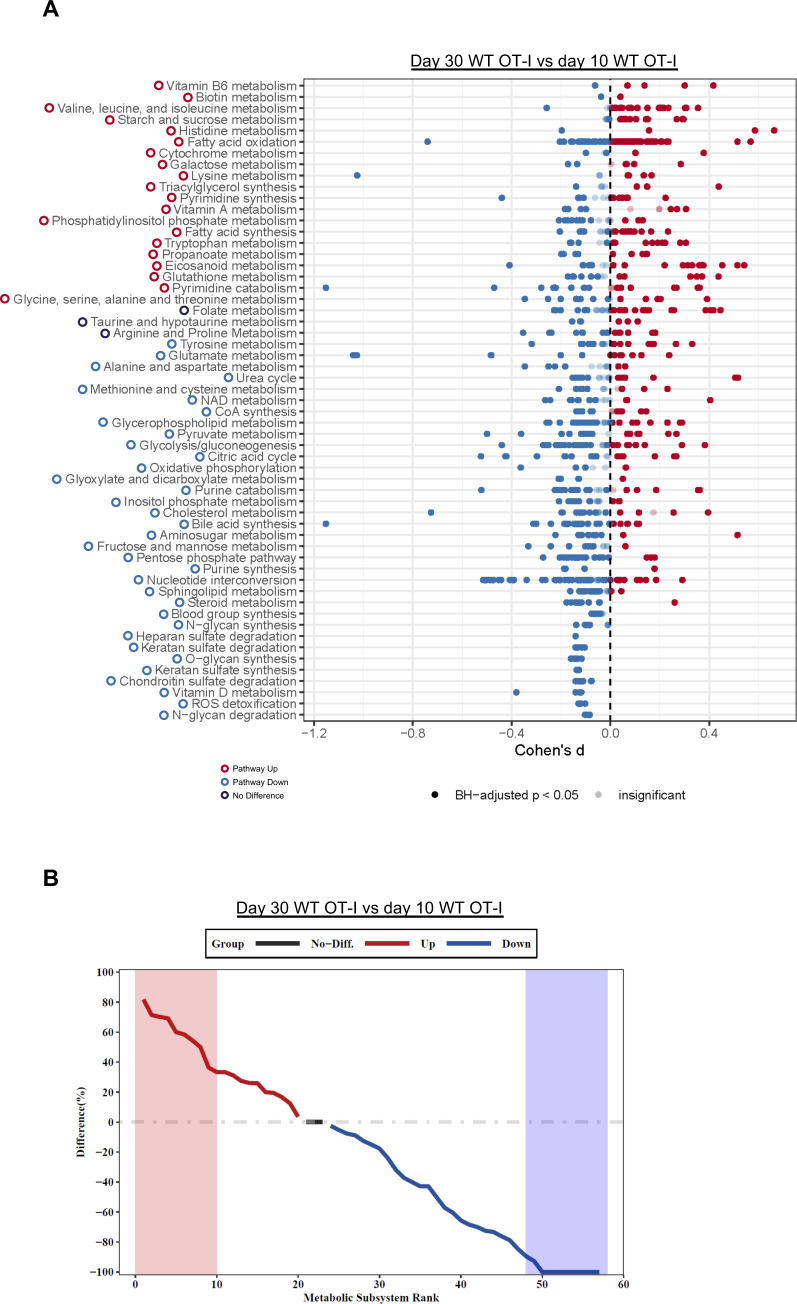
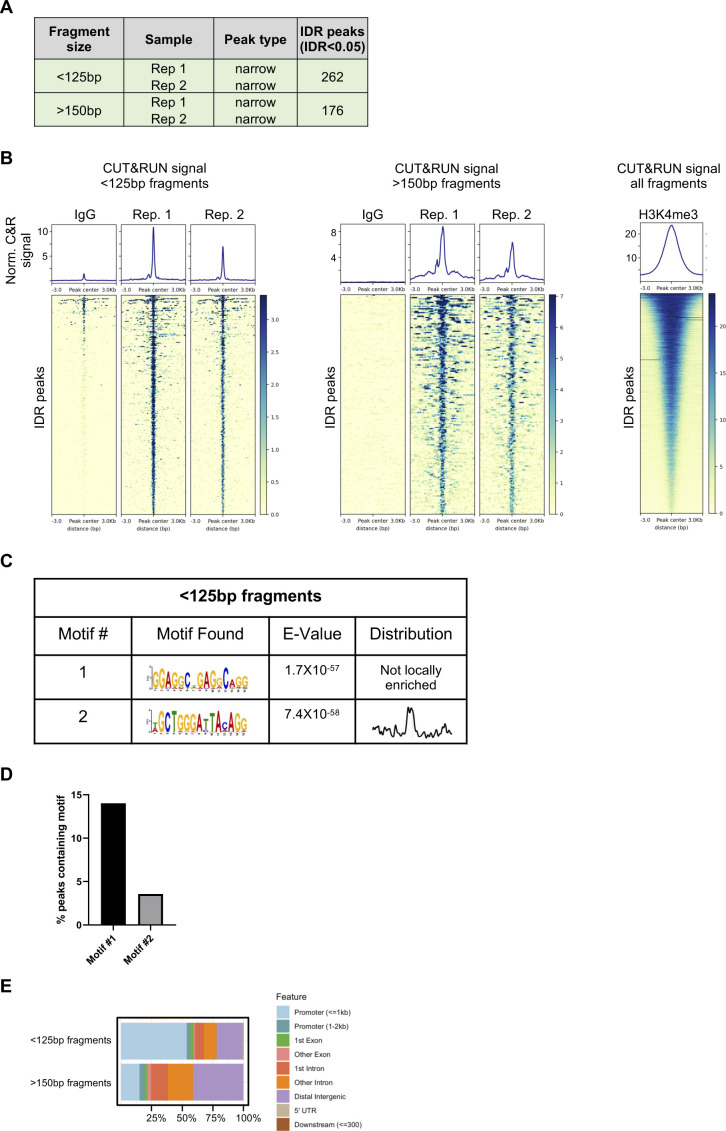
Members of the BTB-ZF transcription factor family regulate the immune system. Our laboratory identified that family member Zbtb20 contributes to the differentiation, recall responses, and metabolism of CD8 T cells. Here, we report a characterization of the transcriptional and epigenetic signatures controlled by Zbtb20 at single-cell resolution during the effector and memory phases of the CD8 T cell response. Without Zbtb20, transcriptional programs associated with memory CD8 T cell formation were up-regulated throughout the CD8 T response. A signature of open chromatin was associated with genes controlling T cell activation, consistent with the known impact on differentiation. In addition, memory CD8 T cells lacking Zbtb20 were characterized by open chromatin regions with overrepresentation of AP-1 transcription factor motifs and elevated RNA- and protein-level expressions of the corresponding AP-1 components. Finally, we describe motifs and genomic annotations from the DNA targets of Zbtb20 in CD8 T cells identified by cleavage under targets and release under nuclease (CUT&RUN). Together, these data establish the transcriptional and epigenetic networks contributing to the control of CD8 T cell responses by Zbtb20.


Conflict of interest statement

The authors declare that they have no conflict of interest.

Figures

Figure 1.
Figure 1.. Transcriptomic and epigenetic differences between effector and memory CD8 T cells with and without Zbtb20.
(A) Mice received naive WT OT-I (WT) or Zbtb20-deficient OT-I cells (KO) and were then infected with LM-actA–OVA. Spleen cells were harvested during the effector (day 10) and memory response (day 30), OT-I cells purified, and single-cell cellular indexing of transcriptomes and epitopes by sequencing/RNA-seq/ATAC-seq performed as described. (B, C) KO and WT cells collected from days 10 and 30 represented in the same uniform manifold approximation and projection space by transcript expression (B) and chromatin accessibility (C). (D, E) Cluster analysis of KO and WT cells collected from days 10 and 30 in the same uniform manifold approximation and projection space by transcript expression (D) and chromatin accessibility (E). (F, G) The distribution of days 10 and 30 WT by transcript expression (F) and chromatin accessibility (G). (H, I) The distribution of days 10 and 30 KO by transcript expression (H) and chromatin accessibility (I).
Figure 2.
Figure 2.. Transcriptional control of differentiating CD8 T cells by Zbtb20.
Mice received naive WT OT-I (WT) or Zbtb20-deficient OT-I cells (KO) and were then infected with LM-actA–OVA. Spleen cells were harvested during the effector (day 10) and memory response (day 30), OT-I cells purified, and single-cell cellular indexing of transcriptomes and epitopes by sequencing/RNA-seq performed as described. (A, C) Uniform manifold approximation and projection embeddings of merged KO and WT profiles at day 10 (A) and day 30 (C) colored by KO and WT statuses. (B, D) Uniform manifold approximation and projection embeddings colored by cluster and displaying distribution of KO and WT cells within each expression cluster at day 10 (B) and day 30 (D). (E, F, G, H) Feature plots displaying recovery of antibody derived tags for protein-level expression of surface molecules CD127 and KLRG1 at day 10 (E, F) and day 30 (G, H). (I, J) Expression plots comparing gene-level expression of indicated genes between KO and WT at day 10 (I) and day 30 (J) for genes with significant differences in expression. (K, L) Expression plots comparing gene-level expression for select clusters at day 10 (K) and day 30 (L). (M, N) Expression of antibody-derived tags for CD62L, KLRG1, and CD127 are displayed for select clusters for days 10 (M) and 30 (N). (O, P) Flow cytometry was used to detect protein-level expression of CX3CR1 on KO and WT cells at day 10 and 30 postinfection with LM-actA–OVA. (O, P) Percent of KO and WT cells expressing CX3CR1 at day 10 (O) and day 30 (P). For flow cytometry experiments, results are representative of two independent experiments where n = 4–5 for each condition. *P ≤ 0.05, **P ≤ 0.01, ***P ≤ 0.001, ****P ≤ 0.0001, and ns P > 0.05.
Figure S1.
Figure S1.. Differential C5 pathways at day 10.
Heatmaps display cell-level pathway enrichment scores for gene sets in the C5 pathway collections in the Molecular Signature Database at day 10. (A, B) All pathways displayed are differentially expressed between KO and WT with cells ordered based on cluster membership (A) or KO/WT status (B). All pathways displayed are significantly differentially expressed between KO and WT (FDR < 0.15).
Figure S2.
Figure S2.. Differential Hallmark pathways at day 10.
Heatmaps display cell-level pathway enrichment scores for gene sets in the Hallmark pathway collections in the Molecular Signature Database at day 10. (A, B) All pathways displayed are differentially expressed between KO and WT with cells ordered based on cluster membership (A) or KO/WT status (B). All pathways displayed are significantly differentially expressed between KO and WT (FDR < 0.15).
Figure S3.
Figure S3.. Differential C5 pathways at day 30.
Heatmaps display cell-level pathway enrichment scores for gene sets in the C5 pathway collections in the Molecular Signature Database at day 30. (A, B) All pathways displayed are differentially expressed between KO and WT with cells ordered based on cluster membership (A) or KO/WT status (B). All pathways displayed are significantly differentially expressed between KO and WT (FDR < 0.15).
Figure S4.
Figure S4.. Differential Hallmark pathways at day 30.
Heatmaps display cell-level pathway enrichment scores for gene sets in the Hallmark pathway collections in the Molecular Signature Database at day 30. (A, B) All pathways displayed are differentially expressed between KO and WT with cells ordered based on cluster membership (A) or KO/WT status (B). All pathways displayed are significantly differentially expressed between KO and WT (FDR < 0.15).
Figure S5.
Figure S5.. COMPASS comparison of day 10 effector with day 30 memory WT OT-I.
COMPASS was used to analyze the WT OT-I (WT) single-cell RNA sequencing days 10 and 30 datasets. (A) Differential activity of metabolic reactions grouped by Recon2 pathways. Reactions are colored according to the sign of their Cohen’s d statistic, where a positive sign indicates up-regulation in day 30 memory versus day 10 effector WT. (B) Rank plot displaying the difference between the percentage of reactions significantly up-regulated and the percentage of reactions significantly down-regulated in day 30 memory versus day 10 effector WT.
Figure 3.
Figure 3.. Zbtb20 controls metabolic transcriptome of CD8 T cells.
COMPASS was used to analyze the KO and WT single-cell RNA sequencing datasets. (A, C) Differential activity of metabolic reactions grouped by Recon2 pathways. (A, C) Reactions are colored according to the sign of their Cohen’s d statistic, where a positive sign indicates up-regulation in KO versus WT at day 10 (A) and day 30 (C). (B, D) Rank plots displaying the difference between the percentage of reactions significantly up-regulated and the percentage of reactions significantly down-regulated in Zbtb20 KO OT-I versus WT OT-I at day 10 (B) and day 30 (D).
Figure 4.
Figure 4.. Epigenetic differences in the absence of Zbtb20.
Mice received naive WT OT-I (WT) or Zbtb20-deficient OT-I cells (KO) and were then infected with LM-actA–OVA. Spleen cells were harvested during the effector (day 10) and memory response (day 30), OT-I cells purified, and single-cell ATAC sequencing performed as described. (A, B) Uniform manifold approximation and projection embeddings of merged KO and WT profiles at day 10 (A) and day 30 (B) colored by KO and WT status. (C, D) Uniform manifold approximation and projection embeddings colored by cluster and displaying distribution of KO and WT cells within each expression cluster at day 10 (C) and day 30 (D). (E, F) Accessibility plots plots comparing gene-level accessibility of indicated genes between KO and WT at day 10 (E) and day 30 (F). (G, H) Accessibility plots comparing gene-level accessibility for select clusters at day 10 (G) and day 30 (H).
Figure S6.
Figure S6.. Zeb1/2 signature in day 10 effector CD8 T cells lacking Zbtb20.
Regions of differentially accessible chromatin between KO and WT were subjected to chromVAR analysis. (A) Transcription factor motifs identified by chromVAR in regions of chromatin more accessible in KO cells 10 d postinfection with LM-actA–Ova. (B) ChromVAR scores for motifs depicted in (A). (C) Violin plots for RNA-expression level of transcription factors components at day 10 either corresponding to (Tcf7), or associated with (Zeb2), motifs identified by chromVAR analysis in (B). (D) ChromVAR analysis performed comparing KO and WT within individual single-cell ATAC sequencing clusters. For (D), the threshold of significance as denoted within the plot by an asterisk is P < 0.001.
Figure 5.
Figure 5.. Zbtb20 controls AP-1 signature in memory CD8 T cells.
Regions of differentially accessible chromatin between KO and WT were subjected to chromVAR analysis. (A) Transcription factor motifs identified by chromVAR in regions of chromatin more accessible in KO cells 30 d postinfection with LM-actA–Ova. (B) ChromVAR scores for motifs depicted in (A). (C) Violin plots for the RNA expression level of AP-1 transcription factor components at day 30 corresponding to motifs identified by chromVAR analysis. (D) Flow cytometry was used to detect protein level expression of AP-1 transcription factor components corresponding to motifs identified by chromVAR analysis 30 d postinfection with LM-actA–Ova. Data were normalized to the mean WT mean fluorescence intensity. (E) Representative histograms depicting protein level expression of AP-1 transcription factor components for data presented in (D) compared with control sample stained only with secondary antibody. For flow cytometry experiments, results are shown for two pooled independent experiments where n = 9–10 for each condition. **P ≤ 0.01 and ***P ≤ 0.001.
Figure S7.
Figure S7.. Distribution of AP-1 subunit expression in memory CD8 T cells.
(A) Expression of AP-1 components measured by mean fluorescence intensity (MFI) compared between CX3CR1lo and CX3CR1hi WT. (B) Expression of AP-1 components measured by MFI compared between CX3CR1lo and CX3CR1hi KO. (C) Expression of AP-1 components measured by MFI compared between CX3CR1lo KO and CX3CR1lo WT. (D) Expression of AP-1 components measured by MFI compared between CX3CR1hi KO and CX3CR1hi WT. *P ≤ 0.05, **P ≤ 0.01, ***P ≤ 0.001, ****P ≤ 0.0001, and ns P > 0.05.
Figure 6.
Figure 6.. Cleavage under targets and release under nuclease (CUT&RUN) identifies genomic targets and de novo DNA-binding motifs associated with Zbtb20 binding in CD8 T cells.
CUT&RUN was used to identify regions of DNA bound by Zbtb20 in CD8 T cells. (A) Heat maps and signal of two replicate CUT&RUN datasets for irreproducible discovery rate peaks generated with <125-bp fragments. (B) De novo motif discovery analysis in Zbtb20 CUT&RUN peaks in CD8 T cells with E values reported by MEME. (C) Enriched terms for ontologies obtained using Genomic Regions Enrichment of Annotations Tool analysis of proximal and distal binding events obtained for Zbtb20 in CD8 T cells. (D) Select signal tracks showing Zbtb20 CUT&RUN signal compared with IgG control for genes in GO pathways identified in (C). Peak calls from MACS2 where Zbtb20 CUT&RUN signal was significantly enriched over IgG control are denoted by the peak tracks.
Figure S8.
Figure S8.. CD8 T cell cleavage under targets and release under nuclease (CUT&RUN) summary.
CUT&RUN was used to identify regions of DNA bound by Zbtb20 in CD8 T cells. (A) Table indicating number of irreproducible discovery rate (IDR) peaks identified from two replicate samples for CUT&RUN fragments separated into <125 and >150-bp–size classes. (B) Heat maps and signal for IDR Zbtb20 CUT&RUN peaks generated from fragments separated into <125 and >150-bp–size classes and signal from all fragments generated by targeting histone methylation H3K4me3 as a technical positive control. (C) De novo motif discovery analysis in Zbtb20 CUT&RUN peaks generated from <125-bp fragments in CD8 T cells with E values reported by MEME and central enrichment as reported by CentriMo. (D) Percent of IDR peaks from <125-bp fragments containing motifs described in (C). (E) Proportion of peaks falling in specific genomic contexts for peaks generated from CUT&RUN fragments separated into <125 and >150-bp–size classes.
Figure S9.
Figure S9.. HEK 293 cleavage under targets and release under nuclease (CUT&RUN) summary.
CUT&RUN was used to identify regions of DNA bound by Zbtb20 in HEK 293 cells. (A) Table indicating the number of irreproducible discovery rate (IDR) peaks identified from two replicate samples for CUT&RUN fragments separated into <125 and >150-bp–size classes. (B) Heat maps and signal for IDR Zbtb20 CUT&RUN peaks generated from fragments separated into <125 and >150-bp–size classes and signal from all fragments generated by targeting histone methylation H3K4me3 as a technical positive control. (C) De novo motif discovery analysis in Zbtb20 CUT&RUN peaks generated from <125-bp fragments in CD8 T cells with E values reported by MEME and central enrichment as reported by CentriMo. (D) De novo motif discovery analysis in Zbtb20 CUT&RUN peaks generated from >150-bp fragments in CD8 T cells with E values reported by MEME and central enrichment as reported by CentriMo. (E) Percent of IDR peaks from <125 and >150-bp fragments containing motifs described in (C, D). (F) Proportion of peaks falling in specific genomic contexts for peaks generated from CUT&RUN fragments separated into <125 and >150-bp–size classes.

Similar articles

Cited by

References

    1. Akondy RS, Fitch M, Edupuganti S, Yang S, Kissick HT, Li KW, Youngblood BA, Abdelsamed HA, McGuire DJ, Cohen KW, et al. (2017) Origin and differentiation of human memory CD8 T cells after vaccination. Nature 552: 362–367. 10.1038/nature24633 - DOI - PMC - PubMed
    1. Andrews S (2010) FastQC: A Quality Control Tool for High Throughput Sequence Data. Available at: http://www.bioinformatics.babraham.ac.uk/projects/fastqc/.
    1. Atsaves V, Leventaki V, Rassidakis GZ, Claret FX (2019) AP-1 transcription factors as regulators of immune responses in cancer. Cancers 11: 1037. 10.3390/cancers11071037 - DOI - PMC - PubMed
    1. Bailey TL, Johnson J, Grant CE, Noble WS (2015) The MEME suite. Nucleic Acids Res 43: W39–W49. 10.1093/nar/gkv416 - DOI - PMC - PubMed
    1. Beaulieu AM, Sant’Angelo DB (2011) The BTB-ZF family of transcription factors: Key regulators of lineage commitment and effector function development in the immune system. J Immunol 187: 2841–2847. 10.4049/jimmunol.1004006 - DOI - PMC - PubMed

Publication types

MeSH terms