. 2023 Jul 6;6(9):e202201721.
doi: 10.26508/lsa.202201721. Print 2023 Sep.

Differential roles of FOXC2 in the trabecular meshwork and Schlemm's canal in glaucomatous pathology

Affiliations

Differential roles of FOXC2 in the trabecular meshwork and Schlemm's canal in glaucomatous pathology

Naoto Ujiie et al. Life Sci Alliance. .

Abstract

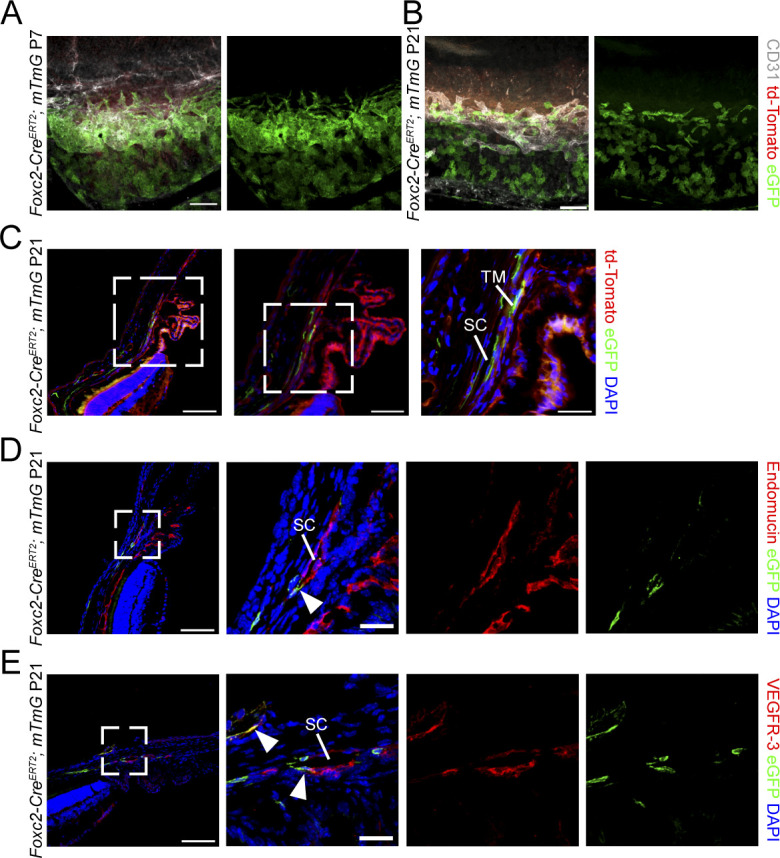
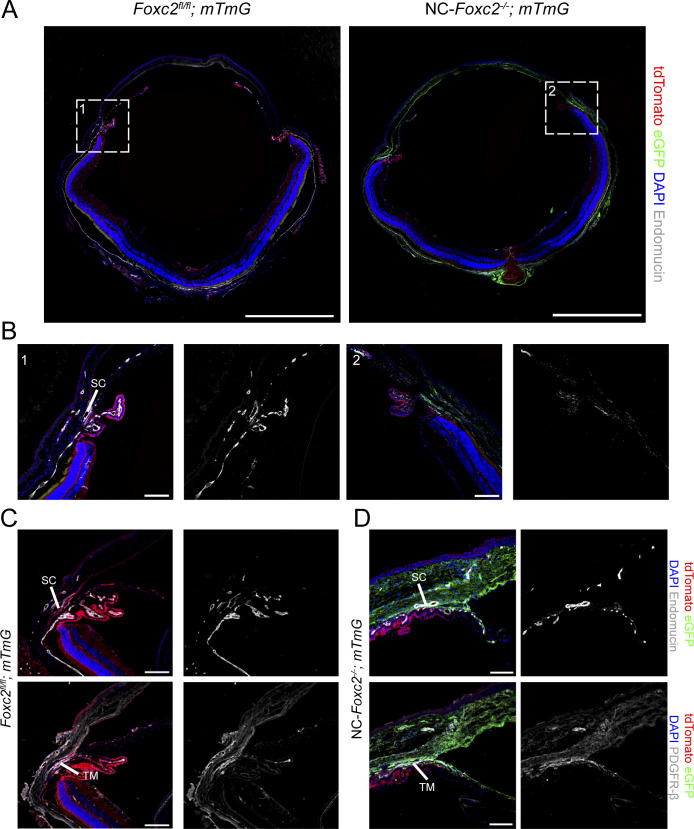
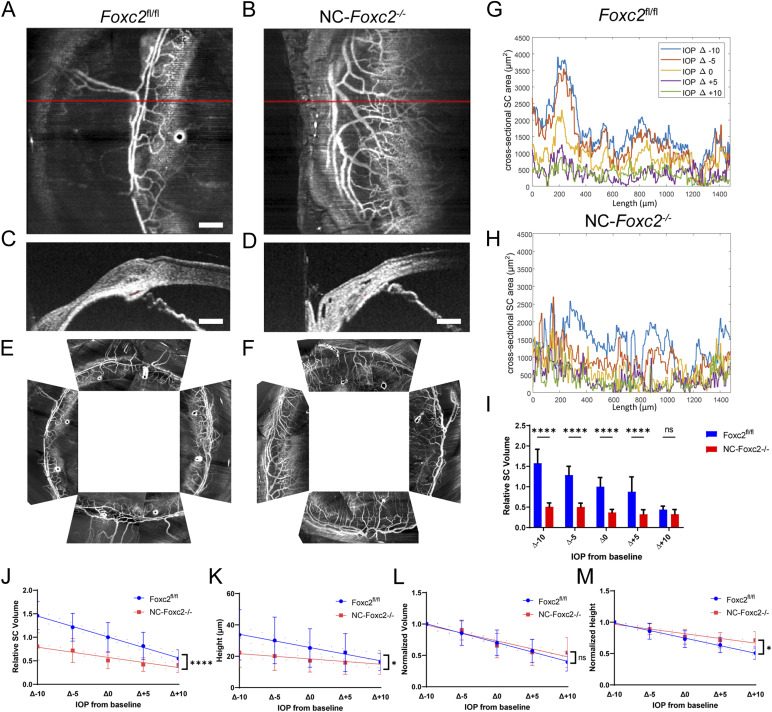
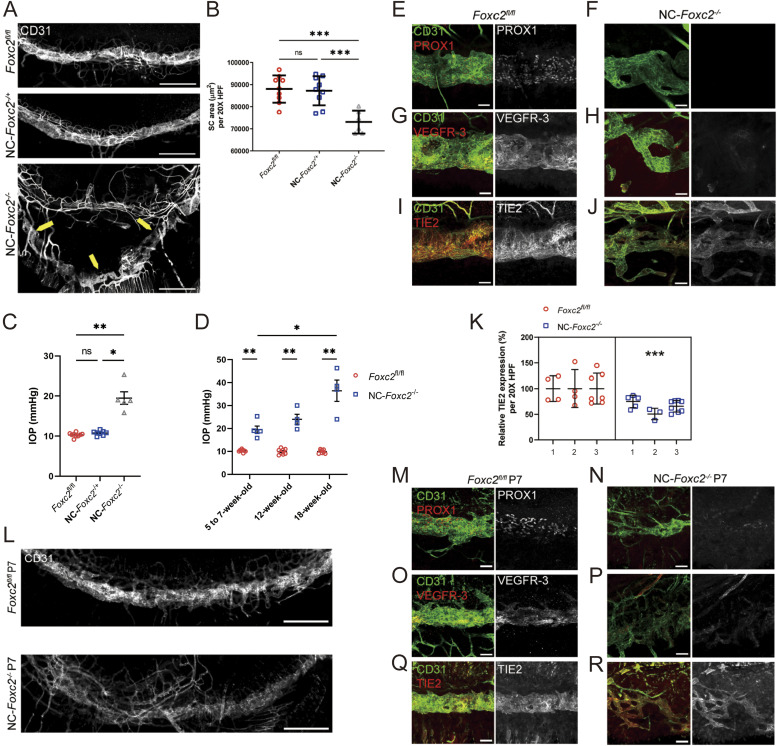
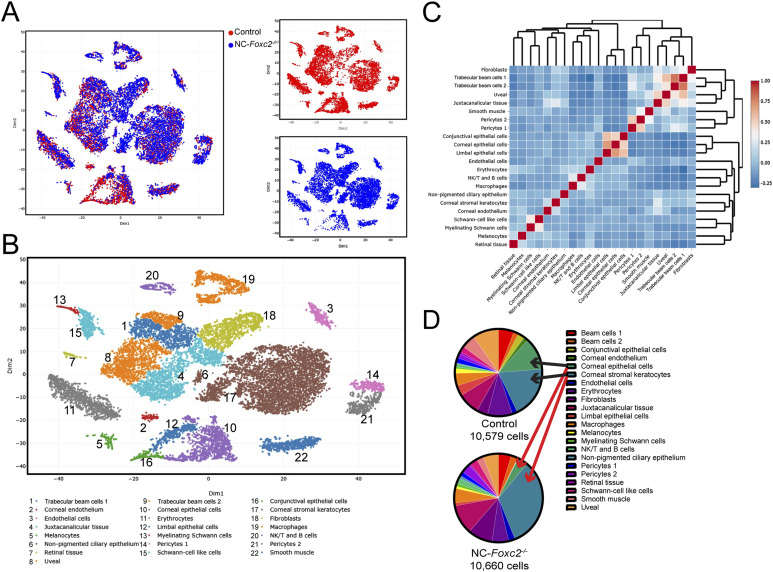
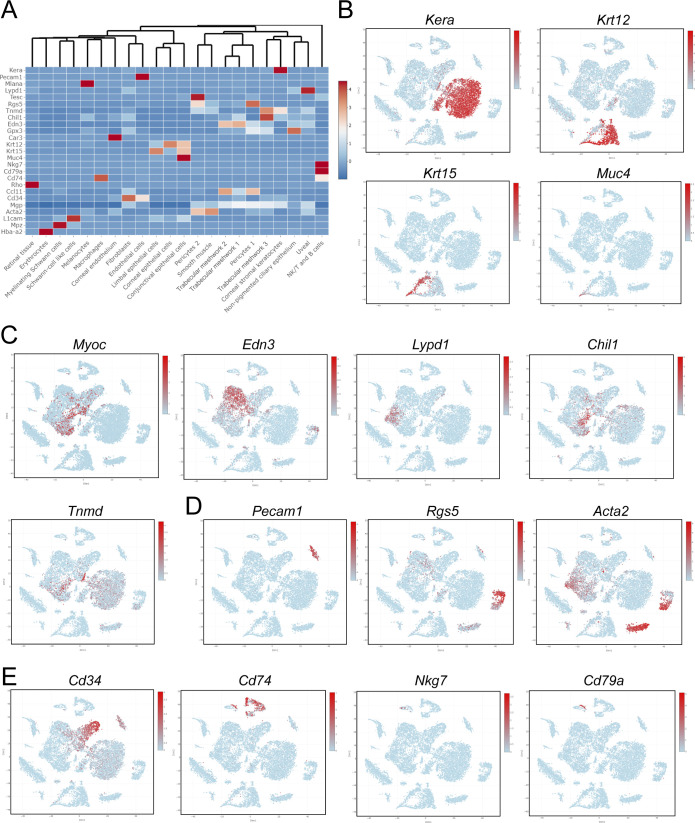
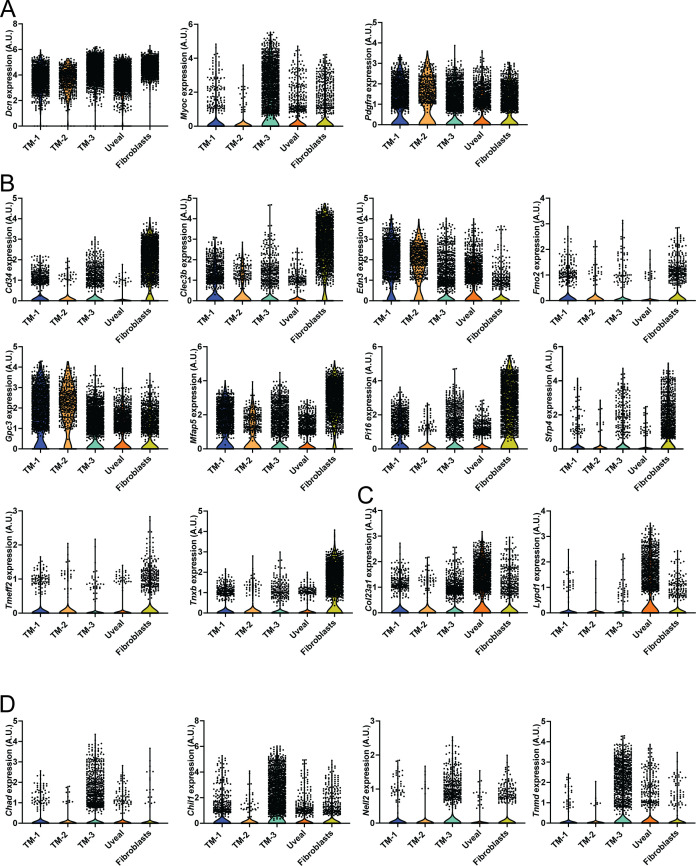
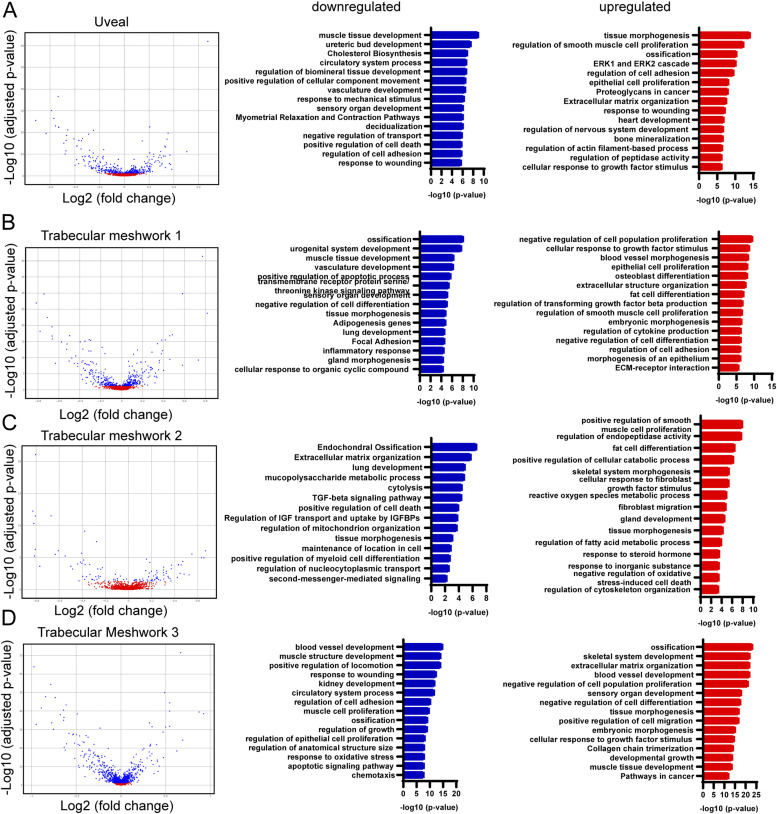
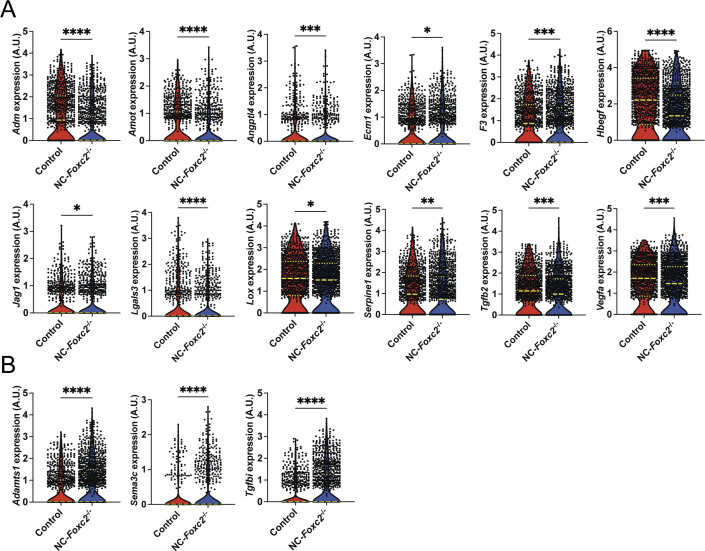
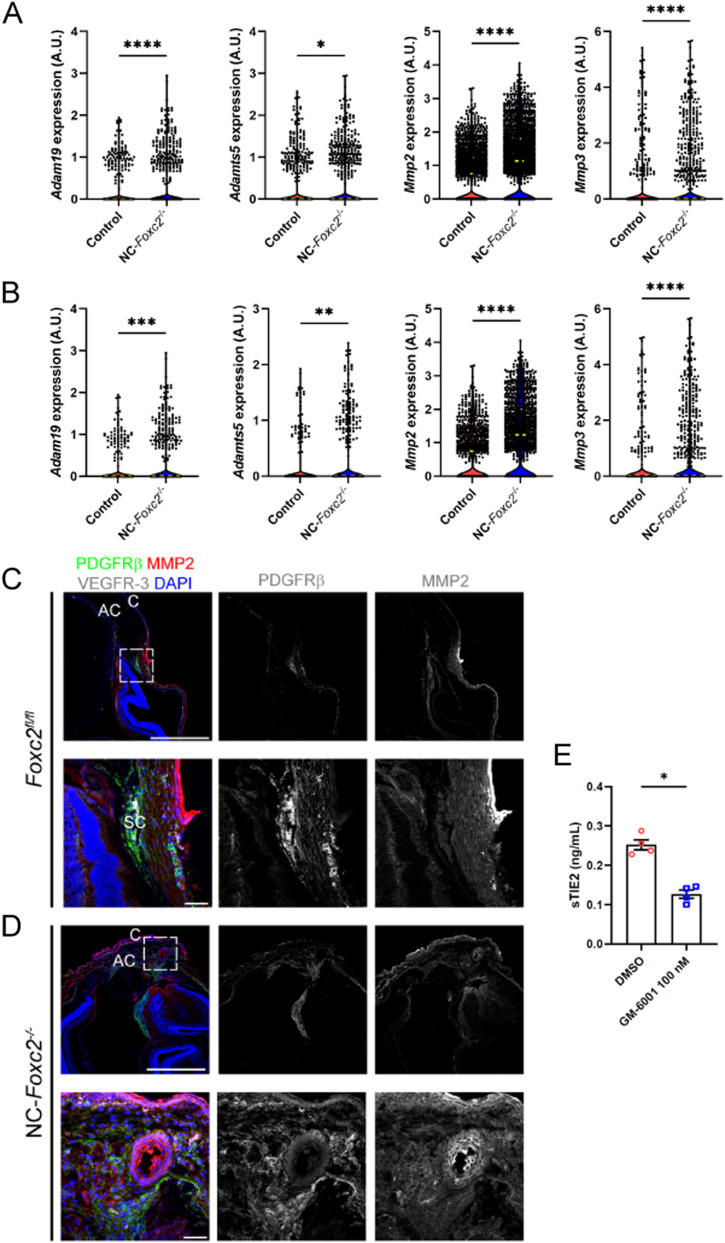
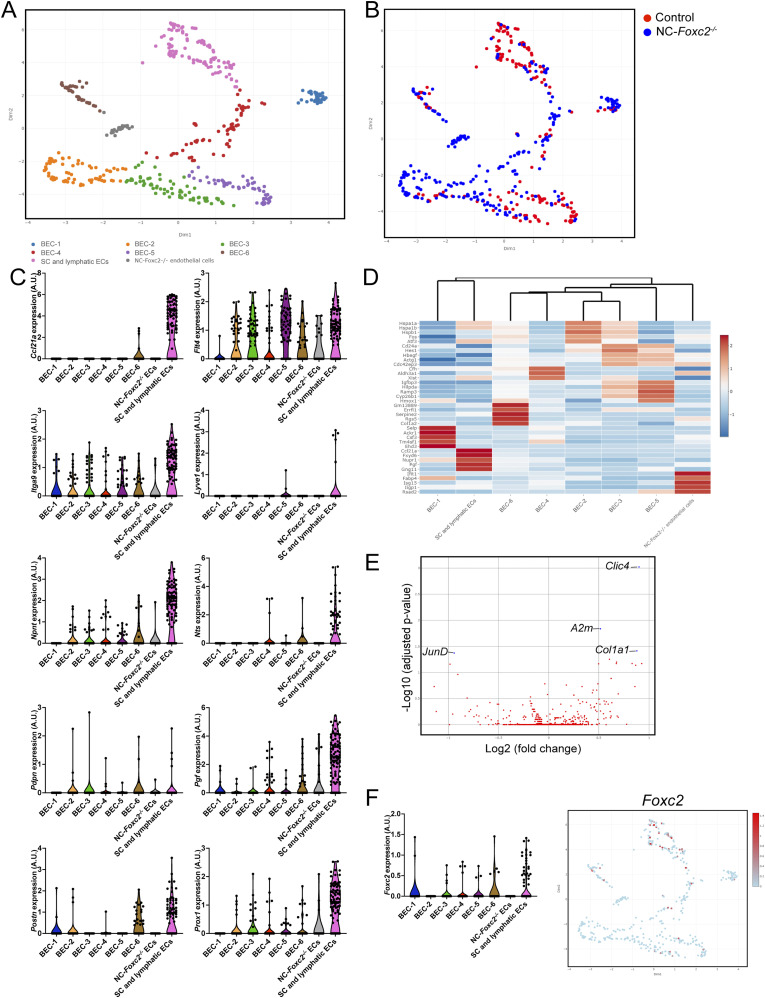
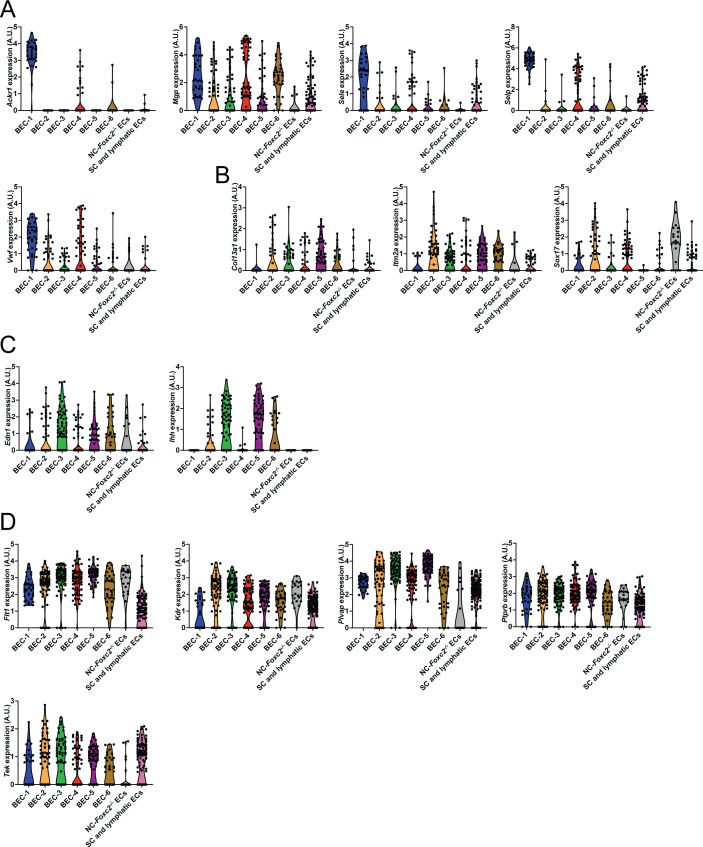
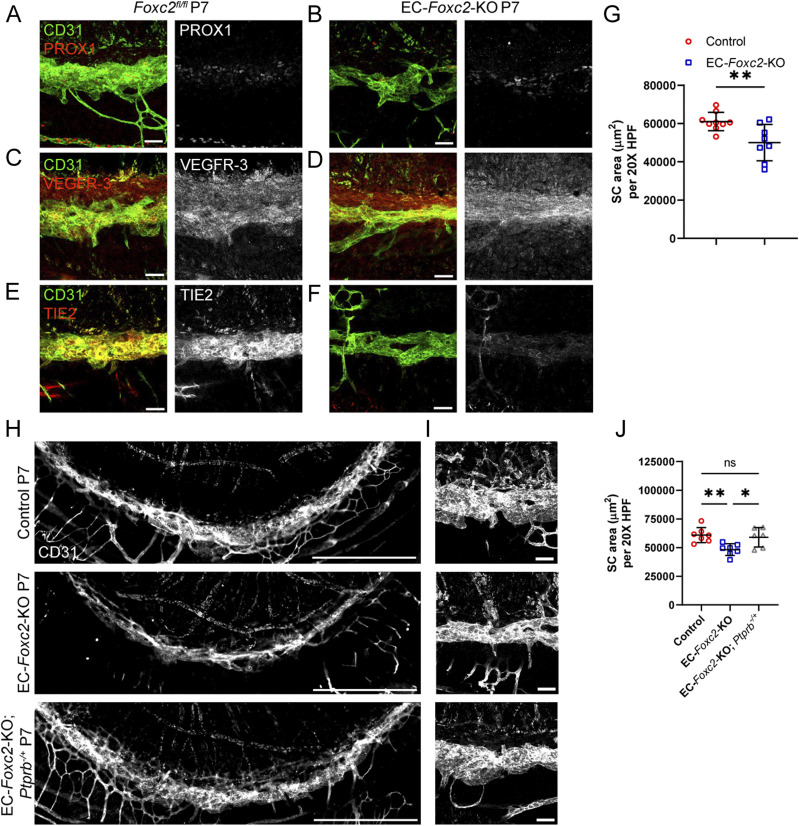
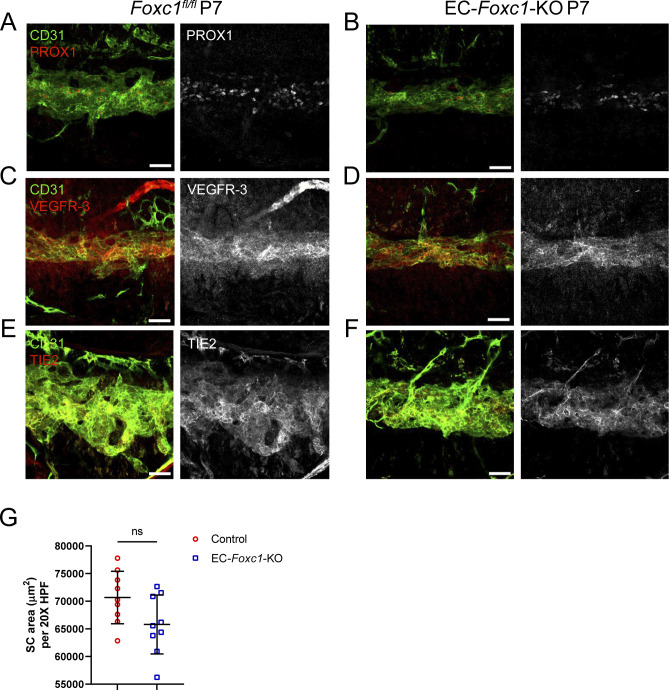
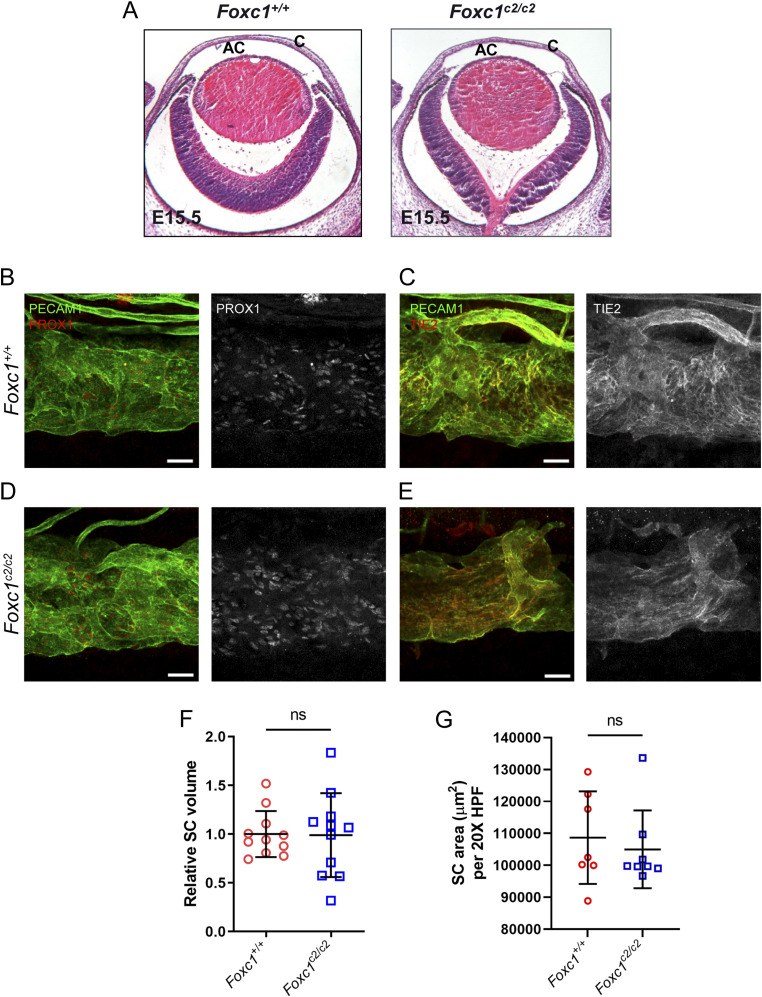
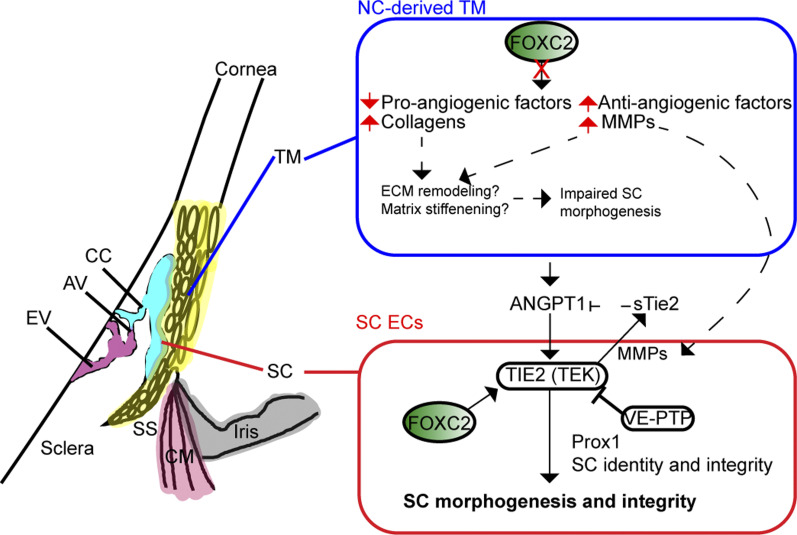
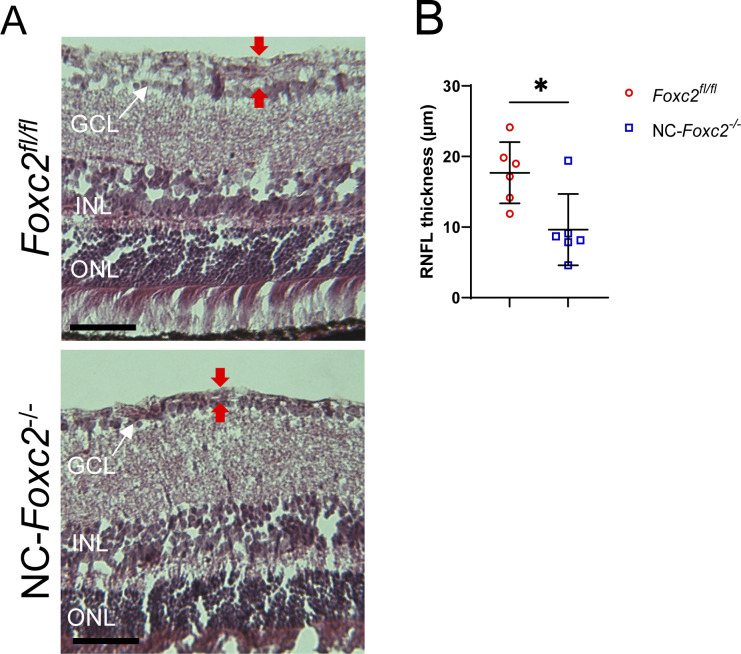
Impaired development and maintenance of Schlemm's canal (SC) are associated with perturbed aqueous humor outflow and intraocular pressure. The angiopoietin (ANGPT)/TIE2 signaling pathway regulates SC development and maintenance, whereas the molecular mechanisms of crosstalk between SC and the neural crest (NC)-derived neighboring tissue, the trabecular meshwork (TM), are poorly understood. Here, we show NC-specific forkhead box (Fox)c2 deletion in mice results in impaired SC morphogenesis, loss of SC identity, and elevated intraocular pressure. Visible-light optical coherence tomography analysis further demonstrated functional impairment of the SC in response to changes in intraocular pressure in NC-Foxc2 -/- mice, suggesting altered TM biomechanics. Single-cell RNA-sequencing analysis identified that this phenotype is predominately characterized by transcriptional changes associated with extracellular matrix organization and stiffness in TM cell clusters, including increased matrix metalloproteinase expression, which can cleave the TIE2 ectodomain to produce soluble TIE2. Moreover, endothelial-specific Foxc2 deletion impaired SC morphogenesis because of reduced TIE2 expression, which was rescued by deleting the TIE2 phosphatase VE-PTP. Thus, Foxc2 is critical in maintaining SC identity and morphogenesis via TM-SC crosstalk.


Conflict of interest statement

The authors declare the following competing interests: SE Quaggin is an inventor of patents related to therapeutic targeting of the ANGPT-TEK pathway in ocular hypertension and glaucoma and owns stock in and is a director of Mannin Research. SE Quaggin also receives consulting fees from AstraZeneca, Hanssen, the Lowry Medical Research Foundation, and Roche/Genentech; is Chair of the External Scientific Advisory Board for AstraZeneca; and is a scientific advisor or member of AstraZeneca, Genentech/Roche, the Karolinska CVRM Institute, the Lowry Medical Research Institute, Mannin, and Novartis. HF Zhang has financial interests in Opticent, Inc. The other authors declare no competing interests.

Figures

Figure S1.
Figure S1.. Fate-mapping of Foxc2 expression in cells of the trabecular meshwork and SC vasculature.
(A, B) Representative image of the SC vasculature from P7 (A) and P21 (B) Foxc2-CreERT2; mTmG mice treated with tamoxifen from postnatal day (P1) to P5 demonstrating Foxc2-GFP expression in the cells of the TM proximal to the SC and the SC vasculature denoted by CD31 immunostaining. Scale bar is 100 μm. (C) Representative cross-sectional images of eGFP-expressing, Foxc2-Cre-mediated recombined cells in the SC and TM of a P21 Foxc2-CreERT2; mTmG mouse. Boxed areas denote magnified regions in sequential panels. TM, trabecular meshwork; SC, Schlemm’s canal. Pink, dashed line denotes the SC vessel. Scale bars are 100, 50, and 25 μm, respectively. (D, E) Representative cross-sectional images of eGFP-expressing, Foxc2-Cre-mediated recombined cells in the SC of a P21 Foxc2-CreERT2; mTmG mouse immunostained with endomucin (D) or VEGFR-3 (E). Boxed areas denote magnified regions in the next panels. SC, Schlemm’s canal. Arrowheads denote GFP-positive and endomucin- or VEGFR-3- positive cells. Scale bars are 100 and 25 μm, respectively.
Figure S2.
Figure S2.. Fate-mapping of neural crest-derived cell populations in NC-Foxc2-/- mice.
(A) Representative images of eye sections from 3-wk-old control Foxc2fl/fl; mTmG and NC-Foxc2-/-; mTmG mice immunostained with antibody against endomucin where eGFP expression is regulated by Wnt1-Cre-mediated recombination. Scale bars are 1 mm. (A, B) Magnified images of boxed regions denoted in (A). Scale bars are 100 μm. (C, D) Representative images of sections of the iridocorneal angle from a 3-wk-old NC-Foxc2-/-; mTmG individual with a severe phenotype (D) compared with a control Foxc2fl/fl; mTmG individual immunostained with antibody against endomucin or PDGFR-β. Scale bars are 100 μm.
Figure 1.
Figure 1.. Vis-OCTA and vis-OCT identify corneal neovascularization and reduced SC area and volume in NC-Foxc2-/- mice.
(A, B) Representative angiograms of an individual vis-OCTA raster scan from adult, 7-mo-old Foxc2fl/fl control (A) and NC-Foxc2-/- (B) mice. (C, D) Representative cross-sectional vis-OCT B-scan images from Foxc2fl/fl control (C) and NC-Foxc2-/- (D) mice. Red shaded area denotes the SC area. (E, F) Representative compound circumlimbal scans composed of eight separate raster angiograms each from Foxc2fl/fl control (E) and NC-Foxc2-/- (F) mice. Scale bar: 200 μm. (G) Representative plot of SC area versus length from one adult Foxc2fl/fl control mouse at IOP levels ranging from 10 mmHg below baseline IOP to 10 mmHg above baseline IOP. SC area is measured from segmented vis-OCT B-scan images. (H) Representative plots of the SC area versus length from one adult NC-Foxc2-/- mice at IOP levels ranging from 10 mmHg below baseline IOP to 10 mmHg above baseline IOP. (I) Relative SC volume plotted against change in IOP, where the cycle of IOP changes was repeated three times in the same mouse to give a mean and standard error for N = 3 Control and N = 4 NC-Foxc2-/- mice. SC volume for each IOP and group was normalized by the mean Foxc2fl/fl control SC volume at baseline IOP. (J, K) Linear fit of relative SC volume and height as a function of IOP with 95% confidence interval of fits given by dotted lines for N = 6 Control and N = 6 NC-Foxc2-/- mice where each IOP level was repeated three times. (L, M) Linear fit of normalized volume and SC height relative to mean height at 10 mmHg below baseline IOP for each eye with 95% confidence error of fits given for N = 6 Control and N = 6 NC-Foxc2-/- mice where each IOP level was repeated three times. Statistical analysis: two-way ANOVA with Šídák’s multiple comparisons test. *P < 0.05, **P < 0.01, ***, P < 0.001, ****P < 0.0001. Source data are available for this figure.
Figure 2.
Figure 2.. Neural crest-derived Foxc2 is required for proper morphogenesis of the SC and establishment of SC identity.
(A) Representative images of SC vasculature immunostained with CD31 antibody in adult, Foxc2fl/fl control, NC-Foxc2-/+, and NC-Foxc2-/- mice. Yellow arrows highlight abnormal SC morphology and displacement in a NC-Foxc2-/- individual. Scale bars are 500 μm. (B) Quantification of SC area per 20X high-power field (HPF). N = 9 for Foxc2fl/fl controls. N = 9 for NC-Foxc2-/+. N = 6 for NC-Foxc2-/-. Data are mean ± SD. Statistical analysis: Mann–Whitney U test. ***P < 0.001. (C) Quantification of IOP in 5–7-wk-old mice measured by a rebound tonometer. N = 9 for Foxc2fl/fl controls. N = 8 for NC-Foxc2-/+. N = 5 for NC-Foxc2-/-. Data are mean ± SD. Statistical analysis: Mann-Whitney U test. *P < 0.05. **P < 0.01. (D) Quantification of IOP in 5–7-wk-old, 12-wk-old, and 18-wk-old mice measured by a rebound tonometer. Data are mean ± SD. Statistical analysis: Mann–Whitney U test. *P < 0.05. **P < 0.01. (E, F, G, H, I, J) Representative images of CD31 and PROX1 (E, F), VEGFR-3 (G, H) or Tie2 (I, J) expression in the SC of adult Foxc2fl/fl Control (E, G, I) and NC-Foxc2-/- mice (F, H, J). Scale bars are 50 μm. (K) Quantification of the relative expression of Tie2 in the SC of Foxc2fl/fl Control and NC-Foxc2-/- mice per 20X high-power field. N = 3 for Foxc2fl/fl controls and N = 3 for NC-Foxc2-/-. Symbols depict technical replicates per individual. Data are mean ± SD. Statistical analysis: nested unpaired t test. ***P < 0.001. (L) Representative images of SC vasculature immunostained with CD31 antibody show abnormal morphology and reduced area in P7 NC-Foxc2-/- mice compared with P7 Foxc2fl/fl Control mice. Scale bars are 500 μm. (M, N, O, P, Q, R) Representative images of CD31 and PROX1 (M, N), VEGFR-3 (O, P), or Tie2 (Q, R) expression in the SC of P7 Foxc2fl/fl Control (M, O, Q) and NC-Foxc2-/- mice (N, P, R). Scale bars are 50 μm. Source data are available for this figure.
Figure S3.
Figure S3.. Quantification of outflow facility.
(A, B) Quantification of outflow facility for individual mice (A) and each eye (B) measured by an iPerfusion system in adult 9–11-wk-old Foxc2fl/fl control and NC-Foxc2-/- mice. (A) Data for individual mice were calculated as the average value of the right and left eyes. N = 10 for Foxc2fl/fl controls. N = 7 for NC-Foxc2-/-. (B) Data for each eye. N = 18 eyes for Foxc2fl/fl controls. N = 14 eyes for NC-Foxc2-/-. Data are mean ± SD. Statistical analysis: Mann–Whitney U test. Source data are available for this figure.
Figure 3.
Figure 3.. Single-cell transcriptome profiling of cell populations in the anterior eye segment of Control and NC-Foxc2-/- mice.
(A, B) Visualization of individual cell contribution (A) and unsupervised clustering analysis of 22 transcriptionally distinct cell populations (B) by t-distributed stochastic neighbor embedding in the anterior eye segment of 3–4-wk-old Foxc2fl/fl Control and NC-Foxc2-/- mice. (C) Correlation heatmap and hierarchical clustering of gene-expression signatures of all cell populations. (D) Pie charts demonstrating the proportion of the total cell number analyzed contributing to each individual cell cluster for Control and NC-Foxc2-/- mice. Source data are available for this figure.
Figure S4.
Figure S4.. Characterization of cluster phenotypes.
(A) Heatmap and hierarchical clustering of cell populations based on selective genes uniquely expressed in each cell population. (B, C, D, E) t-SNE plots colorized by the Seurat-normalized expression of Kera, Krt12, Krt15, and Muc4 identifying corneal stromal keratocytes and epithelial cell populations (B), Myoc, Edn3, Lypd1, Chil1, and Tnmd identifying trabecular meshwork cell populations (C), Pecam1, Rgs5, and Acta2 identifying endothelial, pericyte, and smooth muscle cell populations (D), or Cd34, Cd74, Nkg7, and Cd79a identifying fibroblast, macrophage, NK/T, and B cell populations (E).
Figure S5.
Figure S5.. Characterization of trabecular meshwork clusters.
(A, B, C, D) Violin plots showing the expression of Dcn, Myoc, and Pdgfra (A), Cd34, Clec3b, Edn3, Fmo2, Gpc3, Mfap5, Pi16, Sfrp4, Tmeff2, and Tnxb (B), Col23a1, and Lypd1 (C), Chad, Chil1, Nell2, and Tnmd (D) from trabecular meshwork, uveal meshwork, and fibroblast clusters. Clusters are color coded as in Fig 3. Source data are available for this figure.
Figure 4.
Figure 4.. Differentially expressed genes in trabecular meshwork cell populations of NC-Foxc2-/- mice compared with Foxc2fl/fl Controls and GO over-representation analysis.
(A, B, C, D) Volcano plots showing DEGs between NC-Foxc2-/- and Foxc2fl/fl Control mice in the trabecular meshwork 1 (A), trabecular meshwork 2 (B), trabecular meshwork 3 (C), and uveal meshwork clusters (D), left panels. Blue points denote DEGs with adjusted P-value < 0.05. Bar plots of subsets of GO gene sets that were overrepresented among the genes down-regulated (blue bars) or up-regulated (red bars) in NC-Foxc2-/- mice compared with Foxc2fl/fl Control mice, right panels. Values on the x-axis are represented as the –log10(P-value) of each associated GO gene set.
Figure S6.
Figure S6.. sc-RNA seq analysis identifies differentially expressed genes related to angiogenesis and ECM organization between Control and NC-Foxc2-/- mice in cells comprising the trabecular meshwork 3 cluster.
(A, B) Violin plots showing differential expression of Adm, Amot, Angptl4, Ecm1, F3, Hbegf, Jag1, Lgals3, Lox, Serpine1, Tgfb2, and Vegfa (A), Adamts1, Sema3c, and Tgfbi (B) between Control and NC-Foxc2-/- mice. Long, dashed lines denote median values. Statistical analysis: Mann–Whitney Test. *P < 0.05, **P < 0.01, ***P < 0.001, ****P < 0.0001. Source data are available for this figure.
Figure 5.
Figure 5.. sc-RNA seq analysis of genes related to MMP.
(A, B) sc-RNA seq analysis identifies differentially expressed genes related to MMPs between Control and NC-Foxc2-/- mice in cells comprising the trabecular meshwork (A) and trabecular meshwork 3 (B) clusters. Violin plots showing differential expression of Adam19, Adamts5, Mmp2, and Mmp3 in the TM cluster (A) and TM-3 cluster (B) between Control and NC-Foxc2-/- mice. Long, dashed lines denote median values. Statistical analysis: Mann–Whitney Test. *P < 0.05, **P < 0.01, ***P < 0.001, ****P < 0.0001. (C, D) Representative cross-section images of the iridocorneal angle and anterior chamber of a Foxc2fl/fl control (C) and NC-Foxc2-/- individual (D) immunostained with PDGFRβ, MMP2, VEGFR-3, and DAPI. Boxed regions in top panels denote magnified regions in lower panels. Scale bars are 500 μm and 50 μm, respectively. C, cornea; AC, anterior chamber; SC, Schlemm’s canal. (E) Quantification of sTIE2 in conditioned media from cultured HDLECs treated with DMSO vehicle or GM-6001 at 100 nM by ELISA (E). Data are mean ± SD from three biological replicates. Statistical analysis: Mann–Whitney U test. *P < 0.05. Source data are available for this figure.
Figure 6.
Figure 6.. Single-cell transcriptome profiling of endothelium in the anterior eye segment of Control and NC-Foxc2-/- mice.
(A, B) Visualization of unsupervised subclustering analysis of eight transcriptionally distinct endothelial cell populations (A) and individual cell contribution (B) by Uniform Manifold Approximation and Projection of the endothelial cell cluster identified in Fig 4B. (C) Violin plots showing the expression of gene markers from the endothelial subclusters. (D) Feature heatmap and hierarchical clustering of gene-expression levels of the top five marker genes for each endothelial subcluster. Colors represent row-wise scaled gene expression with a mean of 0 and SD of 1 (Z scores). (E) Volcano plot showing DEGs between NC-Foxc2-/- and Foxc2fl/fl Control mice in the lymphatic-like endothelium subcluster. Blue points denote DEGs with adjusted P-value < 0.05. (F) Violin plot (left panel) and Uniform Manifold Approximation and Projection (right panel) showing the expression of Foxc2 in each endothelial subcluster. Source data are available for this figure.
Figure S7.
Figure S7.. Characterization of endothelial subclusters.
(A, B, C, D) Violin plots showing the expression of Ackr1, Mgp, Sele, Selp, and Vwf (A), Col13a1, Itm2a, and Sox17 (B), Edn1 and Ihh (C), Flt1, Kdr, Plvap, Ptprb, and Tek (D) from endothelial subclusters. Clusters are color coded as in Fig 6. Source data are available for this figure.
Figure 7.
Figure 7.. SC morphogenesis is impaired by early postnatal, endothelial-specific deletion of Foxc2, which is accompanied by reduced TIE2 expression and rescued by reduction of endothelial Ptprb expression.
(A, B, C, D, E, F) Representative images of CD31 and PROX1 (A, B), VEGFR-3 (C, D) or Tie2 (E, F) expression in the SC of P7 Foxc2fl/fl control (A, C, E) and EC-Foxc2-KO mice (B, D, F). Scale bars are 50 μm. (G) Quantification of SC area per 20X high-power field in P7 Foxc2fl/fl control and EC-Foxc2-KO mice. N = 9 for Control and N = 8 for EC-Foxc2-KO mice. Data are mean ± SD. Statistical analysis: unpaired t test. **P < 0.01. (H, I) Representative images of SC vasculature immunostained with CD31 antibody in P7 Control, EC-Foxc2-KO, and EC-Foxc2-KO; Ptprb-/+ mice. (H, I) Scale bars are 500 μm (H) and 50 μm (I). (J) Quantification of SC area per 20X high-power field in P7 Control, EC-Foxc2-KO, and EC-Foxc2-KO; Ptprb-/+ mice. N = 7 for Control, N = 7 for EC-Foxc2-KO, and N = 6 for EC-Foxc2-KO; Ptprb-/+ mice. Statistical analysis: one-way ANOVA with Tukey’s multiple comparison test. *P < 0.05, **P < 0.01. Source data are available for this figure.
Figure S8.
Figure S8.. SC morphogenesis is not severely impacted by early postnatal, endothelial-specific deletion of Foxc1.
(A, B, C, D, E, F) Representative images of CD31 and PROX1 (A, B), VEGFR-3 (C, D) or Tie2 (E, F) expression in the SC of P7 Foxc1fl/fl control (A, C, E) and EC-Foxc1-KO mice (B, D, F). Scale bars are 50 μm. (G) Quantification of SC area per 20X high-power field in P7 Foxc1fl/fl control and EC-Foxc1-KO mice. N = 9 for Control and N = 9 for EC-Foxc1-KO mice. Data are mean ± SD. Statistical analysis: unpaired t test. Source data are available for this figure.
Figure 8.
Figure 8.. Substitution of Foxc2 into the Foxc1 locus does neither impair anterior eye segment development nor SC morphogenesis.
(A, E) Representative images of hematoxylin and eosin-stained transverse eye sections from embryonic day (E) 15.5 Foxc1+/+ and Foxc1c2/c2 mice show no difference in the normal development of the anterior chamber. AC, anterior chamber, C, cornea. (B, C, D, E) Representative images of CD31 and PROX1 (B, D) or Tie2 (C, E) expression in the SC of adult Foxc1+/+ (B, C) and Foxc1c2/c2 mice (D, E). Scale bars are 50 μm. (F) Relative SC volumes of Foxc1c2/c2 and Foxc1+/+ mice in a 1.5 mm × 1.5 mm field of view. SC volume for both groups was normalized by mean Foxc1+/+ SC volume. N = 11 volumes from 11 individuals for Foxc1+/+ and N = 11 volumes from 11 individuals for Foxc1c2/c2 mice. (G) Quantification of SC area per 20X high-power field. N = 7 for Foxc1+/+ and N = 8 for Foxc1c2/c2 mice. Data are mean ± SD. Statistical analysis: unpaired t test. Source data are available for this figure.
Figure 9.
Figure 9.. Neural crest- and endothelial- derived Foxc2 differentially regulate proper morphogenesis of the SC.
Neural crest-specific deletion of Foxc2 results in several transcriptional changes in the trabecular meshwork including the decrease in expression of pro-angiogenic factors and in contrast an increase in the expression of anti-angiogenic factors, collagens, and MMPs that likely result in abnormal ECM remodeling, matrix stiffening, and induction of TIE2 shedding that potentially contribute to impaired SC morphogenesis. In contrast, endothelial-derived Foxc2 regulates the expression of TIE2 to promote ANGPT1-mediated activation of the TIE2 receptor and, in turn, proper SC morphogenesis and maintenance of SC integrity. TM, trabecular meshwork; SC, Schlemm’s canal; SS, scleral spur; CM, ciliary muscle; CC, collector channel; AV, aqueous veins; EV, episcleral veins.
Figure S9.
Figure S9.. Characterization of retina nerve fiber layer thickness in NC-Foxc2-/- mice.
(A, B) Representative images and quantification of retina nerve fiber layer thickness from hematoxylin and eosin-stained sections. Scale bars are 50 μm. N = 6 Foxc2fl/fl control and N = 6 for NC-Foxc2-/- mice. Data are mean ± SD. Statistical analysis: unpaired t test. *P < 0.05. ONL, outer nuclear layer, INL, inner nuclear layer, GCL, ganglion cell layer. Source data are available for this figure.

Similar articles

Cited by

References

    1. Bourne R, Steinmetz JD, Flaxman S, Briant PS, Taylor HR, Resnikoff S, Casson RJ, Abdoli A, Abu-Gharbieh E, Afshin A, et al. (2021) Trends in prevalence of blindness and distance and near vision impairment over 30 years: An analysis for the global burden of disease study. Lancet Glob Health 9: e130–e143. 10.1016/s2214-109x(20)30425-3 - DOI - PMC - PubMed
    1. Steinmetz JD, Bourne RRA, Briant PS, Flaxman SR, Taylor HRB, Jonas JB, Abdoli AA, Abrha WA, Abualhasan A, Abu-Gharbieh EG, et al. (2021) Causes of blindness and vision impairment in 2020 and trends over 30 years, and prevalence of avoidable blindness in relation to VISION 2020: The right to sight: An analysis for the global burden of disease study. Lancet Glob Health 9: e144–e160. 10.1016/s2214-109x(20)30489-7 - DOI - PMC - PubMed
    1. Allison K, Patel D, Alabi O (2020) Epidemiology of glaucoma: The past, present, and predictions for the future. Cureus 12: e11686. 10.7759/cureus.11686 - DOI - PMC - PubMed
    1. Lewis CJ, Hedberg-Buenz A, DeLuca AP, Stone EM, Alward WL, Fingert JH (2017) Primary congenital and developmental glaucomas. Hum Mol Genet 26: R28–R36. 10.1093/hmg/ddx205 - DOI - PMC - PubMed
    1. Goel M, Picciani RG, Lee RK, Bhattacharya SK (2010) Aqueous humor dynamics: A review. Open Ophthalmol J 4: 52–59. 10.2174/1874364101004010052 - DOI - PMC - PubMed

Publication types

Substances