. 2023 Jul 13;10(7):ENEURO.0146-23.2023.
doi: 10.1523/ENEURO.0146-23.2023. Print 2023 Jul.

Distinct Frontoparietal Brain Dynamics Underlying the Co-Occurrence of Autism and ADHD

Affiliations

Distinct Frontoparietal Brain Dynamics Underlying the Co-Occurrence of Autism and ADHD

Daichi Watanabe et al. eNeuro. .

Abstract

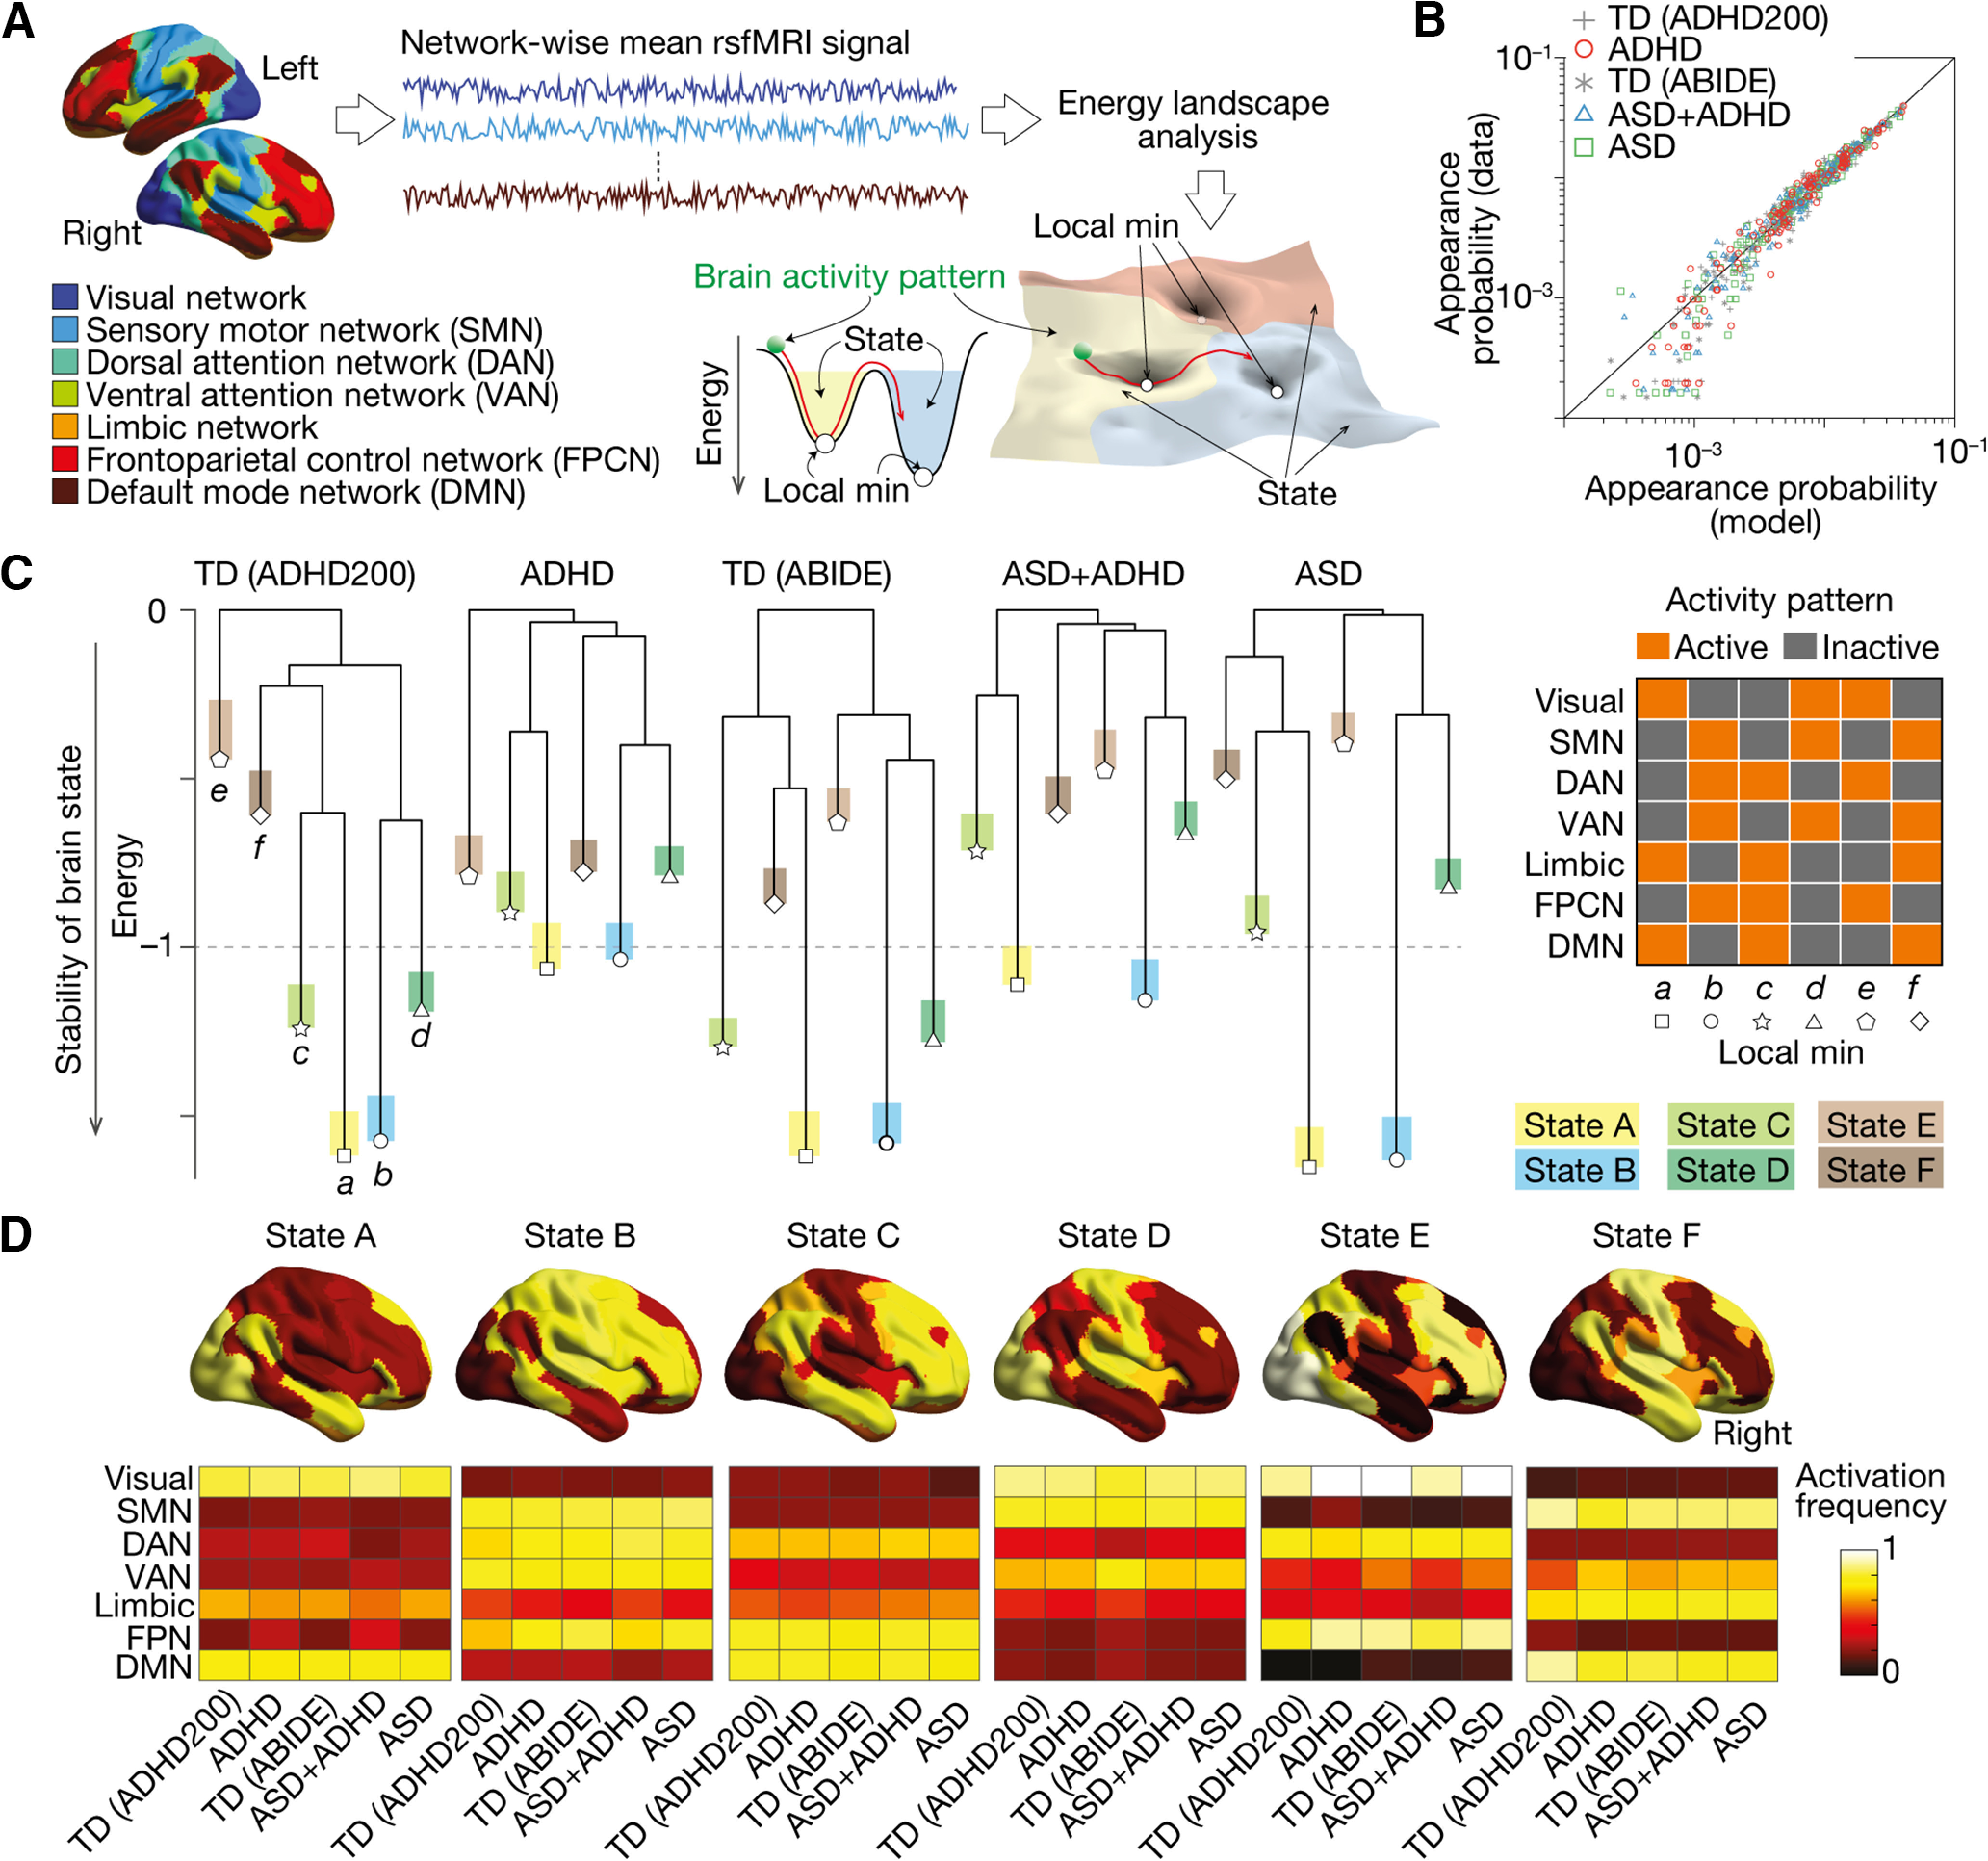
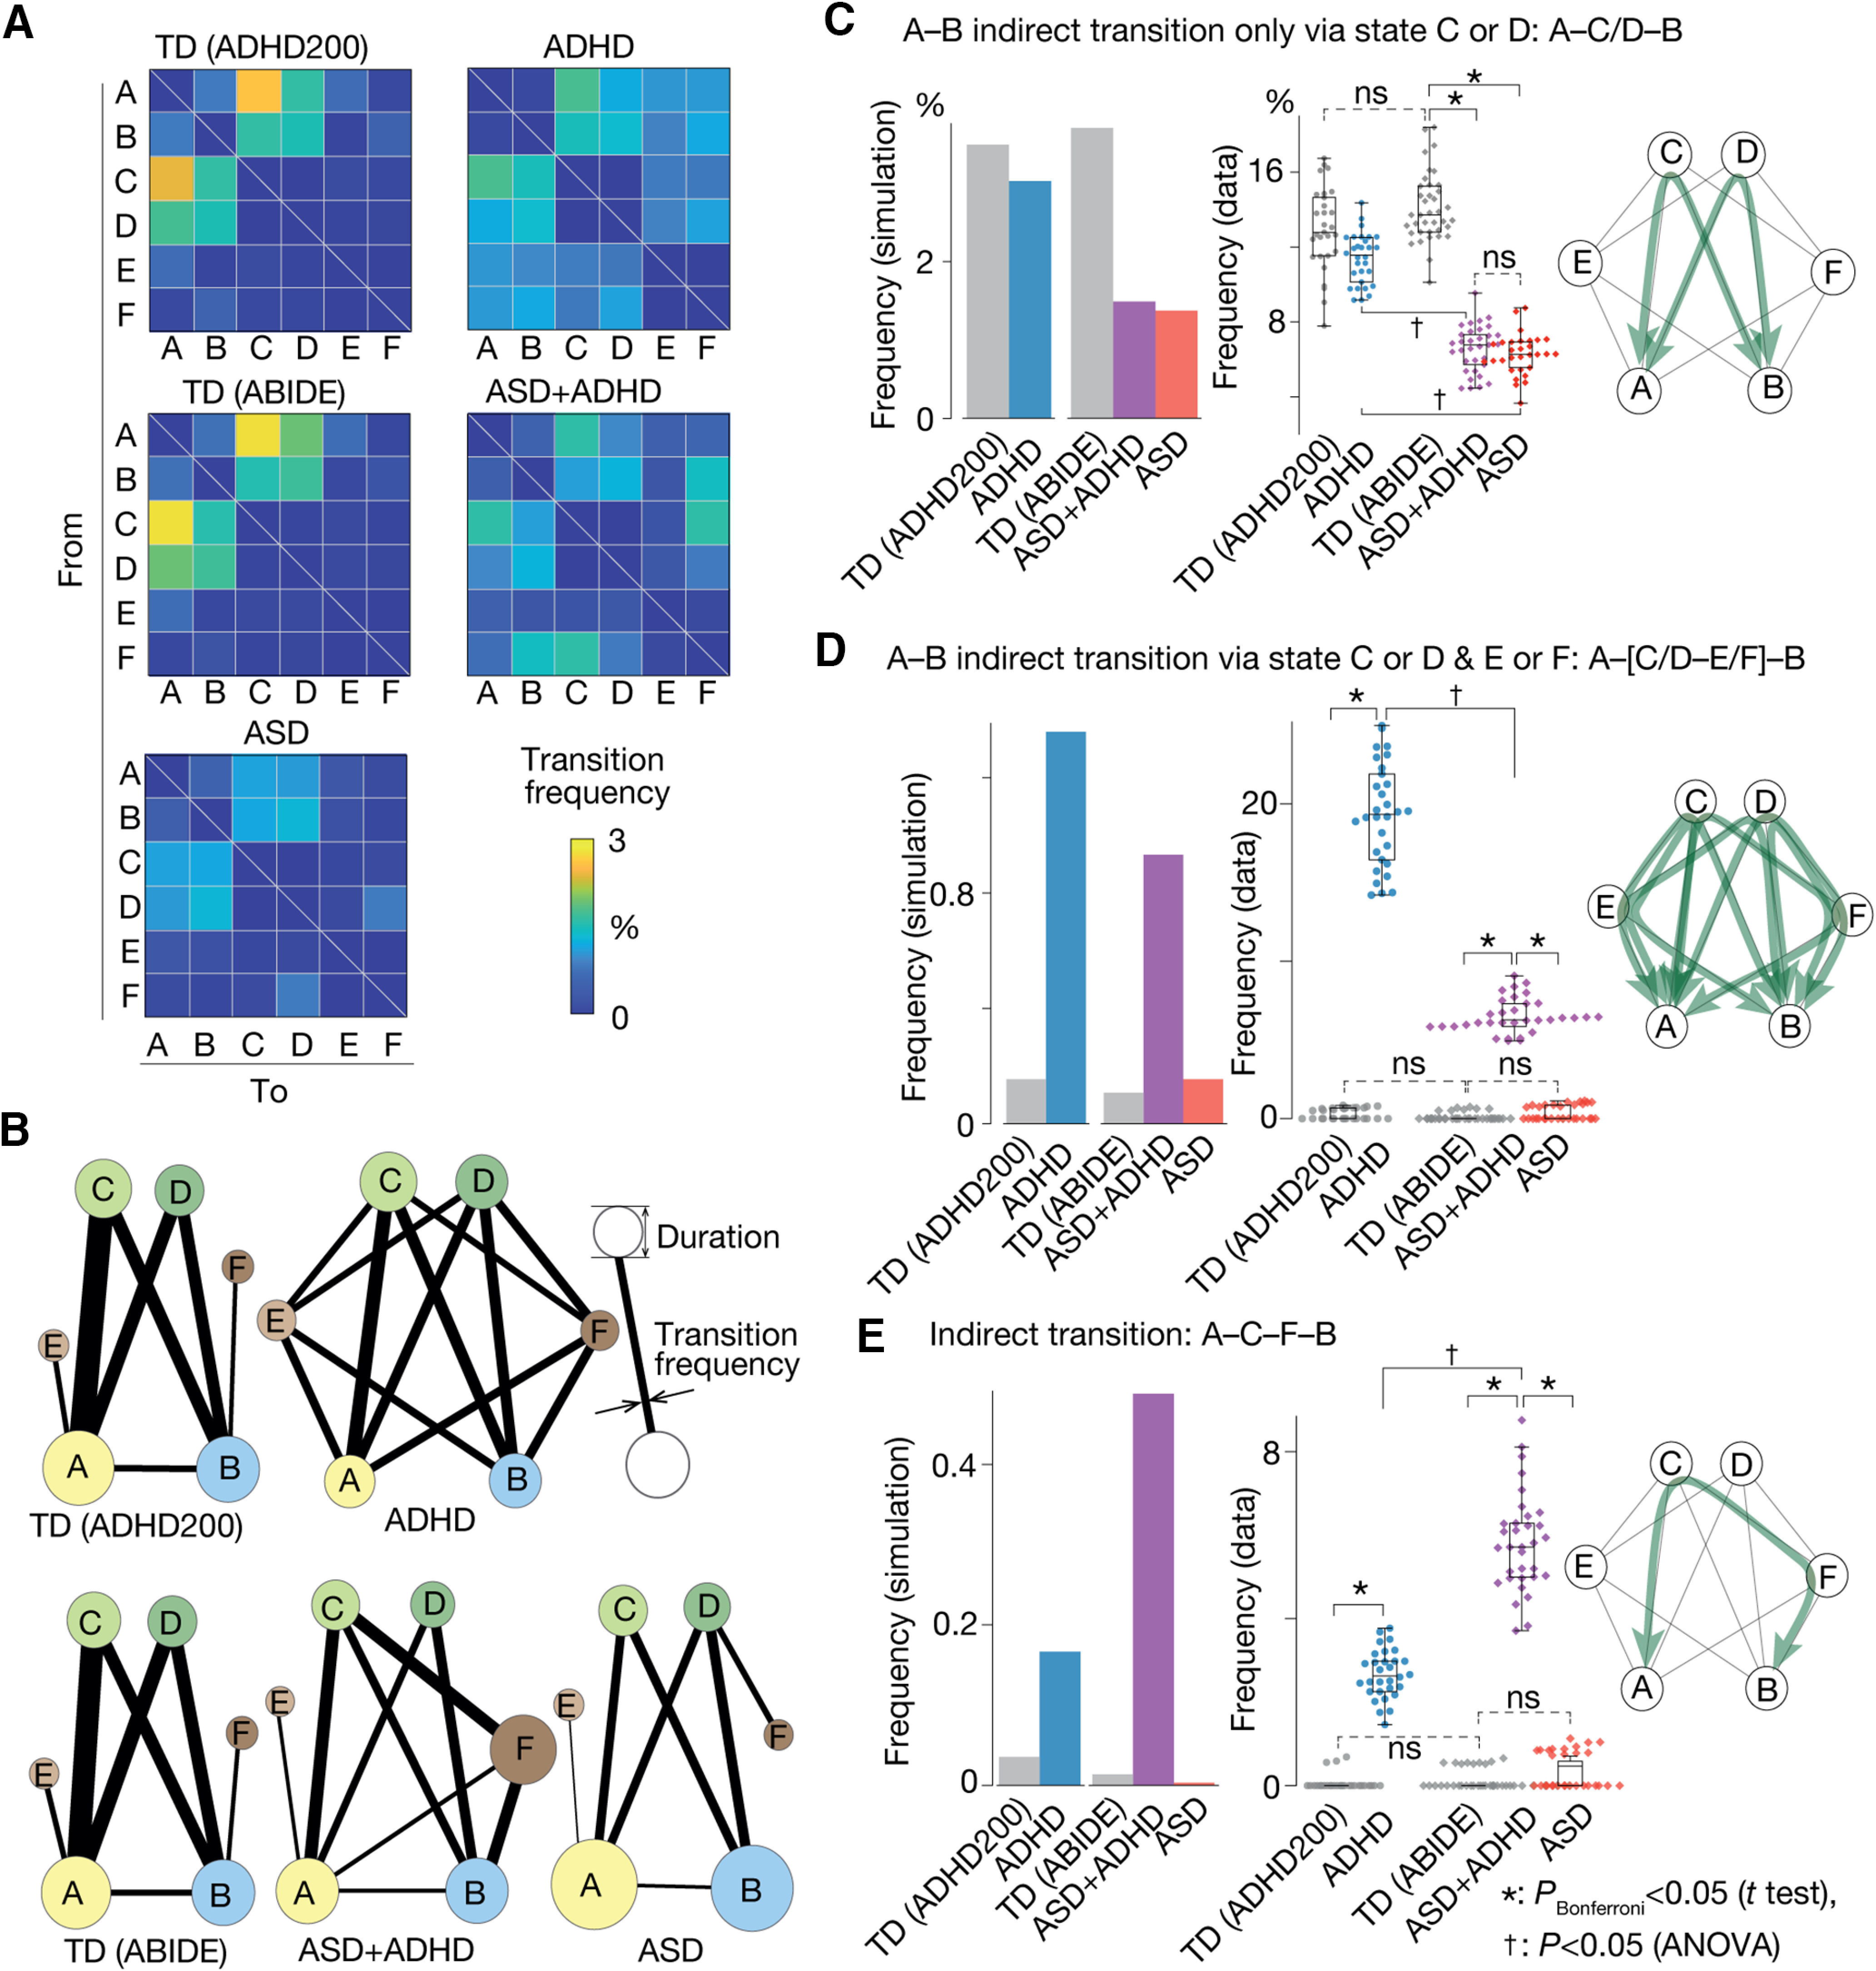
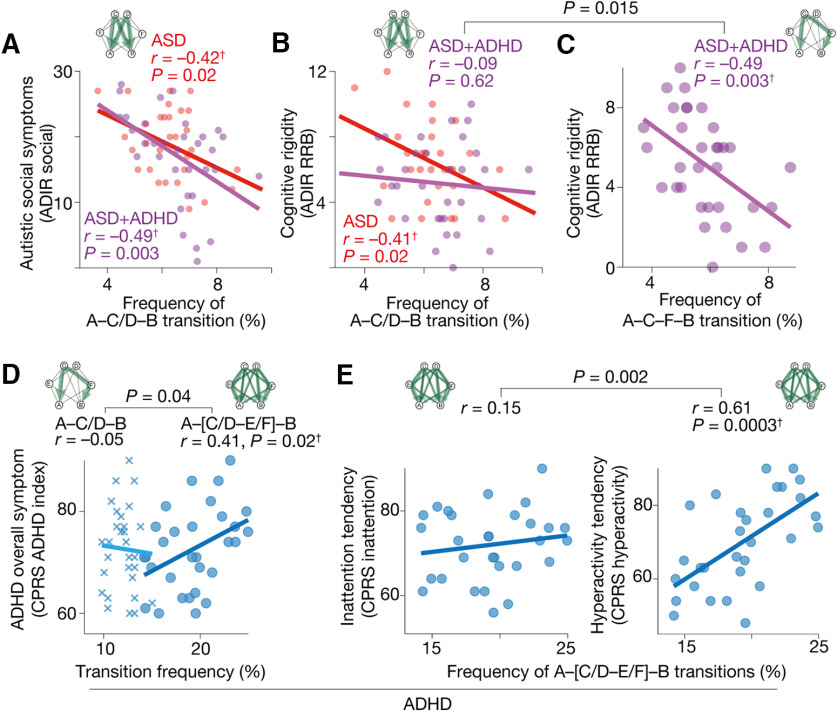
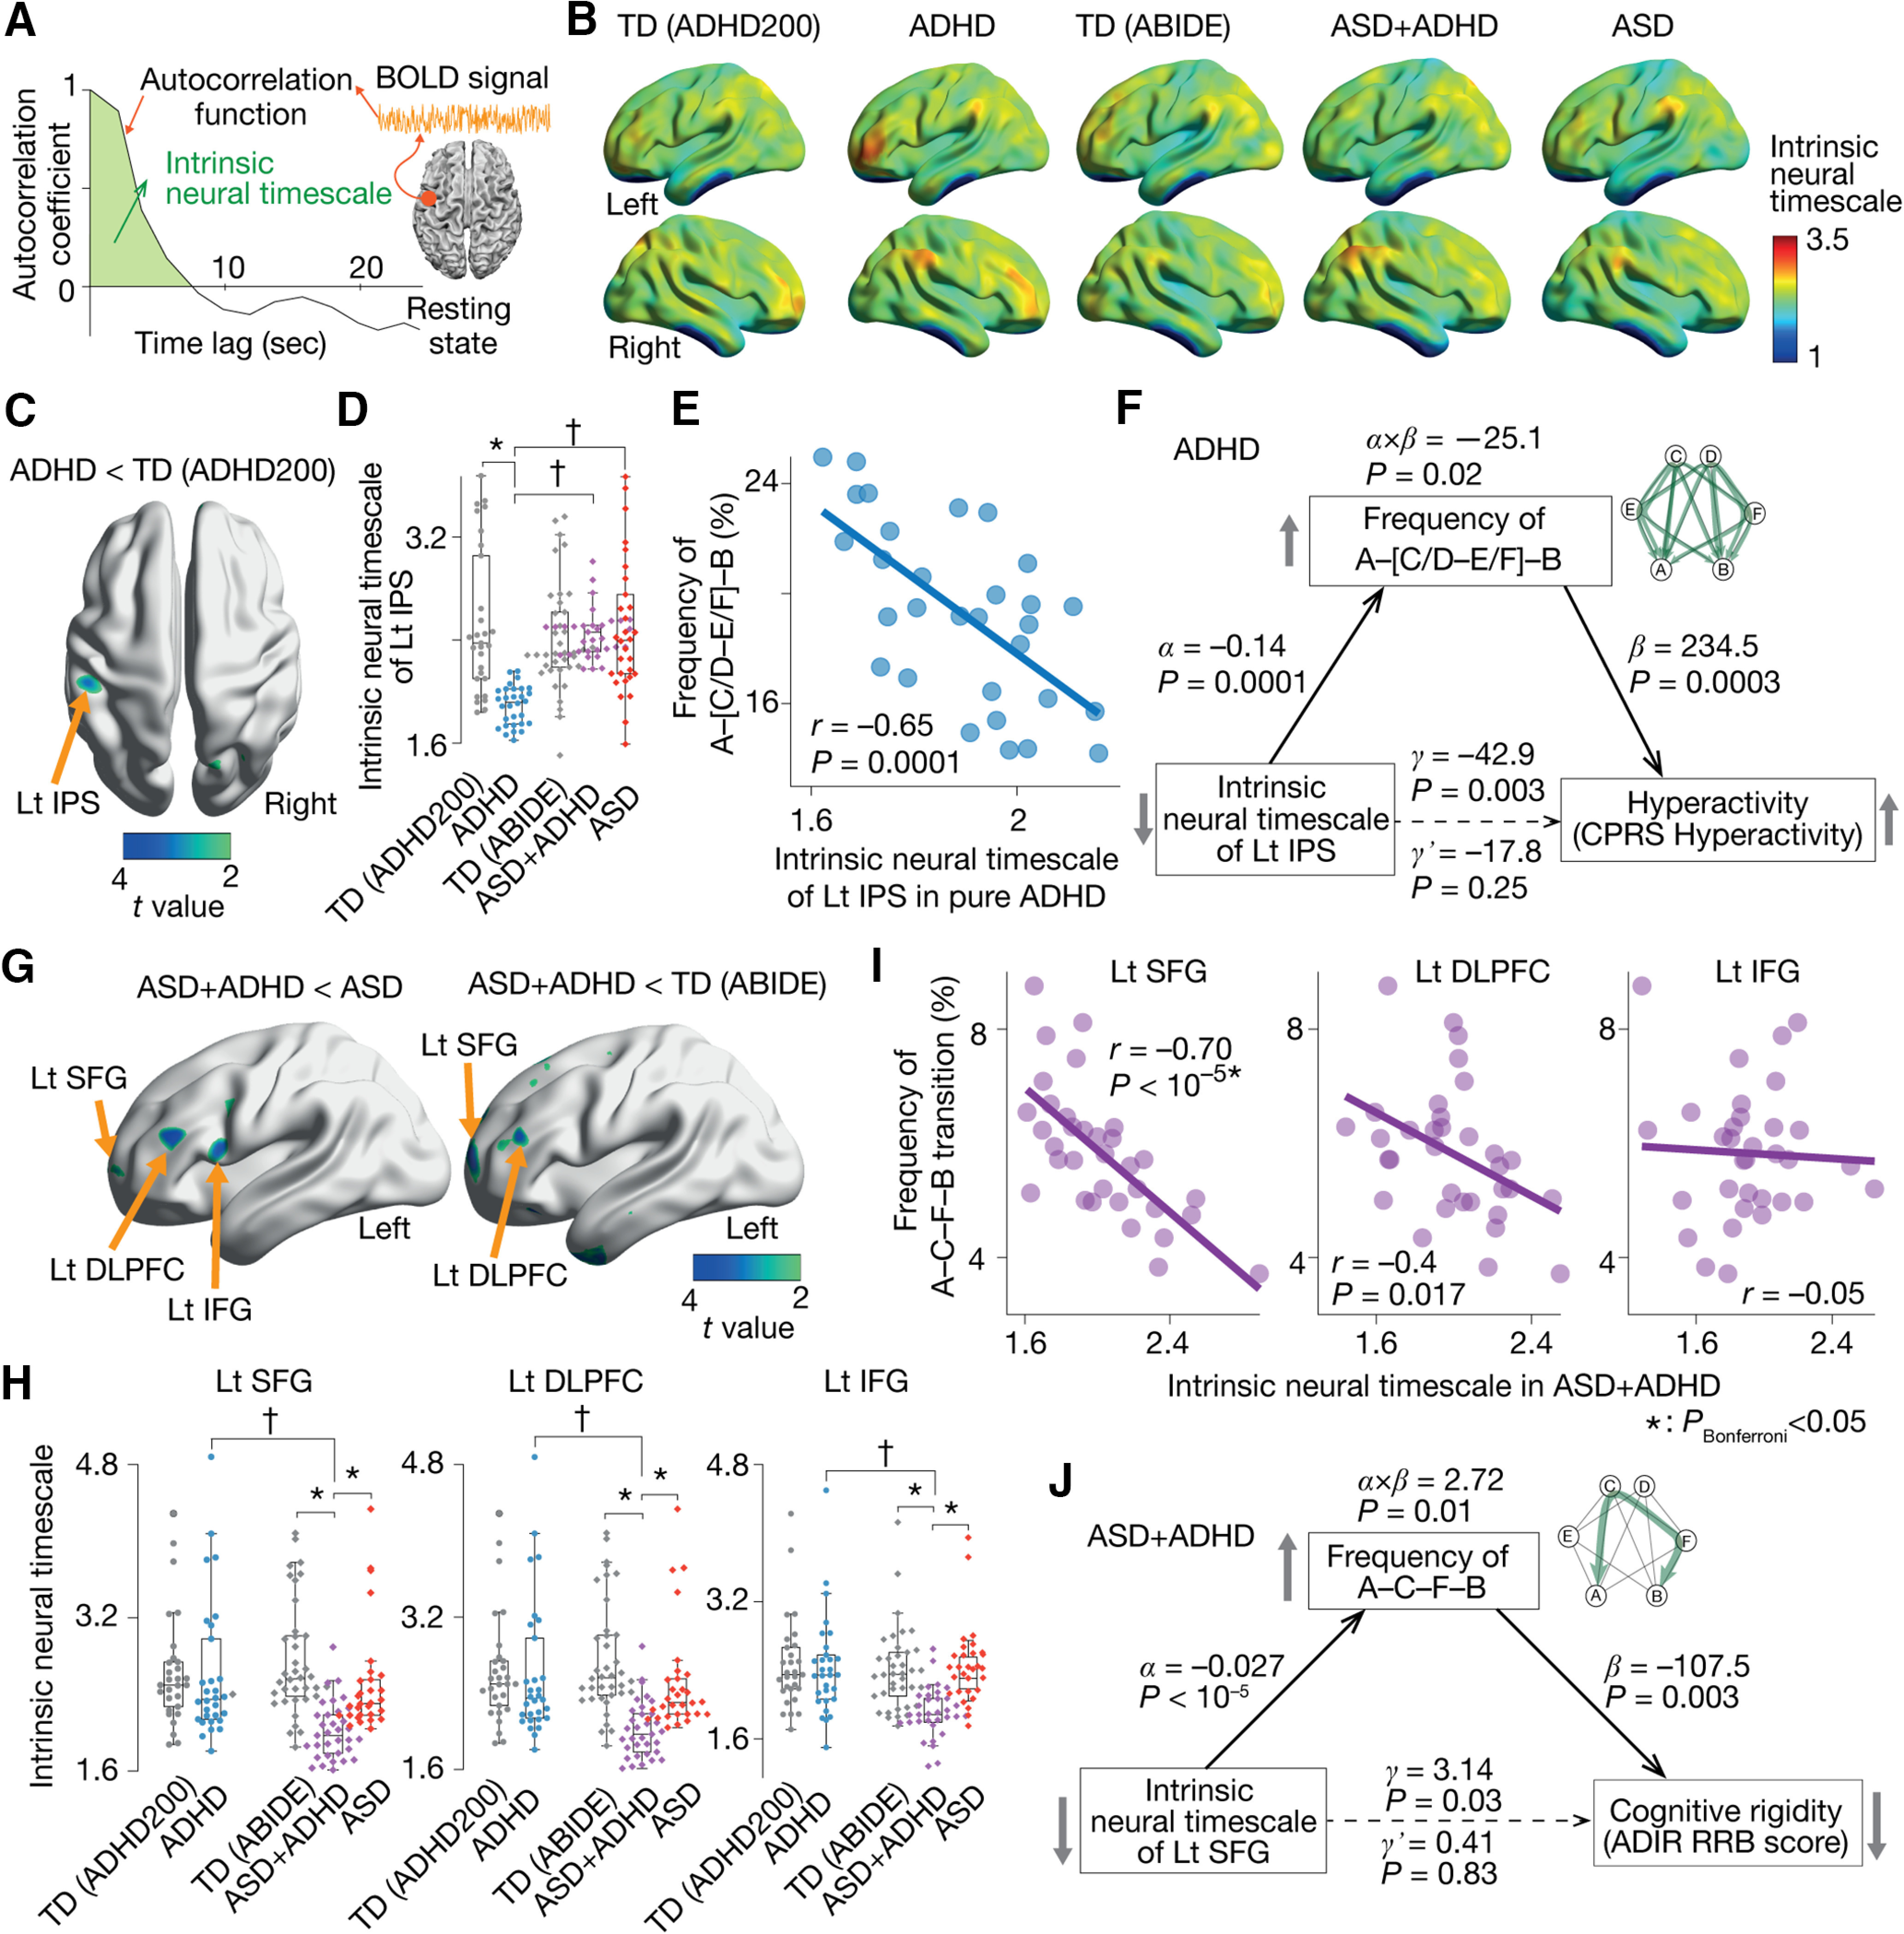
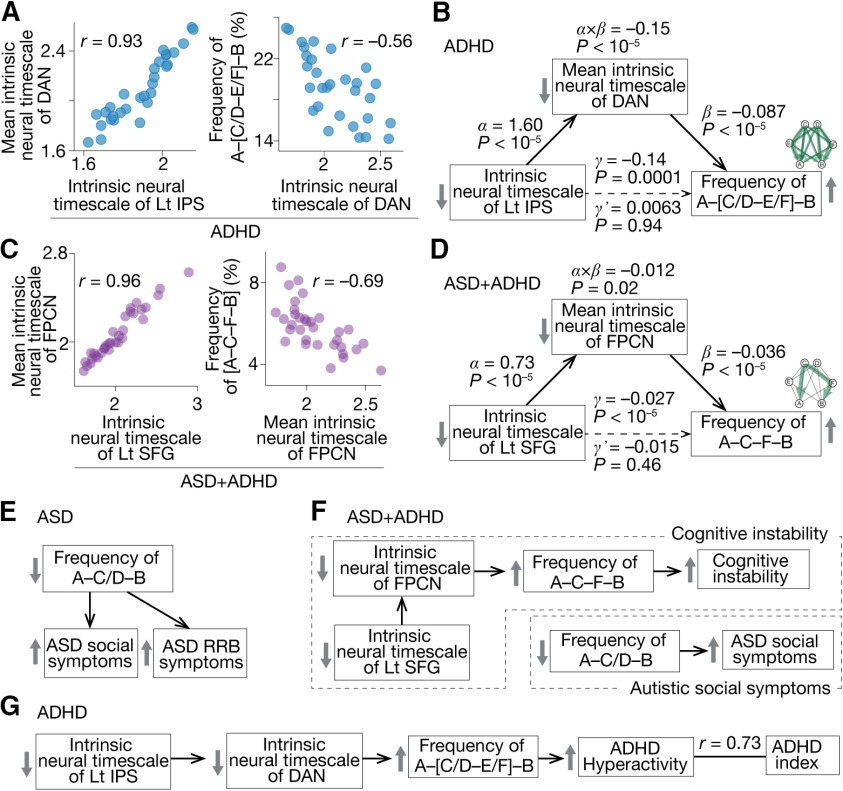
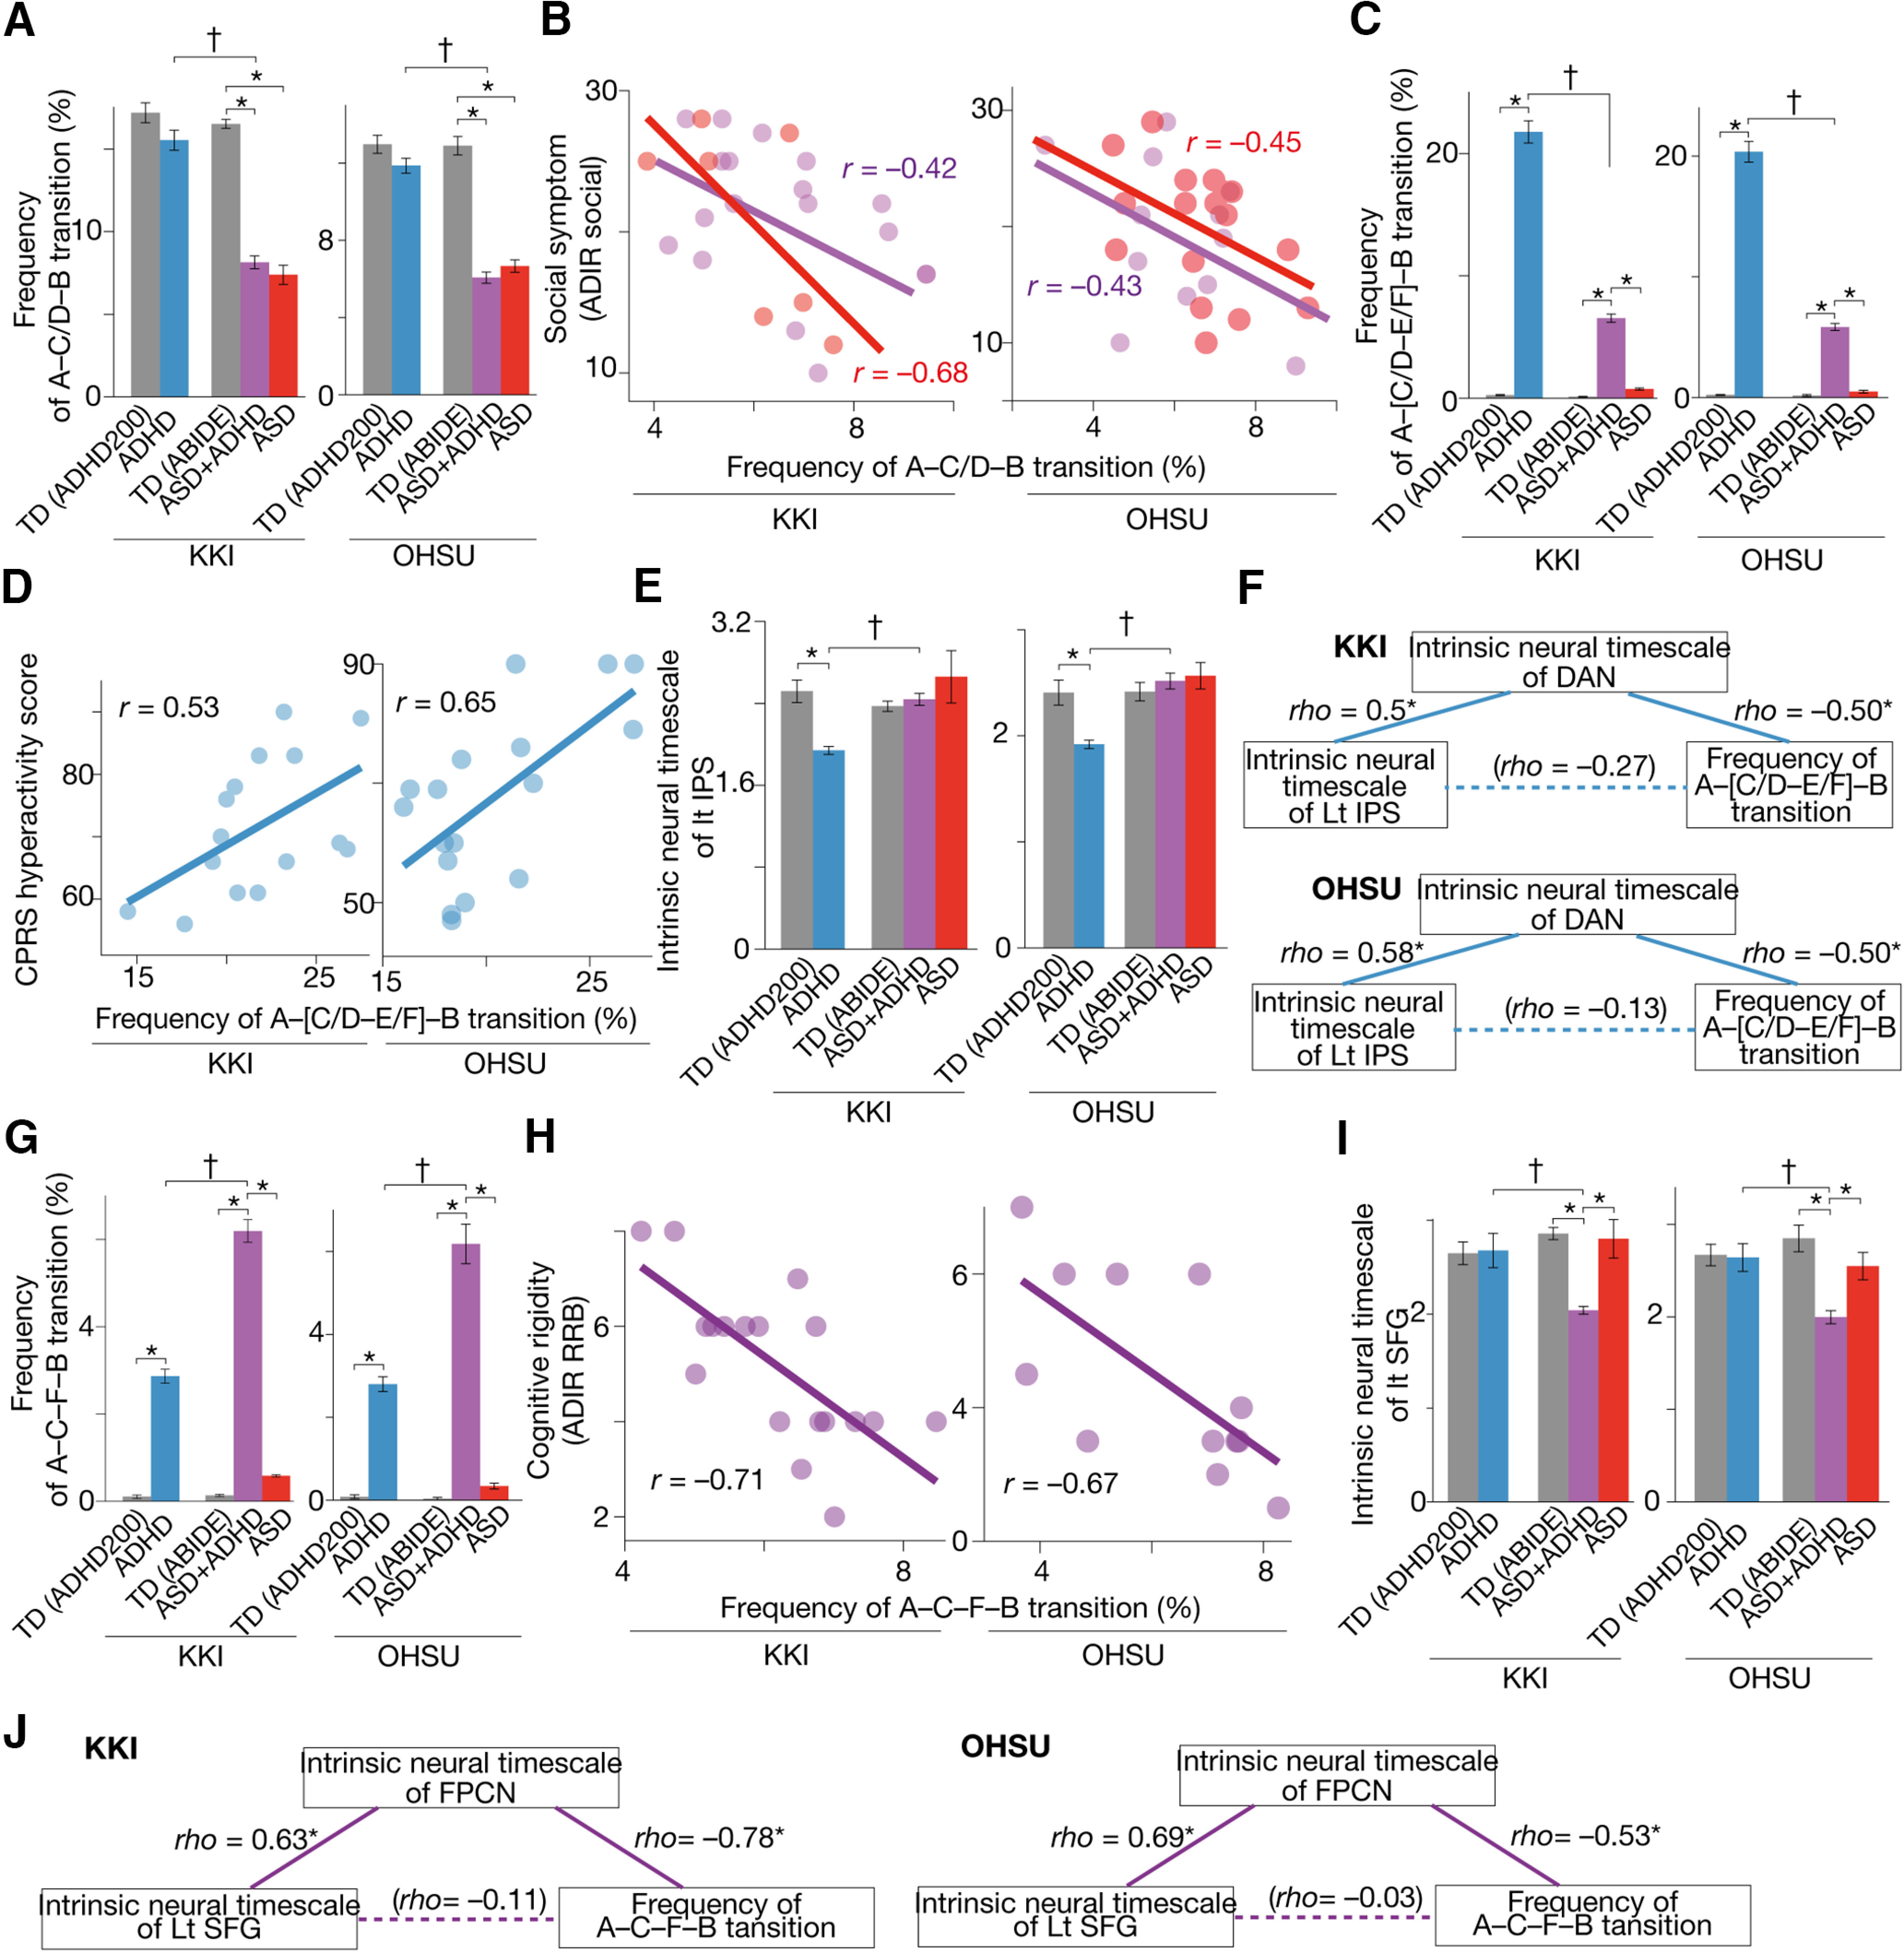
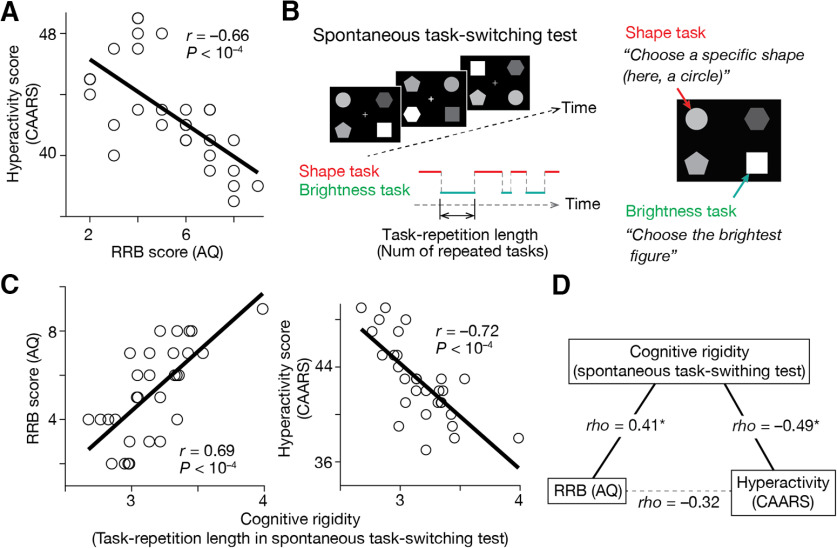
Previous diagnostic systems precluded the co-existence of autism spectrum disorder (ASD) and attention-deficit/hyperactivity disorder (ADHD) in one person; but, after many clinical reports, the diagnostic criteria were updated to allow their co-occurrence. Despite such a clinical change, the neurobiological bases underpinning the comorbidity remain poorly understood, and whether the ASD+ADHD condition is a simple overlap of the two disorders is unknown. Here, to answer this question, we compared the brain dynamics of high-functioning ASD+ADHD children with age-/sex-/IQ-matched pure ASD, pure ADHD, and typically developing (TD) children. Regarding autistic traits, the socio-communicational symptom of the ASD+ADHD children was explained by the same overstable brain dynamics as seen in pure ASD. In contrast, their ADHD-like traits were grounded on a unique neural mechanism that was unseen in pure ADHD: the core symptoms of pure ADHD were associated with the overly flexible whole-brain dynamics that were triggered by the unstable activity of the dorsal-attention network and the left parietal cortex; by contrast, the ADHD-like cognitive instability of the ASD+ADHD condition was correlated with the atypically frequent neural transition along a specific brain state pathway, which was induced by the atypically unstable activity of the frontoparietal control network and the left prefrontal cortex. These observations need to be validated in future studies using more direct and comprehensive behavioral indices, but the current findings suggest that the ASD+ADHD comorbidity is not a mere overlap of the two disorders. Particularly, its ADHD-like traits could represent a unique condition that would need a specific diagnosis and bespoke treatments.

Keywords: ADHD; MRI; autism; comorbidity; energy landscape analysis; intrinsic neural timescale.


Figures

Figure 1.
Figure 1.
Six brain states determining global neural dynamics. A, We performed energy landscape analysis to examine the global neural dynamics. After parcellating the brain into seven functionally distinct networks, we fitted a pairwise maximum entropy model (MEM) to the network-wise rsfMRI signals and identified the structure of the energy landscape for each group. In the energy landscape, local minima represented the most stable brain activity patterns in their neighboring areas, and basins (attractors) indicate the sets of the brain activity patterns that can be summarized into the corresponding local minimum. B, The pairwise MEM was accurately fitted to the rsfMRI data in all the participant groups (>97.5%). C, The dendrograms, so-called disconnectivity graphs, show the structures of the energy landscapes. All the participant groups shared the same six local minima (local min af), whose activity patterns were displayed in the right panel. D, The six brain states (States A–F) corresponding to the six local minima were similar between the five participant groups (r >0.91). TD, typically developing. ADHD, attention-deficit/hyperactivity disorder. ASD, autism spectrum disorder. ASD+ADHD, a comorbid condition of ASD and ADHD. TD (ADHD200), TD data stored in the ADHD200 project. TD (ABIDE), TD data stored in ABIDE project.
Figure 2.
Figure 2.
Brain state dynamics. A, Transition frequency matrix. A cell (i, j) represents the frequency of the transition from brain state i to j, which was calculated by a random-walk simulation. B, The graphs show the transition frequency (thickness of the lines) and duration (radius of the circle). C–E, Three brain state transitions whose frequencies appeared to be specific to ASD/ADHD symptoms: panel C indicates the ASD symptom-specific reduction in the A–C/D–B transition frequency; panel D represents ADHD-specific enhancement of the A–[C/D–E/F]–B transition; panel E shows the ASD+ADHD comorbidity-specific increase in the A–C–F–B transition frequency. In every panel, the left bar graphs are based on the random-walk simulation, whereas the middle graphs are based on the empirical data. The right network schemata represent the patterns of the corresponding brain state transitions. *pBonferroni < 0.05 in a two-sample t test. p <0.05 for interaction in a two-way ANOVA.
Figure 3.
Figure 3.
Brain state dynamics and symptoms. Three brain-state transitions exhibited symptom-specific atypical frequencies. A, In both the pure ASD and ASD+ADHD groups, the severity of the autistic socio-communicational symptom (ADI-R social) was negatively correlated with the A–C/D–B transition frequency. B, This A–C/D–B transition frequency explained the cognitive rigidity (ADI-R RRB) of the pure ASD children but did not that of the ASD+ADHD individuals. C, Instead, the cognitive rigidity of the ASD+ADHD children was correlated with their atypically frequent A–C–F–B transition. D, The ADHD symptom in the pure ADHD children was not explained by this A–C–F–B transition frequency but by the A–[C/D–E/F]–B transition frequency. E, In particular, the atypical increase in the A–[C/D–E/F]–B transition frequency was specifically correlated with the hyperactivity tendency in the pure ADHD group. pBonferroni < 0.05.
Figure 4.
Figure 4.
Local neural dynamics and global brain state dynamics. A, To identify brain areas that induced atypical brain state dynamics in the pure ADHD and ASD+ADHD children, we examined the intrinsic neural timescales for all the brain regions. The neural timescale was defined as the area under the curve of the autocorrelation function. Brain areas with shorter neural timescales are thought to be sensitive to neural inputs and likely to exhibit an unstable and fluctuating neural signal. B, For each of the participant groups, we obtained an average whole-brain map of the intrinsic neural timescale. C, D, In the pure ADHD children, only the left inferior parietal sulcus (IPS) showed a significantly shorter neural timescale compared with the TD individuals (pFDR < 0.05; C). The neural timescale of the brain area was also shorter than that of the pure ASD and ASD+ADHD groups (D). E, This atypically shorter neural timescale in the left IPS in the pure ADHD children was correlated with their atypically frequent A–[C/D–E/F]–B transition. F, A mediation analysis demonstrated that, in the pure ADHD individuals, their atypically shorter intrinsic neural timescale in the left IPS induced their frequent transition along the A–[C/D–E/F]–B pathway, which resulted in their hyperactive behavior. G, H, In the ASD+ADHD children, the neural timescales in the left superior frontal gyrus (SFG), dorsolateral prefrontal cortex (DLPFC), and inferior frontal gyrus (IFG) were significantly shorter than those of the pure ASD group (pFDR < 0.05; G), those of the pure ADHD children and those of the corresponding TD individuals (H). I, Among the three regions, only the neural timescale of the left SFG showed a significant correlation with the atypical A–C–F–B transition frequency in the ASD+ADHD children. J, A mediation analysis indicated that the short neural timescale of the left SFG induced the frequent A–C–F–B transition, which reduced the cognitive rigidity in the ASD+ADHD individuals. The significantly large values of the α, β, and γ validate our application of the mediation analysis to the current datasets. The statistical significance of the α×β (indirect effect) and the insignificance of the γ’ support our conclusions. pBonferroni < 0.05 in a two-way ANOVA. *pBonferroni < 0.05 in a two-sample t test.
Figure 5.
Figure 5.
Focal neural activity, brain network activity and whole-brain dynamics. We investigated the mechanisms by which local neural activity affected the whole-brain neural dynamics. A, In the pure ADHD group, the neural timescale of the left inferior parietal sulcus (IPS) was correlated with that of the dorsal attention network (DAN), the parent network of the IPS, which was associated with the frequency of the A–[C/D–E/F]–B transition. B, A mediation analysis showed that the short neural timescale of the left IPS increased the frequency of the A–C–F–B transition by reducing the neural timescale of the DAN. C, In the ASD+ADHD children, the intrinsic neural timescale of the left superior frontal gyrus (SFG) was correlated with that of the frontoparietal control network (FPCN), the parental network of the SFG, which was related to the A–C–F–B transition frequency. D, A mediation analysis demonstrated that the shorter neural timescale of the left SFG enhanced the A–C–F–B transition frequency by decreasing the neural timescale of the FPCN. E, The autistic behavior in the pure ASD children was explained by the atypical reduction in the A–C/D–B transition frequency. F, In the ASD+ADHD children, their ASD symptom was correlated with the atypical decrease in the A–C/D–B transition frequency. Their ADHD-like cognitive instability was induced by the atypically frequent A–C–F–B transition, which was triggered by the unstable activities of FPCN and left SFG. G, The hyperactivity of the pure ADHD children was underpinned by the atypically frequent A–[C/D–E/F]–B transition, which was attributable to the fluctuating activity of the FPCN and left IPS.
Figure 6.
Figure 6.
Confirmatory tests. We confirmed that the main findings were qualitatively preserved in two independent datasets: data collected at Kennedy Krieger Institute (KKI) and those recorded at Oregon Health and Science University (OHSU). The pure ASD and ASD+ADHD children had significantly infrequent transitions along the A–C/D–B pathway (A), which were correlated with their autistic socio-communicational symptoms (B). The frequency of the A–[C/D–E/F]–B transition was atypically higher in the pure ADHD children (C) and associated with their hyperactivity tendency (D). The intrinsic neural timescale of the left IPS in the pure ADHD children was atypically shorter than controls (E) and correlated with the atypically frequent A–[C/D–E/F]–B transition via the unstable activity of the DAN (F). The A–C–F–B transition frequency in the ASD+ADHD children was atypically frequent (G) and correlated with their cognitive instability (H). This atypical A–C–F–B transition frequency was correlated with the atypically shorter neural timescale of the left SFG (I) via the fluctuating neural activity of the FPCN (J). *pBonferroni < 0.05, p <0.05 for interaction in a two-way ANOVA. The error bars represent the SDs.
Figure 7.
Figure 7.
Additional behavioral experiment. The current study assumed that the ADHD-like traits in autistic individuals are related to cognitive overflexibility and inversely correlated with their RRB score. We indirectly examined this assumption with a behavioral experiment employing 30 TD adults. A, We first confirmed a significant negative correlation between their ADHD-like hyperactivity, which was measured by CAARS, and their ASD-like RRB trait, which was calculated as a summation of “Attention switching” and “Attention to details” scores in AQ. B, Second, we quantified the cognitive rigidity, an inverse form of cognitive flexibility, using a spontaneous task-switching test. This test allows us to quantify cognitive rigidity by counting how many same tasks the participants repeated spontaneously. C, The cognitive rigidity was associated with the RRB score in AQ and inversely correlated with the hyperactivity score measured by CAARS. D, A partial correlation analysis indicates that both the RRB score in AQ and hyperactivity score in CAARS would be behavioral manifestations of cognitive rigidity. *pBonferroni < 0.05.

Similar articles

Cited by

References

    1. ADHD-200 Consortium (2012) The ADHD-200 Consortium: a model to advance the translational potential of neuroimaging in clinical neuroscience. Frontiers Syst Neurosci 6:62. - PMC - PubMed
    1. Aoki Y, Yoncheva YN, Chen B, Nath T, Sharp D, Lazar M, Velasco P, Milham MP, Martino AD (2017) Association of white matter structure with autism spectrum disorder and attention-deficit/hyperactivity disorder. JAMA Psychiatry 4:1120–1128. 10.1001/jamapsychiatry.2017.2573 - DOI - PMC - PubMed
    1. American Psychiatric Association (2022) Diagnostic and statistical manual of mental disorders, DSM-5-TR. Washington, DC: Amer Psychiatric Pub Inc.
    1. Arrington CM, Logan GD (2004) The cost of a voluntary task switch. Psychol Sci 15:610–615. 10.1111/j.0956-7976.2004.00728.x - DOI - PubMed
    1. Baldassano C, Chen J, Zadbood A, Pillow JW, Hasson U, Norman KA (2017) Discovering event structure in continuous narrative perception and memory. Neuron 95:709–721.e5. 10.1016/j.neuron.2017.06.041 - DOI - PMC - PubMed

MeSH terms