. 2023 Jul 13;10(7):ENEURO.0404-22.2023.
doi: 10.1523/ENEURO.0404-22.2023. Print 2023 Jul.

Differential Modulation of GABAergic and Glutamatergic Neurons in the Ventral Pallidum by GABA and Neuropeptides

Affiliations

Differential Modulation of GABAergic and Glutamatergic Neurons in the Ventral Pallidum by GABA and Neuropeptides

Daniela Neuhofer et al. eNeuro. .

Abstract

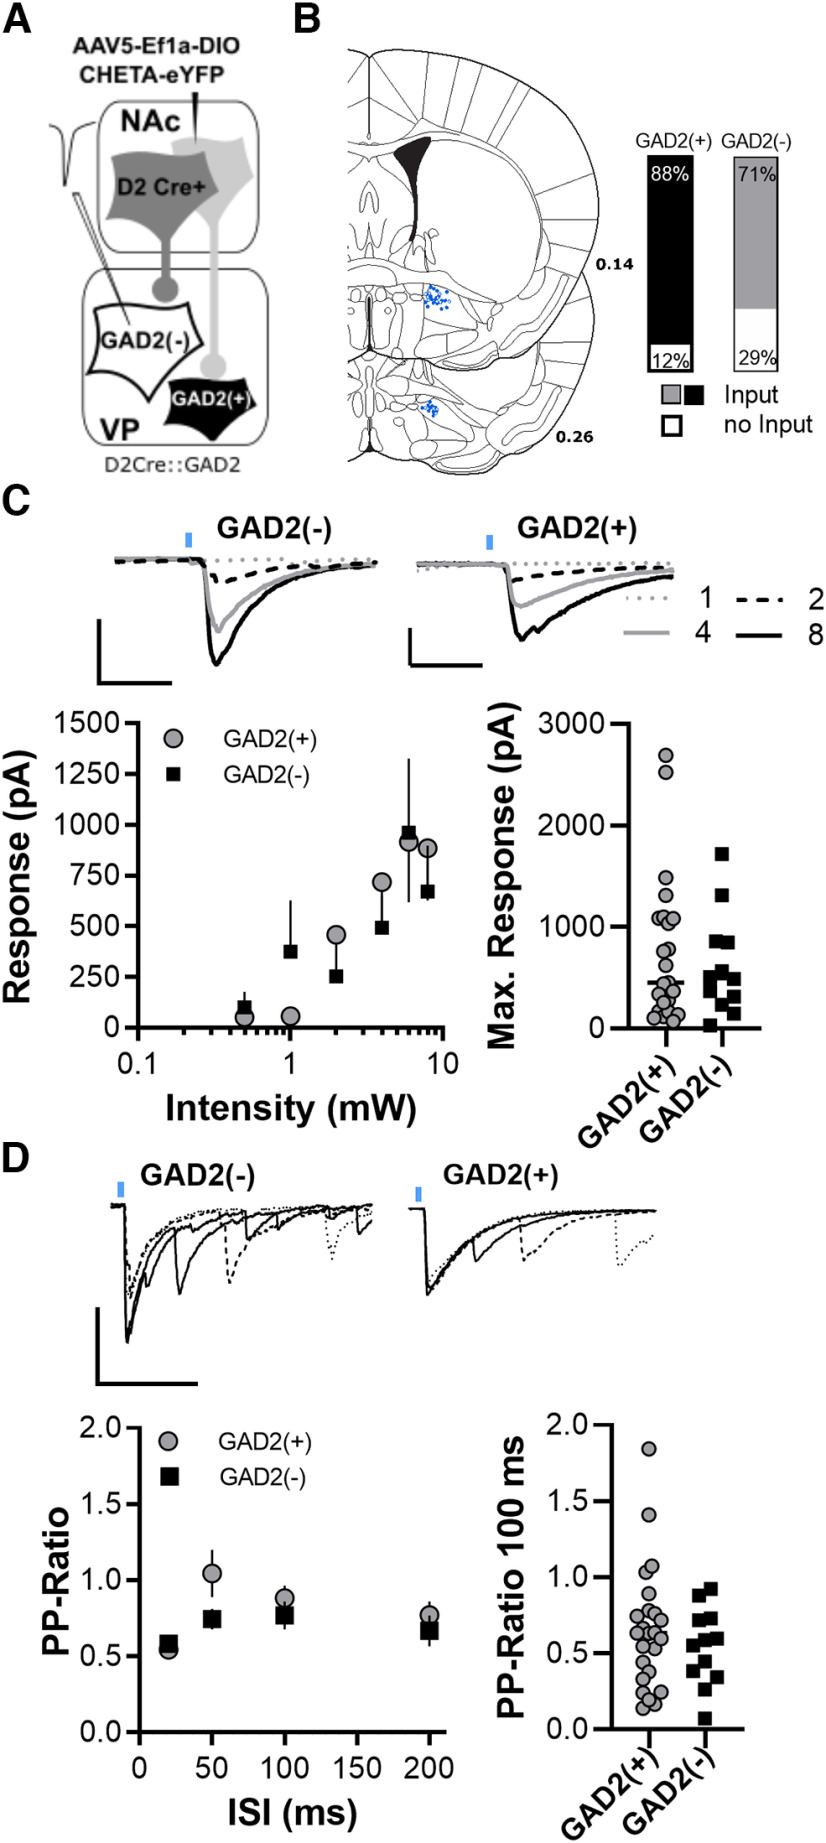
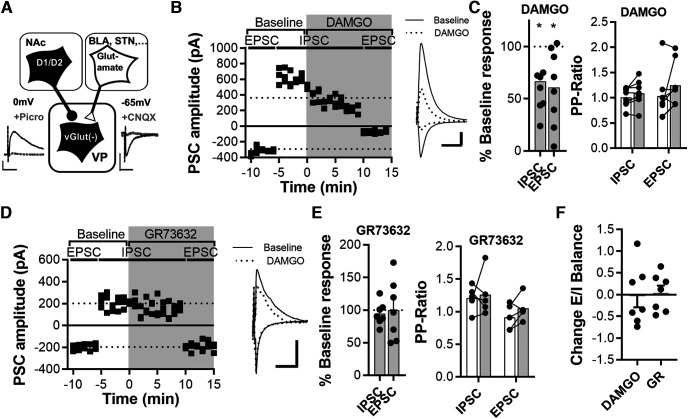
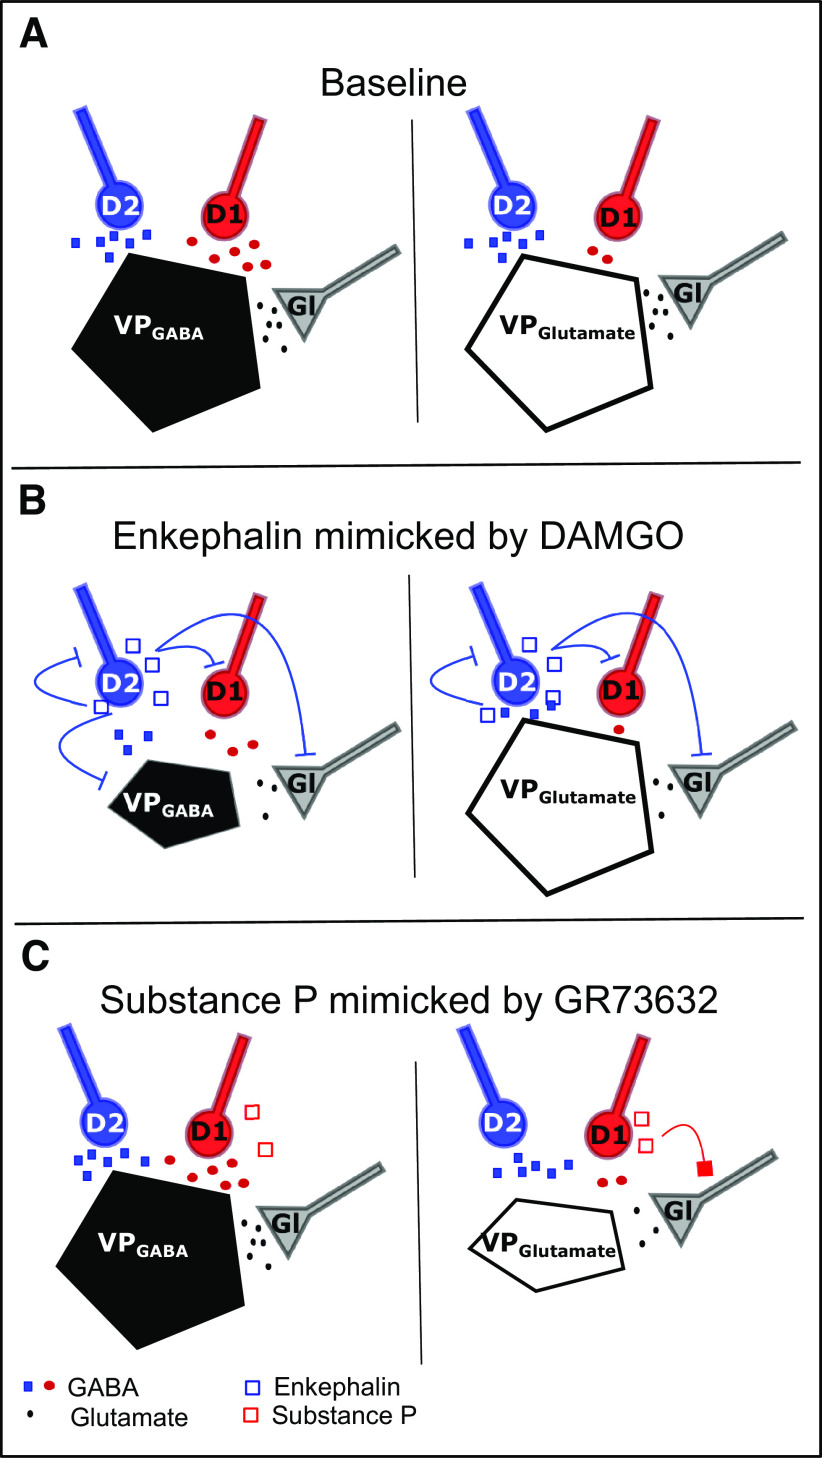
The ventral pallidum (VP) is an integral locus in the reward circuitry and a major target of GABAergic innervation of both D1-medium spiny neurons (MSNs) and D2-MSNs from the nucleus accumbens. The VP contains populations of GABAergic [VPGABA, GAD2(+), or VGluT(-)] and glutamatergic [VPGlutamate, GAD2(-), or VGluT(+)] cells that facilitate positive reinforcement and behavioral avoidance, respectively. MSN efferents to the VP exert opponent control over behavioral reinforcement with activation of D1-MSN afferents promoting and D2-MSN afferents inhibiting reward seeking. How this afferent-specific and cell type-specific control of reward seeking is integrated remains largely unknown. In addition to GABA, D1-MSNs corelease substance P to stimulate neurokinin 1 receptors (NK1Rs) and D2-MSNs corelease enkephalin to activate μ-opioid receptors (MORs) and δ-opioid receptors. These neuropeptides act in the VP to alter appetitive behavior and reward seeking. Using a combination of optogenetics and patch-clamp electrophysiology in mice, we found that GAD2(-) cells receive weaker GABA input from D1-MSN, but GAD2(+) cells receive comparable GABAergic input from both afferent types. Pharmacological activation of MORs induced an equally strong presynaptic inhibition of GABA and glutamate transmission on both cell types. Interestingly, MOR activation hyperpolarized VPGABA but not VGluT(+). NK1R activation inhibited glutamatergic transmission only on VGluT(+) cells. Our results indicate that the afferent-specific release of GABA and neuropeptides from D1-MSNs and D2-MSNs can differentially influence VP neuronal subtypes.

Keywords: GABA; medium spiny neurons; neuropeptides; optogenetics; ventral pallidumg; whole cell patch clamp.


Figures

Figure 1.
Figure 1.
D1-MSN GABAAR-mediated transmission on GAD2(+) and GAD2(–) cells. A, Illustration of the genetic circuit dissection. AAV5-EF1a-DIO-ChETA-EYFP was injected into the core of D1-Cre::GAD2 mice, which allowed selective optogenetic activation of D1-MSN terminals and recording of two distinct cell types [GAD2(+) and GAD2(–)] in the VP. B, Left, Spatial distribution of recorded GAD2(+) cells (open symbols) and GAD2(–) cells (closed symbols) within D1-Cre::GAD2 mice. Connectivity plot on the left shows a significant higher percentage of GAD2(+) cells received D1-MSNs input. D1, 25 cells from 7 mice; D2, 23 cells from 9 mice. C, Inset, Representative current traces of two GAD2(+) and GAD2(–) cells in response to increasing D1-D2-MSN stimulation. left: Input–output curves showing the relationship between laser stimulation intensity (in mW) and postsynaptic response amplitude. The response of GAD2(+) to stimulation of D1-MSN terminals was significantly stronger than the response of GAD2(–) cells. GAD2(+), 13 cells from 7 mice; GAD2(–), 12 cells from 9 mice. Right, Scatter plot showing the maximum response of GAD2(+) and GAD2(–) to D1-MSNs afferent stimulation. D, Inset, Representative traces of GAD2(+) and GAD2(–) cells in response to ISI series. Left, Median paired-pulse ratio of evoked oIPSCs at different ISIs show higher paired-pulse ratios of GAD2(–) cells in response to D1-MSN terminal stimulation. GAD2(+), 11 cells from 6 mice; GAD2(–), 10 cells from 6 mice. Right, Scatter plot illustrating that paired-pulse ratios of GAD2(–) in response to a 100 ms ISI was significantly higher than GAD2(–) response. *p < 0.05; **p < 0.01. For representative viral expression and spread in the nucleus accumbens, see Extended Data Figure 1-1 (Extended Data Table 1-1, normality tests for all datasets).
Figure 2.
Figure 2.
D2-MSN GABAAR-mediated transmission on GAD2(+) and GAD2(–) cells. A, Illustration of the genetic circuit dissection. AAV5-EF1a-DIO-ChETA-EYFP was injected into the core of D2-Cre::GAD2 mice, which allowed selective optogenetic activation D2-MSN terminals in the VP. Responses of GAD2(+) cells (open symbols) and GAD2(–) cells (closed symbols) recorded under the anterior commissure. B, Left, Spatial distribution of recorded GAD2(+) cells (open symbols) and GAD2(–) cells (closed symbols) within D2-Cre::GAD2 mice. Connectivity plot on the left shows that a significantly higher percentage of GAD2(+) cells received D2-MSNs input. GAD2(+), 27 cells from 7 mice; GAD2(–), 22 cells from 5 mice. C, Inset, Representative current traces of a GAD2(+) and a GAD2(–) cell in response to increasing D2-MSN stimulation. Left, Input–output curves showing the relationship between laser stimulation intensity (in mW) and postsynaptic response amplitude. The response to stimulation of D2-MSN terminals was similar. GAD2(+), 25 cells from 11 mice; GAD2(–), 24 cells from 8 mice. Right, Scatter plot showing similar maximum response of the two recorded cell populations. D, Inset, Representative traces of GAD2(+) and GAD2(–) cells in response to ISI series. Left, Median paired-pulse ratio of evoked oIPSCs at different ISIs showed higher paired-pulse ratios in response to D2-MSN terminal stimulation. GAD2(+), 15 cells from 8 mice; GAD2(–), 20 cells from 8 mice. Right, Scatter plot illustrating that paired-pulse ratios in response to 100 ms ISIs were significantly higher in response to D2-MSN terminal stimulations. *p < 0.05; **p < 0.01.
Figure 3.
Figure 3.
MOR and NK1R activation differentially modulate glutamate and GABAAR-mediated transmission onto VPGlutamate cells. A, Schematic of the experimental protocol. VGluT2-IRES-Cre mice were crossed with Ai14 mice. Ai14 mice express robust tdTomato fluorescence in VPGlutamate cells following Cre-mediated recombination. VPGlutamate cells were recorded, and synaptic afferents were stimulated electrically. EPSCs and IPSCs were isolated biophysically by clamping the cells at –65 and 0 mV, respectively. eEPSCs and eIPSCs are were regularly blocked by DNQX and PTX, respectively (see example traces). For control experiments without agonists, see Extended Data Figure 3-1. B, Example of serial recordings of EPSCs and IPSCs in a representative VPGlutamate cell. Both, EPSCs measured at −65 mV and IPSCs at 0 mV were decreased by the application MOR agonist DAMGO. C, DAMGO inhibited elicited EPSCs and IPSCs (left) and significantly increased the paired-pulse ratio of EPSCs (right; pairwise comparison between preapplication and postapplication; 6 cells, 5 animals). D, Example of serial recordings of EPSCs and IPSCs in a representative VPGlutamate cell. EPSCs measured at −65 mV but not IPSCs at 0 mV were decreased by application of NK1R agonist GR73632. E, GR73632 application selectively inhibited elicited EPSCs but not IPSCs (left) and selectively increased the paired-pulse ratio of elicited EPSC (right; 9 cells, 5 animals). F, Change in E/I ratio after DAMGO or GR73632 indicates a divergent modulation of inputs onto VPGlutamate cells. *p < 0.05; **p < 0.01.
Figure 4.
Figure 4.
MOR activation but not NK1R activation inhibits both GABAAR and glutamate transmission onto VPGABA cells. A, Schematic of the experimental protocol. VGluT2-IRES-Cre mice were crossed with Ai14 mice for robust tdTomato fluorescence in VPGlut(–) cells. VPGlut(–) cells (presumably VPGABA) were recorded, and synaptic afferents were stimulated electrically. EPSCs and IPSC were isolated biophysically by clamping the cells at –65 and 0 mV, respectively. EPSCs and IPSCs were regularly blocked by DNQX and PTX, respectively (see example traces). B, Representative example of serial recordings of EPSCs and IPSCs in a representative VPGlut(–) cell. Both EPSCs measured at −65 mV and IPSCs measured at 0 mV were decreased by DAMGO. C, DAMGO application inhibited both EPSCs and IPSCs (left) without significantly changing the paired-pulse ratio (right; 8 cells 6 animals). D, Representative example of serial recordings of EPSCs and IPSCs in a representative VPGlut(–) cell. Neither EPSCs measured at −65 mV nor IPSCs measured at 0 mV were modulated by the NK1R agonist GR73632. E, GR73632 application did not affect IPSC or EPSC amplitude (left) or paired-pulse ratios before and after drug application (right; 7 cells 4 animals). F, No significant change in E/I ratio after DAMGO.
Figure 5.
Figure 5.
MOR and NK1R agonists do not modulate the excitability of VGluT2(+) cells. A, Representative voltage traces of a VGluT2(+) cell in response to a 50 pA current ramp before and after DAMGO application. B, Representative voltage traces of a firing VGluT2(+) cell before and after GR73632 application. C, Time course of change in RMP before, during, and after drug application. D, Pre-post paired comparisons of RMPs illustrate that neither MOR (DAMGO) nor NK1 (GR73632) activation significantly modulated the RMP of VGluT2(+) cells. DAMGO, 8 cells from 5 mice; GR73632, 6 cells from 4 mice. E, Time course of change in firing rate during ramp-like depolarization before, during, and after drug application. F, Pre-post paired comparisons illustrate that neither MOR (DAMGO) nor NK1 (GR73632) activation significantly modulated the elicited firing of VGluT2(+) cells. For input resistance before and after agonist application, see Extended Data Figure 5-1.
Figure 6.
Figure 6.
MOR but not NK1R activation hyperpolarizes VPGABA cells. A, Representative voltage traces of a VPGlut(–) cell in response to a 50 pA current ramp before and after the DAMGO application illustrates the inhibition of firing. B, Representative voltage traces of a firing VPGlut(–) cell before and after GR73632 application show no change. C, Time course of change in RMP before, during, and after drug application. D, DAMGO but not GR73632 significantly hyperpolarized the RMP of VPGlut(–) cells. DAMGO, 9 cells from 5 mice; GR73632, 10 cells from 6 mice. E, Time course of change in firing rate before during ramp-like depolarization, before and after drug application. F, DAMGO but not GR73632 significantly decreased the elicited firing of VPGlut(–) cells. *p < 0.05.
Figure 7.
Figure 7.
GABA and neuropeptides can fine-tune information flow in the VP in a cell-type, transmitter-specific manner. A, Under baseline conditions, VPGABA cells receive D1-MSN and D2-MSN GABAAR input of similar strength. VPGlutamate cells receive significantly lower GABAAR-mediated transmission from D1-MSN terminals. B, The activation of MOR inhibits both GABA and glutamate transmission onto VPGABA to a similar extent. Additionally, MOR activation hyperpolarizes VPGABA cells. MOR activation only inhibited neurotransmission onto VPGlutamate cells; it had no postsynaptic effect. C, NK1R activation modulated neither the neurotransmission nor the excitability of VPGABA cells. NK1R activation inhibits EPSCs onto VPGlutamate cells.

Similar articles

References

    1. Bengtson CP, Osborne PB (2000) Electrophysiological properties of cholinergic and noncholinergic neurons in the ventral pallidal region of the nucleus basalis in rat brain slices. J Neurophysiol 83:2649–2660. 10.1152/jn.2000.83.5.2649 - DOI - PubMed
    1. Cifuentes F, Morales MA (2021) Functional implications of neurotransmitter segregation. Front Neural Circuits 15:738516. 10.3389/fncir.2021.738516 - DOI - PMC - PubMed
    1. Creed M, Ntamati NR, Chandra R, Lobo MK, Lüscher C (2016) Convergence of reinforcing and anhedonic cocaine effects in the ventral pallidum. Neuron 92:214–226. 10.1016/j.neuron.2016.09.001 - DOI - PMC - PubMed
    1. Faget L, Zell V, Souter E, McPherson A, Ressler R, Gutierrez-Reed N, Yoo JH, Dulcis D, Hnasko TS (2018) Opponent control of behavioral reinforcement by inhibitory and excitatory projections from the ventral pallidum. Nat Commun 9:849. 10.1038/s41467-018-03125-y - DOI - PMC - PubMed
    1. Francis TC, Yano H, Demarest TG, Shen H, Bonci A (2019) High-frequency activation of nucleus accumbens D1-MSNs drives excitatory potentiation on D2-MSNs. Neuron 103:432–444.e3. 10.1016/j.neuron.2019.05.031 - DOI - PMC - PubMed