. 2023 Aug 29;101(9):e940-e952.
doi: 10.1212/WNL.0000000000207537. Epub 2023 Jul 6.

Neurophysiology State Dynamics Underlying Acute Neurologic Recovery After Cardiac Arrest

Affiliations

Neurophysiology State Dynamics Underlying Acute Neurologic Recovery After Cardiac Arrest

Edilberto Amorim et al. Neurology. .

Erratum in

  • Correction to Author Disclosures.
    [No authors listed] [No authors listed] Neurology. 2024 Dec 24;103(12):e210123. doi: 10.1212/WNL.0000000000210123. Epub 2024 Nov 21. Neurology. 2024. PMID: 39571126 Free PMC article. No abstract available.

Abstract

Background and objectives: Epileptiform activity and burst suppression are neurophysiology signatures reflective of severe brain injury after cardiac arrest. We aimed to delineate the evolution of coma neurophysiology feature ensembles associated with recovery from coma after cardiac arrest.

Methods: Adults in acute coma after cardiac arrest were included in a retrospective database involving 7 hospitals. The combination of 3 quantitative EEG features (burst suppression ratio [BSup], spike frequency [SpF], and Shannon entropy [En]) was used to define 5 distinct neurophysiology states: epileptiform high entropy (EHE: SpF ≥4 per minute and En ≥5); epileptiform low entropy (ELE: SpF ≥4 per minute and <5 En); nonepileptiform high entropy (NEHE: SpF <4 per minute and ≥5 En); nonepileptiform low entropy (NELE: SpF <4 per minute and <5 En), and burst suppression (BSup ≥50% and SpF <4 per minute). State transitions were measured at consecutive 6-hour blocks between 6 and 84 hours after return of spontaneous circulation. Good neurologic outcome was defined as best cerebral performance category 1-2 at 3-6 months.

Results: One thousand thirty-eight individuals were included (50,224 hours of EEG), and 373 (36%) had good outcome. Individuals with EHE state had a 29% rate of good outcome, while those with ELE had 11%. Transitions out of an EHE or BSup state to an NEHE state were associated with good outcome (45% and 20%, respectively). No individuals with ELE state lasting >15 hours had good recovery.

Discussion: Transition to high entropy states is associated with an increased likelihood of good outcome despite preceding epileptiform or burst suppression states. High entropy may reflect mechanisms of resilience to hypoxic-ischemic brain injury.


Conflict of interest statement

E. Amorim, W.-L. Zheng, J. Jing, M.M. Ghassemi, J.W. Lee, O. Wu, S.T. Herman, T. Pang, A. Sivaraju, N. Gaspard, L.J. Hirsch, B.J. Ruijter, M.C. Tjepkema-Cloostermans, and J Hofmeijer report no disclosures relevant to the manuscript. M.J.A.M. van Putten is founder of Clinical Science Systems. Clinical Science Systems did not contribute funding nor played any role in the study. M.B. Westover is a cofounder of Beacon Biosignals. Beacon Biosignals did not contribute funding nor played any role in the study. Go to Neurology.org/N for full disclosures.

Figures

Figure 1
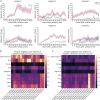
Figure 1. Longitudinal Neurophysiology Trends Postcardiac Arrest Stratified by Neurologic Outcome (CPC 1–2, CPC 3–4, and CPC 5)
(A–I) Hourly quantitative EEG features trends for 6–84 hours postcardiac arrest. (J–L) Average compressed spectral array displays summarized by outcome. ADR = alpha-delta ratio; BSR = burst suppression ratio; CPC = cerebral performance category; Sh entropy = Shannon entropy.
Figure 2
Figure 2. Probability of Good Neurologic Outcome (CPC 1-2) Based on Range of Quantitative EEG Feature Values (Mean Spike Frequency per Minute, Burst Suppression Ratio, and Entropy)
The mean normalized feature value for each bin (x-axis) represents the average mean feature value for each of the 3 features. The probability of good neurological outcome (CPC 1-2) is the proportion of subjects with CPC 1-2 among all cases within each bin. BSR = burst suppression ratio; Sh Entropy = Shannon entropy; CPC = cerebral performance category.
Figure 3
Figure 3. Neurophysiology Trends Postcardiac Arrest Variability per Hospital Stratified by Neurologic Outcome (CPC 1–2 and CPC 3–5)
(A) Mean spike frequency per minute. (B) Weighted mean difference for QEEG features per hospital pairs for the good neurologic outcome group (CPC 1–2). (C) Weighted mean difference for QEEG features per hospital pairs for poor neurologic outcome group (CPC 3–5). CPC = cerebral performance category; QEEG = quantitative EEG.
Figure 4
Figure 4. QEEG Features Clustering and Neurologic Function
In this visualization, each point represents a vector with all 9 QEEG feature combinations for each 6 hours epoch for an individual participant. The distance between points is determined based on the Euclidean distance between each of these feature vectors. The t-SNE map points is color coded based on the thresholded values for the 3 QEEG features used for neurophysiology state determination (i.e., SpF, BSup, and En); therefore, there are 8 labels for the corresponding 8 possible QEEG feature combinations. (A) t-SNE labeled based on spike frequency, burst suppression ratio, and entropy levels. (B) t-SNE labeled by neurologic function level (CPC 1–2, CPC 3–4, and CPC 5). (C) Examples of raw EEG patterns corresponding to QEEG patterns combinations shown in Figure 4A. BSup = burst suppression ratio; CPC = cerebral performance category; En = Shannon entropy; QEEG = quantitative EEG; SpF = spike frequency; t-SNE = t-distributed stochastic neighbor embedding.
Figure 5
Figure 5. Coma Neurophysiology State Trajectory
Representative examples demonstrating the evolution of raw EEG and compressed spectral density array in the first 72 hours postcardiac arrest and their corresponding neurophysiology state trajectory in the t-SNE map (5-point star indicated first state and 8-point star last state; arrows show trajectory). CPC 1: Patient with coma recovery with evolution from a suppressed and low amplitude background to delta-theta activity—initial state was burst suppression state evolving to alternation between nonepileptiform low and high entropy states. CPC 2: Patient with coma recovery with evolution from a delta background to theta-alpha activity with a brief period of superimposed epileptiform discharges—initial state was nonepileptiform low entropy, evolving to an epileptiform high entropy state briefly, and followed by primarily a low entropy nonepileptiform state. CPC 3: Patient with moderate neurologic disability with EEG evolving from suppressed to a burst suppressed background followed by alpha activity and periodic discharges superimposed on a continuous background—initial state at the high entropy state cluster located in between the burst suppression and epileptiform clusters evolving to an epileptiform state. CPC 5: Deceased patient with burst suppression with highly epileptiform bursts—initial state was burst suppression evolving to epileptiform low entropy. BSup = burst suppression ratio; CPC = cerebral performance category; En = Shannon entropy; QEEG = quantitative EEG; SpF = spike frequency; t-SNE = t-distributed stochastic neighbor embedding.
Figure 6
Figure 6. Neurophysiology States Longitudinal Evolution Postcardiac Arrest
(A) Swimmer plot with individual-level hourly neurophysiology state transitions ranked by CPC score (brackets separate individuals from best to worse score [CPC 1–5]). (B) Burden of neurophysiology states for good (CPC 1–2) and poor (CPC 3–5) neurologic outcome groups. For the good neurologic outcome group, the predominant states were NEHE (58% burden) and NELE (24%), with 10% of recording time in BSup and 8% in EHE or ELE states. In the poor neurologic outcome group, the predominant state was burst suppression (32%), followed by EHE or ELE (23%) and NELE (23%) or NELE (22%) states. (C) Chord diagram summarizing group-level c neurophysiology state transitions divided into 4 epochs ranging from 12 to 84 hours for good (CPC 1–2) and poor (CPC 3–5) outcome groups (6-hour block transitions). The outer circle in each diagram is equivalent to a donut chart, and their colors represent the final state, and the length of each donut component is the proportion of individuals ending on that state. The width of the chords projecting between states indicate the transition proportion between these 2 states; the chord color is set to the state with the largest net gain between initial and final states. Arches without chord projections between states represent neurophysiology state stationarity within that epoch. (D) Hourly good neurologic outcome probability by neurophysiology state. (E) Good neurologic outcome probability based on cumulative neurophysiology state burden. BSup = burst suppression ratio; CPC = cerebral performance category; EHE = epileptiform high entropy; ELE = epileptiform and low entropy; NEHE = nonepileptiform high entropy; NELE = nonepileptiform low entropy.

References

    1. Rundgren M, Westhall E, Cronberg T, Rosén I, Friberg H. Continuous amplitude-integrated electroencephalogram predicts outcome in hypothermia-treated cardiac arrest patients. Crit Care Med. 2010;38(9):1838-1844. doi: 10.1097/ccm.0b013e3181eaa1e7 - DOI - PubMed
    1. Dankiewicz J, Cronberg T, Lilja G, et al. Hypothermia versus normothermia after out-of-hospital cardiac arrest. N Engl J Med. 2021;384(24):2283-2294. doi: 10.1056/nejmoa2100591 - DOI - PubMed
    1. Schnakers C, Vanhaudenhuyse A, Giacino J, et al. Diagnostic accuracy of the vegetative and minimally conscious state: clinical consensus versus standardized neurobehavioral assessment. BMC Neurol. 2009;9(1):35. doi: 10.1186/1471-2377-9-35 - DOI - PMC - PubMed
    1. Irisawa T, Vadeboncoeur TF, Karamooz M, et al. Duration of coma in out-of-hospital cardiac arrest survivors treated with targeted temperature management. Ann Emerg Med. 2017;69(1):36-43. doi: 10.1016/j.annemergmed.2016.04.021 - DOI - PubMed
    1. Amorim E, Rittenberger JC, Zheng JJ, et al. Continuous EEG monitoring enhances multimodal outcome prediction in hypoxic-ischemic brain injury. Resuscitation. 2016;109:121-126. doi: 10.1016/j.resuscitation.2016.08.012 - DOI - PMC - PubMed

Publication types