. 2023 Jul 6;14(1):3990.
doi: 10.1038/s41467-023-39644-6.

Characterizing the evolution and phenotypic impact of ampliconic Y chromosome regions

Affiliations

Characterizing the evolution and phenotypic impact of ampliconic Y chromosome regions

Elise A Lucotte et al. Nat Commun. .

Abstract

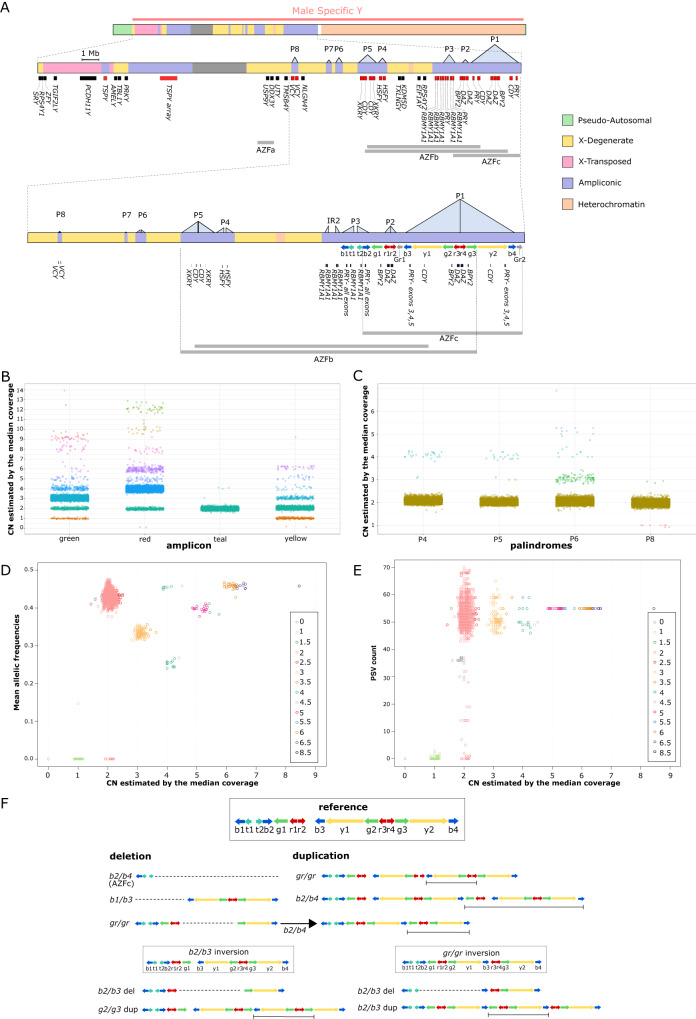
A major part of the human Y chromosome consists of palindromes with multiple copies of genes primarily expressed in testis, many of which have been claimed to affect male fertility. Here we examine copy number variation in these palindromes based on whole genome sequence data from 11,527 Icelandic men. Using a subset of 7947 men grouped into 1449 patrilineal genealogies, we infer 57 large scale de novo copy number mutations affecting palindrome 1. This corresponds to a mutation rate of 2.34 × 10⁻³ mutations per meiosis, which is 4.1 times larger than our phylogenetic estimate of the mutation rate (5.72 × 10⁻⁴), suggesting that de novo mutations on the Y are lost faster than expected under neutral evolution. Although simulations indicate a selection coefficient of 1.8% against non-reference copy number carriers, we do not observe differences in fertility among sequenced men associated with their copy number genotype, but we lack statistical power to detect differences resulting from weak negative selection. We also perform association testing of a diverse set of 341 traits to palindromic copy number without any significant associations. We conclude that large-scale palindrome copy number variation on the Y chromosome has little impact on human phenotype diversity.


Conflict of interest statement

V.B.G., A.H. and K.S. are employees of deCODE Genetics and Amgen. The remaining authors declare no competing interests.

Figures

Fig. 1
Fig. 1. Copy number distribution of the Y chromosome palindromes in the Icelandic population.
A Y chromosome ampliconic regions. Top is a rectangular schematic of the entire Y chromosome. Below is a zoomed version of the mappable part of the male specific region of the Y chromosome, with the palindromes represented by labelled light blue triangles and the positions of genes shown below. Genes in red are known to be ampliconic and the grey shaded areas represent the centromere. Third is a further zoomed version of the ampliconic regions, again with the positions of palindromes and genes shown, and now also with amplicons shown as labelled coloured arrows. In the reference sequence of the human Y chromosome (NCBI build 38), the yellow amplicon (573,272 bp) has two copies (unique to palindrome P1), the green amplicon (307,076 bp) has three copies (two in P1 and one next to P2), the red amplicon (127,091 bp) has four copies (two in P1 and two in P2), the blue amplicon (167,703 bp) has four copies (two in P1 and two in P3), and the teal amplicon (115,689 bp) has two copies (unique to P3). B Copy number of the amplicons located in palindromes 1, 2 and 3. C Copy number of palindromes 4, 5, 6 and 8. D Mean minor allele read frequency (MARF) of paralogous sequence variants per male across the yellow amplicon shown in relation to copy number. E Number of paralogous sequence variants passing the filters used to calculate the MARF values presented in (D), shown in relation to copy number. F The structure of amplicons in the reference sequence and some of the known structural variants identified by previous studies, characterised deletions and amplification within the AZFc region. For deletions, the missing region is indicated with dotted lines. For duplications, the added region is indicated with a line delimiting the interval of the duplication.
Fig. 2
Fig. 2. Detecting de novo mutations in patrilines.
A An example of a patriline with a mutation event carried by multiple descendants (MD) leading to increased CN (2 - > 3) of the yellow amplicon. Each circle represents a male in the patriline, with lines representing the transmissions of Y chromosomes from father to son and the number inside each circle representing the observed (dark blue) or inferred (light blue) CN genotype. Red lines represent the transmissions where the mutation occurred. B For the five males with observed CN genotypes from the patriline shown in panel A, we show copy number across non-overlapping 1 kb windows for the yellow, green and red amplicons. The carriers of the mutation are indicated by a red frame. The position of each amplicon is indicated with coloured rectangles above the plots. C Boxplot representing the distribution of the CN across non-overlapping 1 kb windows within the green, red, teal and yellow amplicon, for each of the five males with observed CN genotypes in the patriline. Here we see that the 2- > 3 increase in CN affects the green, red and yellow amplicons, but not the teal amplicon. D A summary of CN genotypes of all males with sequencing data, based on the median of the medians across non-overlapping 1 kb windows for each of the four amplicons. Each circle represents one male, with colours indicating the CN genotype called. The five sequenced members of the patriline in panel A are represented by black circles. E Comparison of the mutation rate estimated from the Y chromosome phylogenetic tree and the de novo mutation rate estimated using patrilines. A schematic representation of the Y chromosome phylogenetic tree (top) and four patrilines (bottom). The phylogenetic tree was constructed from individuals with at least 10 mutational differences according to haploid genotypes from the X-degenerate region of the Y chromosome, in order to minimise overlap between transmissions in the patrilines and the phylogenetic tree. As in the case of the patrilines, CN genotypes for ancestral males in the phylogenetic tree were inferred using parsimony, conditioning on the males with observed CN genotypes and their position in the tree.

References

    1. Teitz LS, Pyntikova T, Skaletsky H, Page DC. Selection has countered high mutability to preserve the ancestral copy number of y chromosome amplicons in diverse human lineages. Am. J. Hum. Genet. 2018;103:261–275. doi: 10.1016/j.ajhg.2018.07.007. - DOI - PMC - PubMed
    1. Bachtrog D. Y-chromosome evolution: emerging insights into processes of Y-chromosome degeneration. Nat. Rev. Genet. 2013;14:113–124. doi: 10.1038/nrg3366. - DOI - PMC - PubMed
    1. Krausz C, Casamonti E. Spermatogenic failure and the Y chromosome. Hum. Genet. 2017;136:637–655. doi: 10.1007/s00439-017-1793-8. - DOI - PubMed
    1. Rozen S, Skaletsky H, Marszalek J, Minx P. Abundant gene conversion between arms of palindromes in human and ape Y chromosomes. Nature. 2003;423:873–876. doi: 10.1038/nature01723. - DOI - PubMed
    1. Skaletsky H, et al. The male-specific region of the human Y chromosome is a mosaic of discrete sequence classes. Nature. 2003;423:825–837. doi: 10.1038/nature01722. - DOI - PubMed

Publication types

LinkOut - more resources