. 2023 Jul 6;14(1):3903.
doi: 10.1038/s41467-023-39461-x.

Important role of endogenous microbial symbionts of fish gills in the challenging but highly biodiverse Amazonian blackwaters

Affiliations

Important role of endogenous microbial symbionts of fish gills in the challenging but highly biodiverse Amazonian blackwaters

Sylvain François-Étienne et al. Nat Commun. .

Abstract

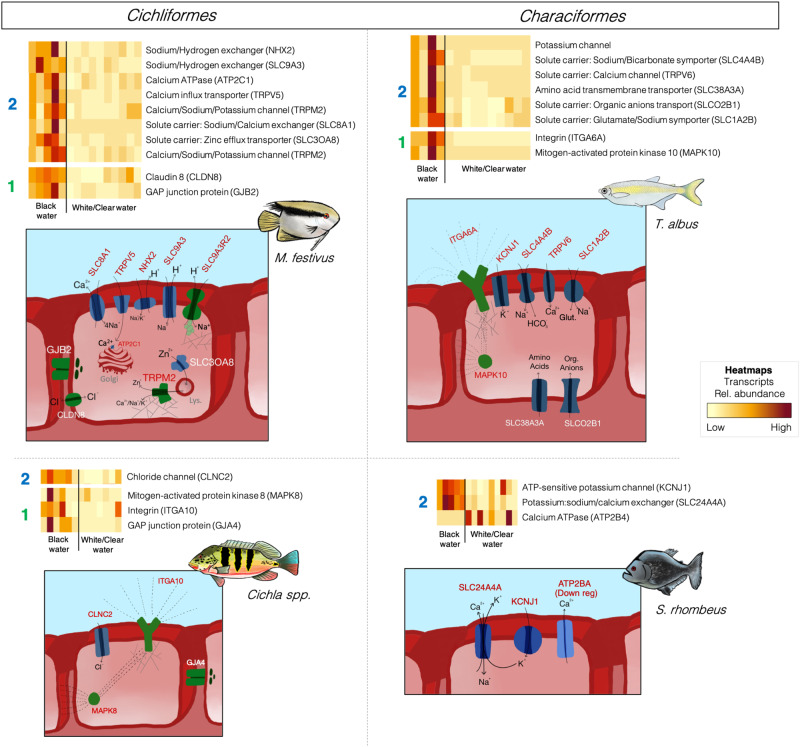
Amazonian blackwaters are extremely biodiverse systems containing some of Earth's most naturally acidic, dissolved organic carbon -rich and ion-poor waters. Physiological adaptations of fish facing these ionoregulatory challenges are unresolved but could involve microbially-mediated processes. Here, we characterize the physiological response of 964 fish-microbe systems from four blackwater Teleost species along a natural hydrochemical gradient, using dual RNA-Seq and 16 S rRNA of gill samples. We find that host transcriptional responses to blackwaters are species-specific, but occasionally include the overexpression of Toll-receptors and integrins associated to interkingdom communication. Blackwater gill microbiomes are characterized by a transcriptionally-active betaproteobacterial cluster potentially interfering with epithelial permeability. We explore further blackwater fish-microbe interactions by analyzing transcriptomes of axenic zebrafish larvae exposed to sterile, non-sterile and inverted (non-native bacterioplankton) blackwater. We find that axenic zebrafish survive poorly when exposed to sterile/inverted blackwater. Overall, our results suggest a critical role for endogenous symbionts in blackwater fish physiology.


Conflict of interest statement

The authors declare no competing interests.

Figures

Fig. 1
Fig. 1. Differential gene expression (DGE) analyses on transcripts from genes involved in ionoregulation processes, between black- and non-blackwater (clear- and whitewater) specimens (dual-RNASeq dataset).
DGE results are shown in heatmaps. For ease of viewing, only transcripts overexpressed in blackwater specimens are shown (except for S. rhombeus where underexpressed transcripts were also shown due to the low number of differentially expressed genes identified for this species). In the heatmaps, each row represents a gene while each column is a sample (pool of ~20 fish per species per sampling site). Numbers on the left of each heatmap indicate the ionoregulatory strategy associated with the subset of genes, either (#1) the regulation of ion efflux or (#2) the regulation of active ion uptake. Drawings below each heatmap represent the subset of overexpressed proteins in blackwater and proteins are colored according to the ionoregulatory strategy in which they are involved (#1 in green and #2 in blue). Cellular localization of the proteins and the direction of ion transport may differ from drawing. Dashed lines between proteins indicate potential interactions in signaling pathways. Web-like structures annexed to ITGA10, ITGA6A, and TRPM2 indicate potential interactions with the cytoskeleton. “Golgi” stands for the Golgi apparatus and “Lys.” is for lysosome. In the heatmaps, yellow/beige colors are associated with a low relative abundance of the transcripts from the gene in a sample, while dark red colors are associated with high relative abundance. Source data are provided as a Source Data file.
Fig. 2
Fig. 2. Bray–Curtis distance-based redundancy analyses (dbRDA) on the gill bacterial community samples of each host species (16 S rRNA dataset).
The analysis was conducted on samples from flag cichlids (a), peacock bass (b), freshwater sardines (c), and black piranhas (d). Each data point in the dbRDAs represents a microbiome sample colored according to its water type of origin (black for blackwater, beige for whitewater, and blue for clearwater samples). The environmental parameters represented in the dbRDAs were selected by ordistep and had a VIF < 10. Environmental parameters colored in green are those associated with dissolved organic carbon quantity or the relative proportion of its different fluorescent fractions (humic-, fulvic- or protein-like). PERMANOVA results (two-sided test) exploring the differences in community composition between water types are colored in red on the dbRDAs. “***” stands for PERMANOVA p value < 0.001. The relative abundance (%) of bacterial blackwater biomarkers identified by a multi-level pattern analysis is shown in boxplots (same color key as for the dbRDA), and the average indicator value of the genera represented by those biomarker ASVs is shown in barplots. For this analysis, biologically independent samples of black piranha (N = 231), flag cichlid (N = 296), peacock bass (N = 172), and freshwater sardine (N = 228) microbiotas were examined. The center of the boxplots corresponds to the median. The lower and upper bounds of boxes represent the first and third quartiles (the 25th and 75th percentiles). The lower whiskers extend from the lower bounds of boxes to the lowest values within 1.5 * the inter-quartile range (distance between the first and third quartiles). The upper whiskers extend from the upper bounds of boxes to the highest values that is within 1.5 * the inter-quartile range. Data beyond the end of the whiskers are outliers and plotted as points. Source data are provided as a Source Data file.
Fig. 3
Fig. 3. Correlations between the abundance of the transcripts from bacterial RNA-Seq transcriptomes from the blackwater biomarkers (identified in Fig. 2) and those from differentially expressed host genes shown in Fig. 1 (dual RNA-Seq dataset).
The abundance of host and bacterial transcripts is displayed on scatterplots and on the annexed heatmaps, for black piranhas (ac), freshwater sardines (d, e), and flag cichlids (f). Samples in the scatterplots are colored according to their water type (black for blackwater, beige for whitewater, and blue for clearwater samples). The different taxa producing the bacterial transcripts detected are shown in stacked barplots along the heatmaps. In the scatterplots, “Sp. R2” stands for Spearman correlation R2. The term “p val” stands for the “p values of the two-sided Spearman correlation tests”, which have the following values in a p val = 0.03, b p val = 0.006, c p val = 0.04, d p val = 0.02, e p val = 0.05 and f p val = 0.05. Y axes are shown in log scale to increase visibility. In the stacked barplots, the bacterial taxa are annotated to the best taxonomic resolution possible. In the heatmaps, yellow/beige colors are associated with a low relative abundance of the transcripts from the gene in a sample, while dark red colors are associated with high relative abundance. Source data are provided as a Source Data file.
Fig. 4
Fig. 4. Response of zebrafish host-microbe systems to black- and whitewater sterile and non-sterile treatments.
a, b Heatmap showing the transcript abundances of overexpressed genes in zebrafish larvae exposed to white- and blackwater non-sterile treatments. c, d Same as a, b but in sterile treatments. b, d The shared response is constituted of genes that are overexpressed in both non-sterile and sterile treatments. e Stacked barplot showing the relative abundance of the bacterial classes detected on the heads of zebrafish larvae in non-sterile black- and whitewater treatments (16 S rRNA dataset). f Stacked barplot showing the relative transcript abundance of the different Comamonadaceae taxa detected in our dataset (dual RNA-Seq dataset). In the stacked barplots, the bacterial taxa are annotated to the best taxonomic resolution possible. BWN stands for “non-sterile blackwater with native bacterioplankton”; BWI for “inverted non-sterile blackwater” (with whitewater bacterioplankton); BWS for “sterile blackwater”; BWIS for “inverted sterile blackwater” (with sterilized whitewater bacterioplankton); WWN stands for “non-sterile whitewater with native bacterioplankton”; WWI for “inverted non-sterile whitewater” (with blackwater bacterioplankton); WWS for “sterile whitewater”; WWIS for “inverted sterile whitewater” (with sterilized blackwater bacterioplankton). In the heatmaps, yellow/beige colors are associated with a low relative abundance of the transcripts from the gene in a treatment, while dark red colors are associated with high relative abundance. Source data are provided as a Source Data file.
Fig. 5
Fig. 5. Map of the sampling sites visited for this study.
Markers associated to every site are colored according to their water type (black for blackwater, beige for whitewater, and blue for clearwater samples).
Fig. 6
Fig. 6. Summary of the germ-free zebrafish experiment, including the main steps necessary to prepare the eight experimental conditions.
In the second row of FalconTM tubes, full tubes represent supernatant while empty ones represent pellets (suspended material in original water, including sediments and bacterioplankton). Dashed lines represent steps that were not undertaken in the preparation of the referred groups.

References

    1. Robroek BJM, et al. Taxonomic and functional turnover are decoupled in European peat bogs. Nat. Commun. 2017;8:1161. doi: 10.1038/s41467-017-01350-5. - DOI - PMC - PubMed
    1. Holland A, et al. Effect of key water quality variables on macroinvertebrate and fish communities within naturally acidic wallum streams. Mar. Freshw. Res. 2014;66:50. doi: 10.1071/MF13285. - DOI
    1. Sabater F, Meyer J, Edwards R. Longitudinal patterns of dissolved organic carbon concentration and suspended bacterial density along a blackwater river. Biogeochemistry. 1993;21:73–93. doi: 10.1007/BF00000872. - DOI
    1. Val, A. L., & Almeida‐Val, V. M. F. Fishes of the Amazon and their environment: physiological and biochemical features (Springer, Berlin, 1995).
    1. Walker, I., & Henderson, P. A. Ecophysiological aspects of Amazonian blackwater litterbank fish communities. In: Val, A. L., Almeida‐Val, V. M. F., & Randall, D. J. (Eds.). Physiology and Biochemistry of Fishes of the Amazon (Instituto Nacional de Pesquisas da Amazonia, Manaus, 1996).

Publication types