. 2023 Jul 6;14(1):4003.
doi: 10.1038/s41467-023-39717-6.

Genome-wide mapping of cancer dependency genes and genetic modifiers of chemotherapy in high-risk hepatoblastoma

Affiliations

Genome-wide mapping of cancer dependency genes and genetic modifiers of chemotherapy in high-risk hepatoblastoma

Jie Fang et al. Nat Commun. .

Abstract

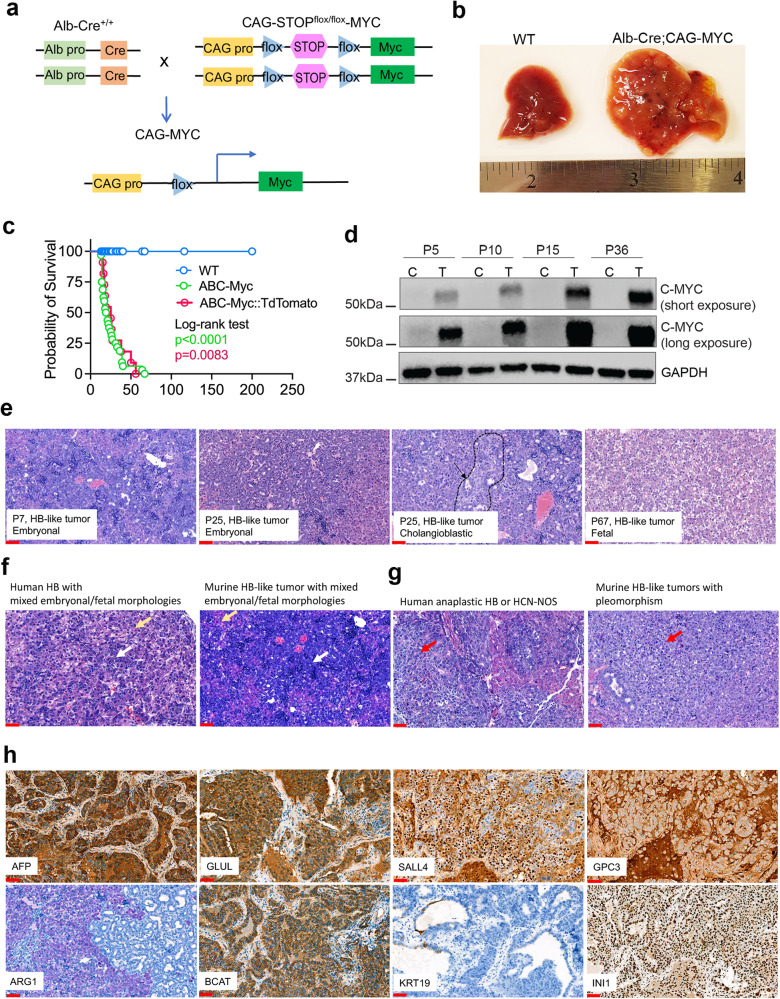
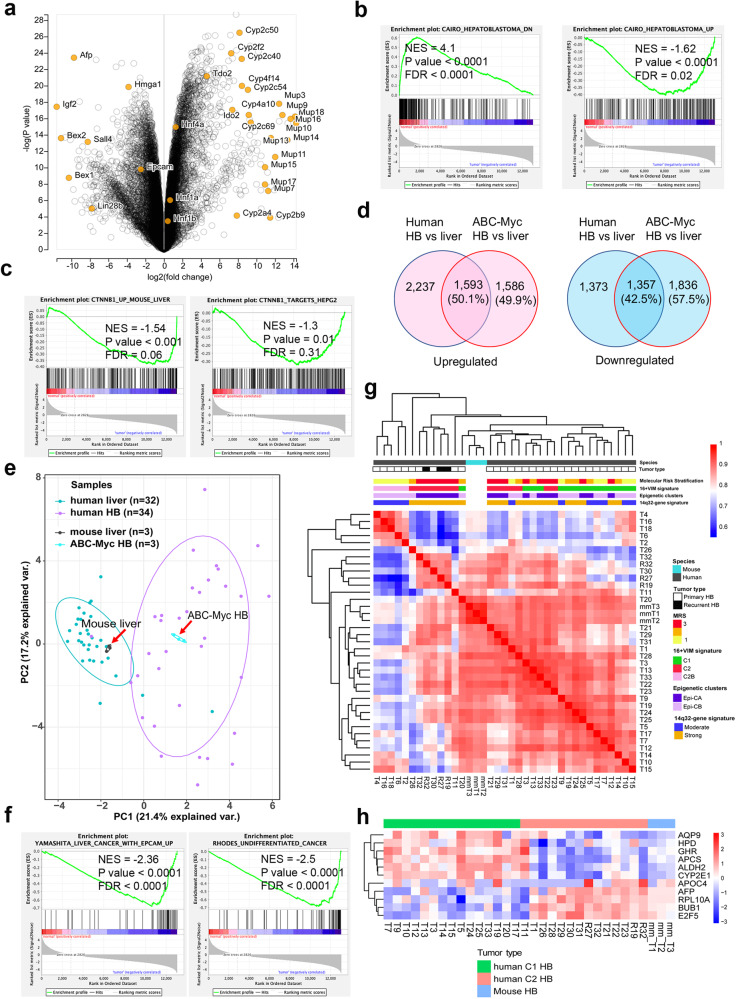
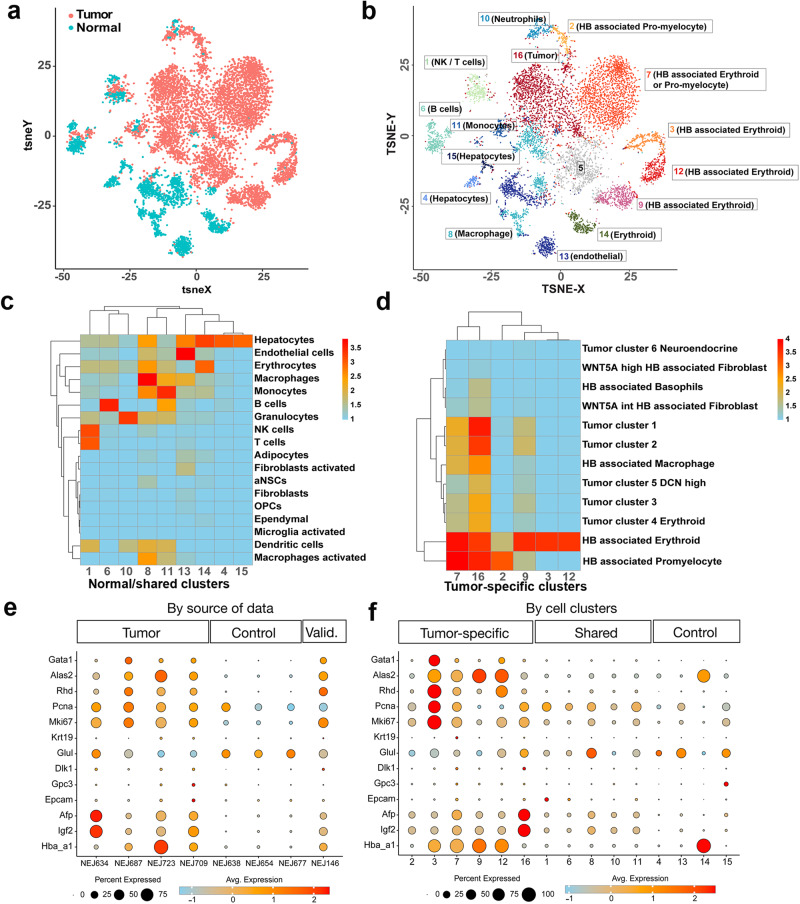
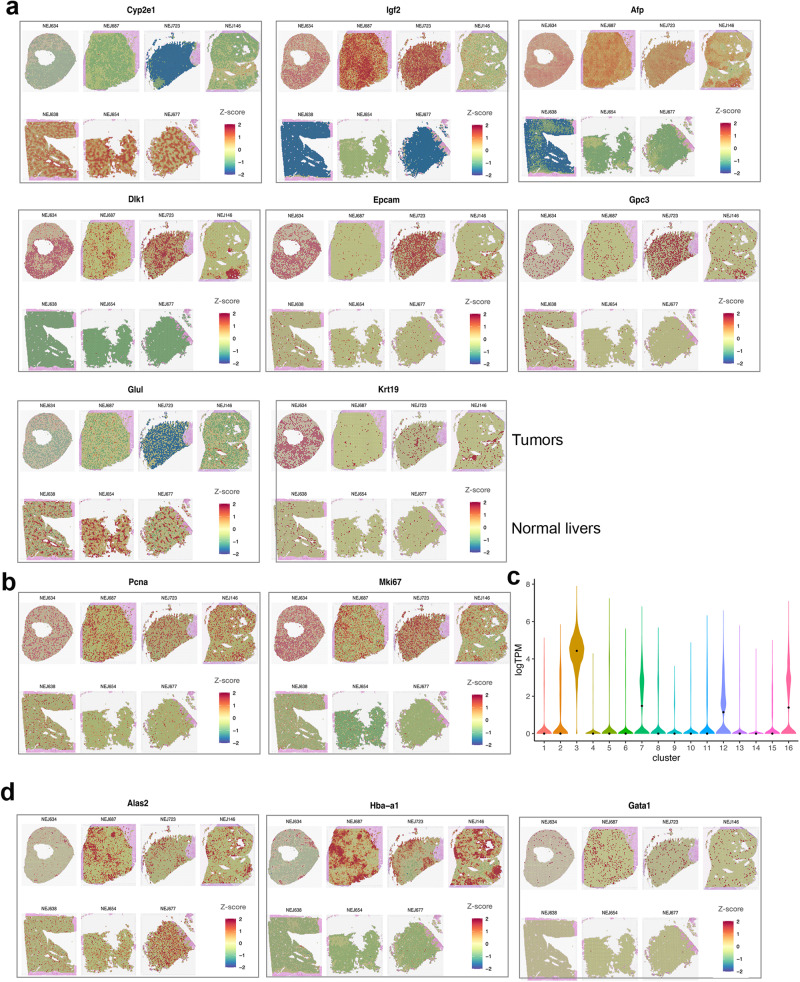
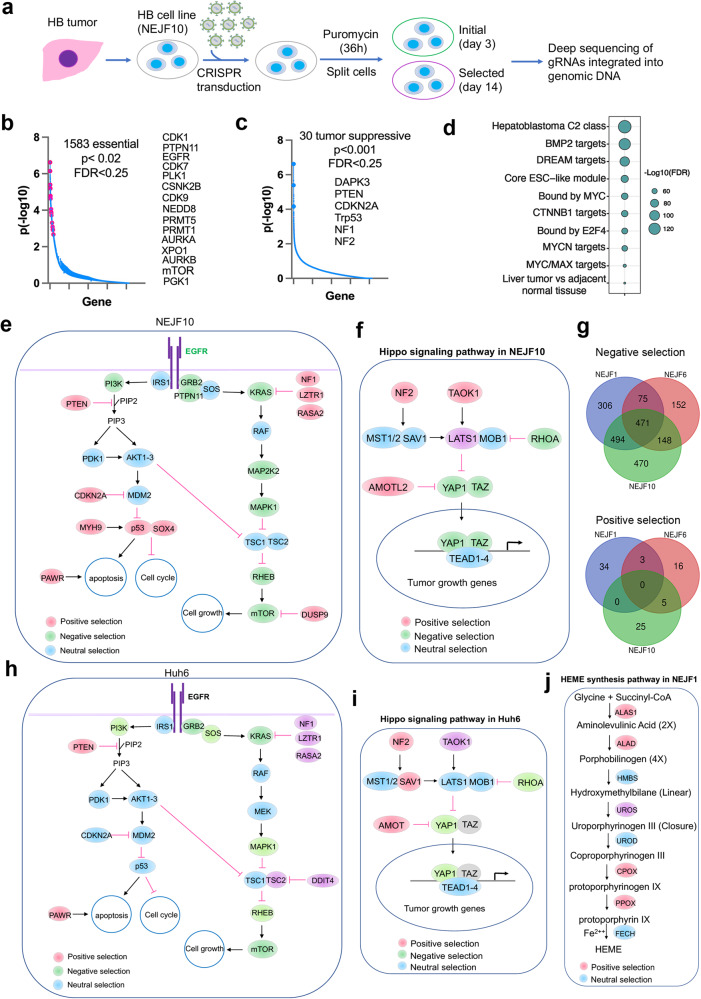
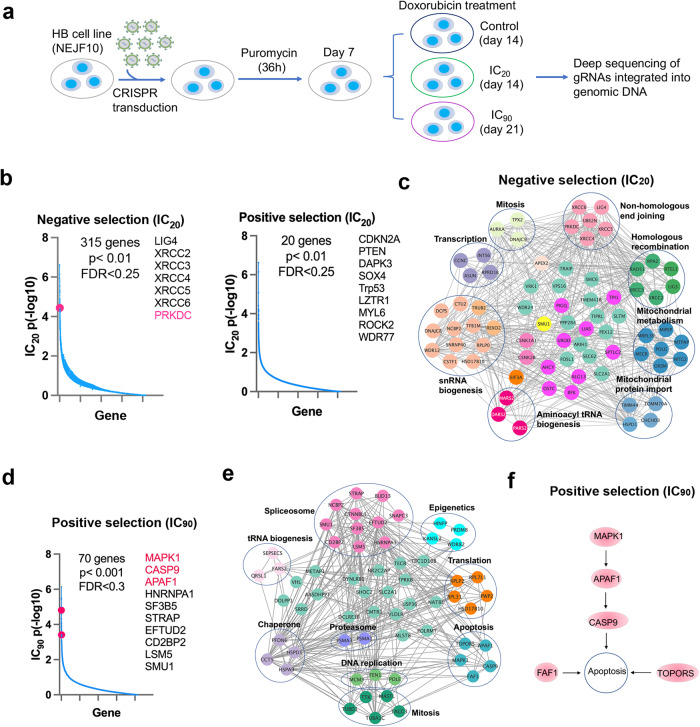
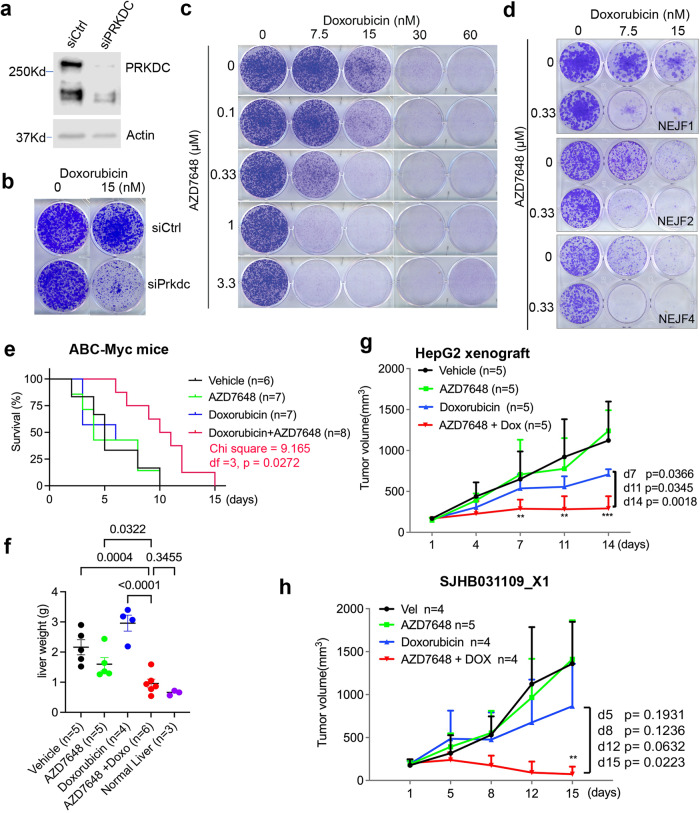
A lack of relevant genetic models and cell lines hampers our understanding of hepatoblastoma pathogenesis and the development of new therapies for this neoplasm. Here, we report an improved MYC-driven hepatoblastoma-like murine model that recapitulates the pathological features of embryonal type of hepatoblastoma, with transcriptomics resembling the high-risk gene signatures of the human disease. Single-cell RNA-sequencing and spatial transcriptomics identify distinct subpopulations of hepatoblastoma cells. After deriving cell lines from the mouse model, we map cancer dependency genes using CRISPR-Cas9 screening and identify druggable targets shared with human hepatoblastoma (e.g., CDK7, CDK9, PRMT1, PRMT5). Our screen also reveals oncogenes and tumor suppressor genes in hepatoblastoma that engage multiple, druggable cancer signaling pathways. Chemotherapy is critical for human hepatoblastoma treatment. A genetic mapping of doxorubicin response by CRISPR-Cas9 screening identifies modifiers whose loss-of-function synergizes with (e.g., PRKDC) or antagonizes (e.g., apoptosis genes) the effect of chemotherapy. The combination of PRKDC inhibition and doxorubicin-based chemotherapy greatly enhances therapeutic efficacy. These studies provide a set of resources including disease models suitable for identifying and validating potential therapeutic targets in human high-risk hepatoblastoma.


Conflict of interest statement

The authors declare no competing interests.

Figures

Fig. 1
Fig. 1. ABC-Myc drives hepatoblastoma-like tumor development.
a Breeding strategy to generate Alb-Cre;CAG-Myc (ABC-Myc) compound mice. b Hepatomegaly with tumor nodules in ABC-Myc liver in comparison with age matched normal mouse liver. c Inferior overall survival of ABC-Myc (green color, n = 33), and ABC-Myc/TdTomato (pink, n = 11) mice, respectively. Log-rank (Mantel-Cox) test used for statistical analysis in Kaplan-Meier survival. d Western blot showing overexpression of C-MYC in ABC-Myc livers at postnatal day 5 (P5), 10 (P10),15 (P15) and 36 (P36) in comparison with the normal controls. The blots are representative of three independent experiments. e Hematoxylin and Eosin (H&E) shows histology of ABC-Myc tumors at postnatal day 7 (P7), 25 (P25), 67 (P67). Sample number for each image n = 1. Scale bar = 25 μm. f Hematoxylin and Eosin (H&E) shows mixed histology of human and ABC-Myc tumors. Sample number for each image n = 1. Scale bar = 25 μm. g Hematoxylin and Eosin (H&E) shows pleomorphism of human and ABC-Myc tumors. Sample number for each image n = 1. Scale bar = 25 μm. h Immunostaining of alpha fetoprotein (AFP), glutamine synthetase (GLUL), Spalt Like Transcription Factor 4 (SALL4), Glypican 3 (GPC3), arginase (ARG1), β-catenin (BCAT), cytokeratin 19 (KRT19) and integrase interactor 1 (INI1). Sample number for each image n = 1. Scale bar = 25 μm. Source data are provided as a Source Data file.
Fig. 2
Fig. 2. Clinical chemistry analysis of serum from ABC-Myc mice.
a Quantification of serum AFP levels in normal (n = 4 biologically independent animals) and ABC-Myc (n = 6 biologically independent animals) mice by ELISA. Data are presented as mean ± SD. Unpaired two-sided t-test,**p = 0.0046. b Chemistry panel markers in determination of liver function, kidney function and electrolytes in serum from normal (n = 3 biologically independent animals) and ABC-Myc (n = 4 biologically independent animals) mice. Data are presented as mean ± SD. Unpaired two-sided t-test,****p < 0.0001, **p = 0.0056, *p = 0.0171, ns not significant. ALP Alkaline phosphatase, ALT Alanine transaminase, BUN Blood urea nitrogen. c Complete blood count to determine the changes in red blood cells in blood from normal (n = 3 biologically independent animals) and ABC-Myc (n = 4 biologically independent animals) mice. Data are presented as mean ± SD. Unpaired two-sided t-test,****p < 0.0001, ***p < 0.001, ns not significant. HCT hematocrit, RBC red blood cell, HB hemoglobin, MCV mean corpuscular volume, MCH mean corpuscular hemoglobin, MCHC mean corpuscular hemoglobin concentration, RDW red cell distribution width, RSD red cell standard deviation. d Complete blood count to determine the changes in platelets in blood from normal (n = 3 biologically independent animals) and ABC-Myc (n = 4 biologically independent animals) mice. Data are presented as mean ± SD. Unpaired two-sided t-test,****p < 0.0001, ***p < 0.001, **p = 0.0017. PLT platelet, MPV mean platelet volume, PDW platelet distribution width, PCT Plateletcrit. Source data are provided as a Source Data file.
Fig. 3
Fig. 3. Signaling pathways in ABC-Myc tumor cells resemble those in human hepatoblastoma with poor outcome.
a Volcano plot showing differentially expressed genes in ABC-Myc tumors (n = 3) vs normal mouse livers (n = 3). X-axis represents the expression changes in log2 (fold). Y axis represents the significance of expression change for each gene in -log10 (p value). b GSEA showing genes highly downregulated and upregulated in ABC-Myc hepatoblastoma are significantly associated with the signatures downregulated (left panel) and upregulated (right panel) in human hepatoblastoma reported by Cario et al.. P Value calculated by one-sided Fisher’s exact test. The FDR is calculated by comparing the distribution of normalized enrichment scores from many different genesets. c GSEA showing genes highly upregulated in ABC-Myc hepatoblastoma are significantly associated with the β-catenin signatures derived from mouse livers overexpressing β-catenin in dataset (GSE79084) (left panel), and β-catenin knockdown in HepG2 cells from dataset (GSE94858) (right panel). d Proportional VENN diagrams of the up-regulated (top) and down-regulated genes (bottom) in the human HB (n = 34) vs. adjacent non-tumor liver (NL, n = 32) samples (left) and mice Myc-ABC tumor (n = 3) vs. control liver (CL, n = 3) samples. The numbers in the Venn diagrams represent the number of significant genes at FDR < 0.05. The comparisons were performed considering the total of 11,393 ortholog genes. RNA-seq database from patients with HB was obtained from Carrillo-Reixach et al. (GSE133039). The P values (upregulated p = 1.6 × 10−96, downregulated p = 2.1 × 10−153) of the overlaps are calculated by the hypergeometric distribution. e Principal Component Analysis using the integrated dataset consisting in 11393 genes present in mouse and human tumor (HB, GSE133039), non-tumor liver (NL) and control liver (CL) samples. f GSEA showing stem cell gene signatures highly upregulated in ABC-Myc hepatoblastoma. P Value calculated by one-sided Fisher’s exact test. The FDR is calculated by comparing the distribution of normalized enrichment scores from many different genesets. g Pearson correlation heatmap using the dendrogram of bootstrapping hierarchical clustering from tumoral samples including the 11,393 ortholog genes present in mouse and human tumor samples. Human hepatoblastomas were annotated with molecular features obtained from Carrillo-Reixach et al. (GSE133039). h Heatmap of the 11 ortholog genes of gene the 16-gene signature in C1 and C2 human hepatoblastomas (GSE133039) and mouse ABC-Myc tumors. Source data are provided as a Source Data file.
Fig. 4
Fig. 4. scRNA-seq analysis of ABC-Myc tumors reveals the heterogeneity of hepatoblastoma-like cells.
a A t-SNE plot showing the source of cells partitioned by normal livers (n = 3) and ABC-Myc tumor (n = 4) samples. b A t-SNE plot showing the inferred cell clusters using Latent Cellular State Analysis for the normal livers (n = 3) and ABC-Myc tumor (n = 4) samples. Cluster 5 mainly consisted of low-quality cells with low (≤500) UMI counts or more than 20% UMI counts from mitochondrial genes. Therefore cluster 5 was not pursued further in our analysis. The cells in each cluster were colored and labeled with numbered annotations assigned by the Bioconductor package SingleR using normal mouse cell-type marker genes and orthologs of human hepatoblastoma tumor signature genes (Song et al.,) as references. c Confusion matrices of cell clusters, shared between normal liver and tumor samples or specific to normal liver samples, aligned against a reference expression profile consisting of normal mouse cell types from celldex. The color indicates the log10 transformed counts of labeled cells using SingleR. d Confusion matrices of tumor-specific cell clusters aligned against reference human HB tumor data from Song et al.. The color indicates the log10 transformed counts of labeled cells. e Expression pattern of selected up-regulated genes between tumor and control groups. Each dot represents the expression profile for a gene in a sample. The size of a dot indicates the percent of expressed cells in a sample, and the darkness of the blue color indicates the strength of average expression. Data was grouped by tumor samples, control samples, and a tumor sample NEJ146 as the validation set. f Bubble plot of the expression pattern of selected up-regulated genes between tumor and control groups, with data grouped by inferred cell clusters. Source data are provided as a Source Data file.
Fig. 5
Fig. 5. Spatial transcriptomic analysis of ABC-Myc tumors validates the heterogeneity of hepatoblastoma-like cells.
a, b, d Spatial feature plots of selected marker genes Cyp2e1, Igf2, Afp, Dlk1, Epcam, Gpc3, Glul, Krt19 a, Pcna and Mki67 b, Alas2, Hba-a1, Gata1 d. In each plot, the top row is tumor samples, and the bottom row is normal liver samples. The gene-spot matrices were analyzed with the Seurat package (versions 3.0.0/3.1.3) in R. Spatial spots were colored by the z-transformed expression values across samples, showing extensive gene expression heterogeneity. c Violin plot for Mki67 expression levels across 16 clusters in single-cell RNA-seq data. Source data are provided as a Source Data file.
Fig. 6
Fig. 6. Cancer dependency genes and oncogenic pathways of hepatoblastoma cells.
a Diagram showing the procedure of genome-wide CRISPR screen of cancer dependency genes using ABC-Myc NEJF10 cell line. b, c Cancer essential genes and tumor suppressors identified in NEJF10 cell line with FDR cutoff <0.25. X-axis represents the total gene number. Y axis represents the p value in -log10. P value obtained by permutation test and FDR calculated from the empirical permutation p-values using the Benjamini-Hochberg procedure by MAGeCK. d Pathway enrichment analysis of cancer dependency genes identified in ABC-Myc cell line by using GSEA and CGP (chemical and genetic perturbations) dataset. e Canonical cancer pathways enriched in genes identified by CRISPR screen in NEJF10 cell line. f Hippo signaling pathway enriched in genes identified by CRISPR screen in NEJF10 cell line. g Venn analysis of essential genes (negative selection) and tumor suppressive genes (positive selection) identified from NEJF1, NEJF6, NEJF10. CRISPR FDR cutoff <0.25. h Cancer dependency genes identified in human hepatoblastoma Huh6 cell line from DepMap data (www.depmap.org). i Hippo signaling pathway enriched in genes identified by CRISPR screen in Huh6 cell line. j Heme biosynthesis pathway was enriched in positive selection in NEJF1 cells. Source data are provided as a Source Data file.
Fig. 7
Fig. 7. Identification of genetic modifiers of chemotherapy.
a Diagram showing the procedure of genome wide CRISPR screening for the genetic modifiers of doxorubicin in NEJF10 cell line. b Negative selection and positive selection under IC20 of doxorubicin. The red dot highlighted in the graph indicates Prkdc gene that is focused on in this study. CRISPR FDR cutoff <0.25. X-axis represents the total gene number. Y axis represents the p value in -log10. P value obtained by permutation test and FDR calculated from the empirical permutation p-values using the Benjamini-Hochberg procedure by MAGeCK. c Pathways within a protein–protein interaction network enriched in negative selection under IC20 of doxorubicin. d Positive selection under IC90 of doxorubicin. CRISPR FDR cutoff <0.3. X-axis represents the total gene number. Y axis represents the p value in -log10. The genes highlighted in pink color indicates genes involved in apoptosis pathway. P value obtained by permutation test and FDR calculated from the empirical permutation p-values using the Benjamini-Hochberg procedure by MAGeCK. e, f Pathways within a protein-protein interaction network enriched in positive selection under IC90 of doxorubicin€) and apoptotic pathway f. Network analysis performed using STRING program. Source data are provided as a Source Data file.
Fig. 8
Fig. 8. Combination of doxorubicin and PRKDC inhibitor has a better anticancer efficacy.
a Western blot showing knockdown of PRKDC in NEJF10 cells after 72 h transfection of siRNA into NEJF10 cells. The blots are representative of three independent experiments. b Colony formation showing the effect of combination of Prkdc knockdown and doxorubicin treatment for 4 days. The images are representatives of 3 independent experiments. c Colony formation showing the synergistic effect of combination of different concentrations of doxorubicin and AZD7648 to treat NEJF10 for 5 days. The images are representatives of three independent experiments. d Colony formation for NEJF1, NEJF2, NEJF4 treated with doxorubicin and AZD7648 for 5 days. The images are representatives of two independent experiments. e Survival rate for ABC-Myc treated with vehicle (n = 6), doxorubicin (0.75 mg/kg, twice weekly; n = 7) and AZD7648 (50 mg/kg, twice daily; n = 7), and combination of doxorubicin and AZD7648 (n = 8). P value calculated by log-rank (Mantel-Cox) test method. f Liver weight after treatment in each group of ABC-Myc mice (vehicle n = 5, AZD7648 n = 5, doxorubicin n = 5, combination of doxorubicin and AZD7648 n = 6) and normal liver (n = 3) in age matching mice. Data are presented as mean ± SD. P value calculated by two-sided student t test. g Tumor volume for each treatment group of HepG2 xenografts with vehicle (n = 5), doxorubicin (1.0 mg/kg, twice weekly; n = 5), AZD7648 (50 mg/kg, twice daily; n = 5) and combination of doxorubicin and AZD7648 (n = 5). p value calculated by two-sided student t test for two groups (doxorubicin vs doxorubicin/AZD7648) at each time point. h Tumor volume for each treatment group of SJHB031109_X1 PDX xenografts with vehicle (n = 4), doxorubicin (0.75 mg/kg, twice weekly; n = 4), AZD7648 (50 mg/kg, twice daily; n = 5) and combination of doxorubicin and AZD7648 (n = 4).Data are presented as mean ± SD. p value calculated by two-sided student t test for two groups (doxorubicin vs doxorubicin/AZD7648) at each time point. Source data are provided as a Source Data file.

References

    1. Lau CS, Mahendraraj K, Chamberlain RS. Hepatocellular carcinoma in the pediatric population: a population based clinical outcomes study involving 257 patients from the surveillance, epidemiology, and end result (SEER) database (1973–2011) HPB Surg. 2015;2015:670728. doi: 10.1155/2015/670728. - DOI - PMC - PubMed
    1. Hubbard AK, Spector LG, Fortuna G, Marcotte EL, Poynter JN. Trends in international incidence of pediatric cancers in children under 5 years of age: 1988–2012. JNCI Cancer Spectr. 2019;3:pkz007. doi: 10.1093/jncics/pkz007. - DOI - PMC - PubMed
    1. Spector LG, Birch J. The epidemiology of hepatoblastoma. Pediatr. Blood Cancer. 2012;59:776–779. doi: 10.1002/pbc.24215. - DOI - PubMed
    1. Schady DA, Roy A, Finegold MJ. Liver tumors in children with metabolic disorders. Transl. Pediatr. 2015;4:290–303. - PMC - PubMed
    1. Lim, I. I. P., Bondoc, A. J., Geller, J. I. & Tiao, G. M. Hepatoblastoma: the evolution of biology, surgery, and transplantation. Children (Basel)610.3390/children6010001 (2018). - PMC - PubMed

Publication types