. 2023 Jul 6;14(1):3985.
doi: 10.1038/s41467-023-39698-6.

A spatio-temporal analysis investigating completeness and inequalities of global urban building data in OpenStreetMap

Affiliations

A spatio-temporal analysis investigating completeness and inequalities of global urban building data in OpenStreetMap

Benjamin Herfort et al. Nat Commun. .

Abstract

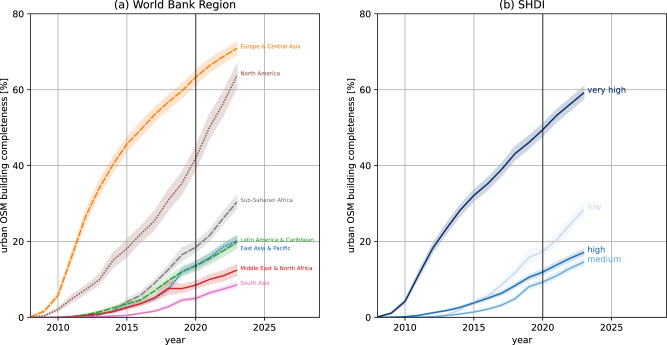
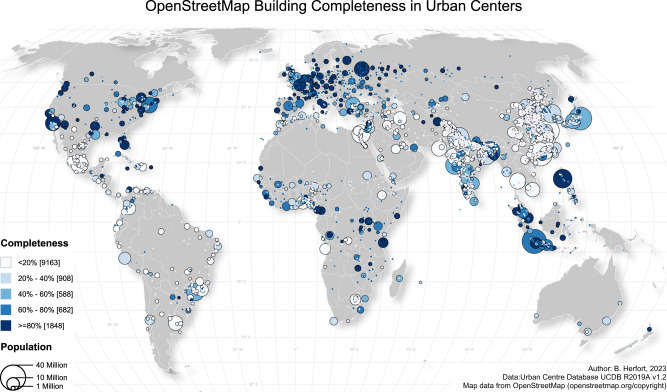
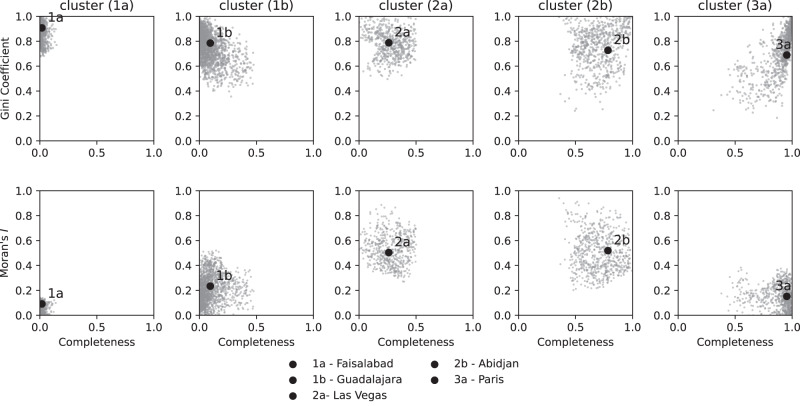
OpenStreetMap (OSM) has evolved as a popular dataset for global urban analyses, such as assessing progress towards the Sustainable Development Goals. However, many analyses do not account for the uneven spatial coverage of existing data. We employ a machine-learning model to infer the completeness of OSM building stock data for 13,189 urban agglomerations worldwide. For 1,848 urban centres (16% of the urban population), OSM building footprint data exceeds 80% completeness, but completeness remains lower than 20% for 9,163 cities (48% of the urban population). Although OSM data inequalities have recently receded, partially as a result of humanitarian mapping efforts, a complex unequal pattern of spatial biases remains, which vary across various human development index groups, population sizes and geographic regions. Based on these results, we provide recommendations for data producers and urban analysts to manage the uneven coverage of OSM data, as well as a framework to support the assessment of completeness biases.


Conflict of interest statement

S.L., J.A. and A.Z. declare no competing interests. B.H. and J.P.A. are unpaid voting members of the Humanitarian OpenStreetMap Team. Voting Members are responsible for voting “on matters affecting the Corporation including, but not limited to, the election of directors and [additional] voting members.”

Figures

Fig. 1
Fig. 1. Temporal evolution of urban OSM building completeness.
Average values are derived for a world regions and b Subnational Human Development Index (SHDI) group. Completeness was derived by aggregating building area predictions based on a Random Forests model and annual OSM building area per urban center. The shaded areas represent the 95% confidence interval for each line. SHDI classes were based on cut-off points defined by the United Nations Development Programme: low human development (SHDI < 0.550), medium human development (SHDI: 0.550–0.699), high human development (SHDI: 0.700–0.799), very high human development (SHDI > 0.800). OSM data from January 1, 2008, to January 1, 2023. Building area predictions were based on explanatory data for 2020. Therefore, the uncertainty of building completeness estimates rises with increasing distance to 2020. This is not reflected in the confidence bands as this additional uncertainty is hard to quantify. Created using Matplotlib 3.6.2 in Python 3.10.6 (https://www.python.org/).
Fig. 2
Fig. 2. Spatial distribution of OSM building completeness in 13,189 urban centers.
For each class the overall number of urban centers is reported in the squared bracket. For an interactive web map visualization visit https://hex.ohsome.org/#/urban_building_completeness. OSM data as of 2023-01-01. Created using QGIS 3.28.3 (https://www.qgis.org/en/site/).
Fig. 3
Fig. 3. Nonspatial and spatial inequality measures of completeness.
Temporal evolution of (a) evenness and (b) clustering of urban OSM building completeness per world region. Moran’s I measures spatial autocorrelation, positive values indicate spatial clustering. Values for Moran’s I in practice often range between -0.5 and 1.15 with zero indicating absence of global spatial autocorrelation. OSM data from 2008-01-01 to 2023-01-01. Created using Matplotlib 3.6.2 in Python 3.10.6 (https://www.python.org/).
Fig. 4
Fig. 4. Local spatial autocorrelation of completeness.
A comparison at two points in time for urban centers within a, b Europe & Central Asia and c, d Sub-Saharan Africa. Each urban center was classified according to whether its building completeness value was above (high) or below (low) the global mean and if the weighted mean across its neighbors was above or below the global mean. Based on this, four quadrants are defined: high-high (HH), low-high (LH), low-low (LL) and high-low (HL). High-high describes clusters of high completeness values, low-low describes clusters of low completeness values while low-high and high-low indicate spatial outliers in the sense that the completeness value of the urban area was unexpected in their neighborhood. Significance levels were adjusted for multiple testing. For each region and point in time we provide the Gini coefficient (G) and Moran’s I for the region shown in the sub-plot. Created using QGIS 3.28.3 (https://www.qgis.org/en/site/).
Fig. 5
Fig. 5. Agglomerative clustering of urban centers based on OSM building completeness, Gini coefficient G and Moran’s I.
Each point represents a single urban center with a minimum area of 25 square kilometers. Smaller urban centers were ignored as Gini coefficient and Moran’s I could not be reliably estimated. For each of the clusters a single representative example was selected out of the 4,647 urban centers considered in this analysis. OSM data as of 2023-01-01. Created using Matplotlib 3.6.2 in Python 3.10.6 (https://www.python.org/).
Fig. 6
Fig. 6. Intra-urban OSM building completeness.
Spatial distribution for selected urban centers (af). For each urban center we report on overall OSM completeness c, Gini coefficient G and Moran’s I. Cell size is always one square kilometer for any urban center. The clusters are the same as in Fig. 5. The number of urban centers in each cluster is indicated in the dendrogram (b). For an interactive web map visualization visit https://hex.ohsome.org/#/urban_building_completeness. OSM data as of January 1, 2023. Created using QGIS 3.28.3 (https://www.qgis.org/en/site/) and Matplotlib 3.6.2 in Python 3.10.6 (https://www.python.org/).
Fig. 7
Fig. 7. Urban center level temporal evolution of OSM building completeness.
We report on completeness per cluster and for selected urban centers (ae). The clusters are the same as in Fig. 5. OSM data from January 1, 2008, to January 1, 2023. Created using Matplotlib 3.6.2 in Python 3.10.6 (https://www.python.org/).

References

    1. Sun L, Chen J, Li Q, Huang D. Dramatic uneven urbanization of large cities throughout the world in recent decades. Nat. Commun. 2020;11:5366. doi: 10.1038/s41467-020-19158-1. - DOI - PMC - PubMed
    1. Boo G, et al. High-resolution population estimation using household survey data and building footprints. Nat. Commun. 2022;13:1–10. doi: 10.1038/s41467-022-29094-x. - DOI - PMC - PubMed
    1. Hecht R, Kunze C, Hahmann S. Measuring Completeness of Building Footprints in OpenStreetMap over Space and Time. ISPRS Int. J. Geo-Inform. 2013;2:1066–1091. doi: 10.3390/ijgi2041066. - DOI
    1. Esch T, et al. World Settlement Footprint 3D - A first three-dimensional survey of the global building stock. Remote Sens. Environ. 2022;270:112877. doi: 10.1016/j.rse.2021.112877. - DOI
    1. Braunschweig, K., Eberius, J., Thiele, M. & Lehner, W. The State of Open Humanitarian Data. Tech. Rep. January (2020).