. 2023 Jul 6;14(1):4004.
doi: 10.1038/s41467-023-39662-4.

Detecting temporal and spatial malaria patterns from first antenatal care visits

Affiliations

Detecting temporal and spatial malaria patterns from first antenatal care visits

Arnau Pujol et al. Nat Commun. .

Abstract

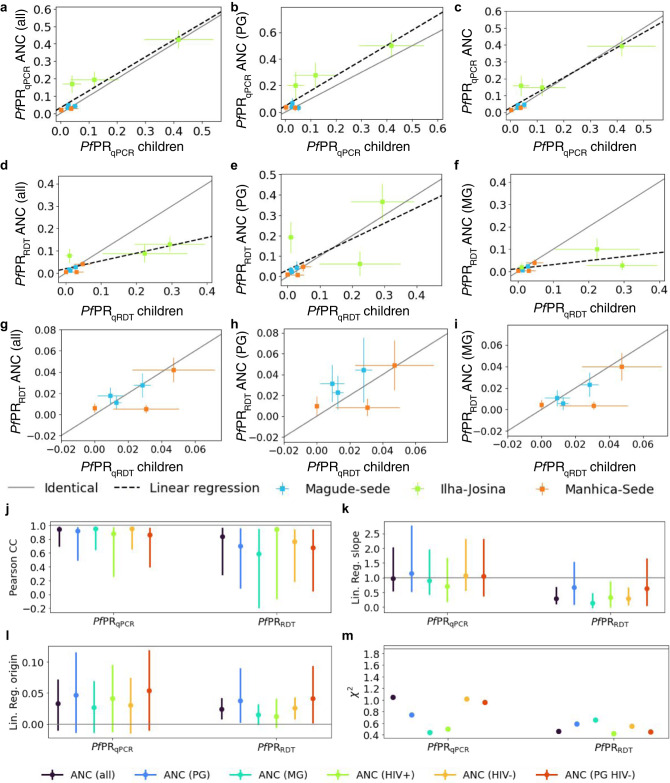
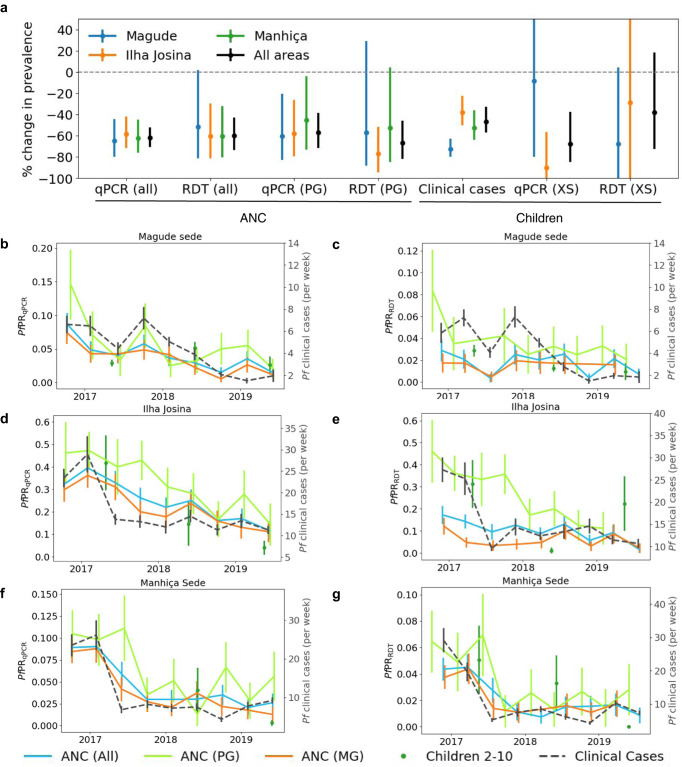
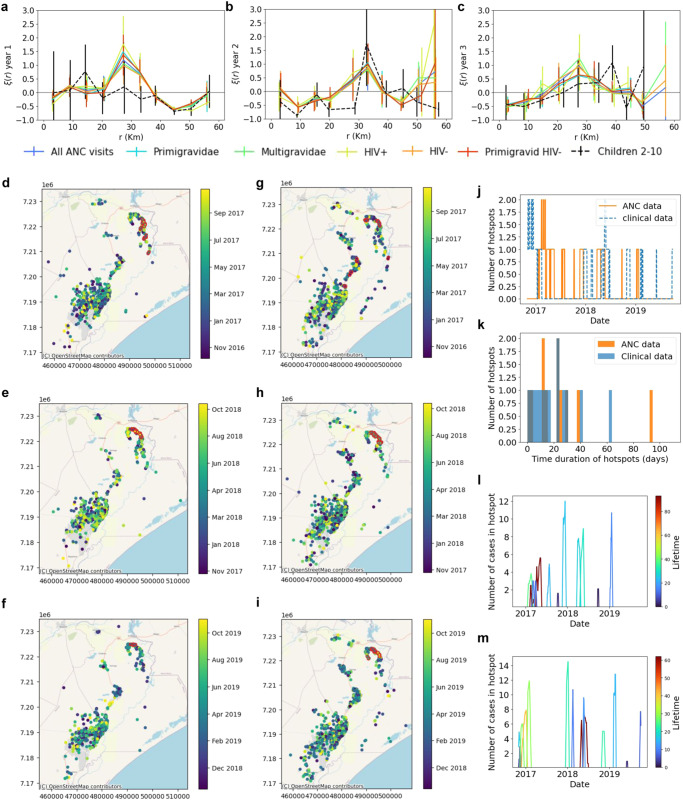
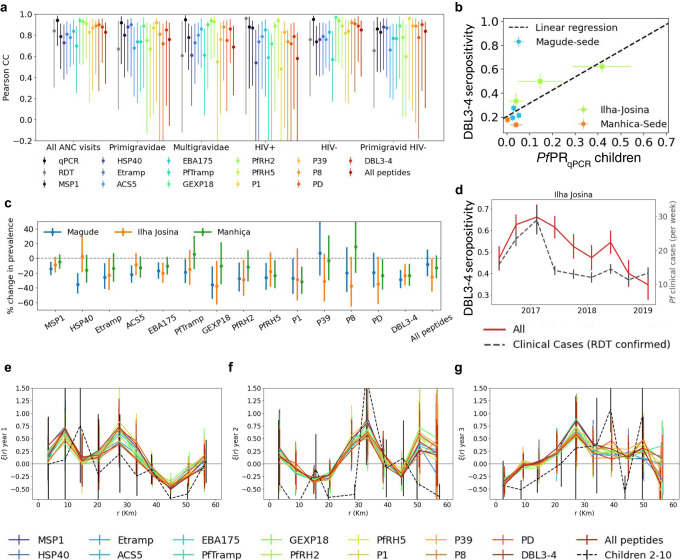
Pregnant women attending first antenatal care (ANC) visits represent a promising malaria surveillance target in Sub-Saharan Africa. We assessed the spatio-temporal relationship between malaria trends at ANC (n = 6471) and in children in the community (n = 3933) and at health facilities (n = 15,467) in southern Mozambique (2016-2019). ANC P. falciparum rates detected by quantitative polymerase chain reaction mirrored rates in children, regardless of gravidity and HIV status (Pearson correlation coefficient [PCC] > 0.8, χ²<1.1), with a 2-3 months lag. Only at rapid diagnostic test detection limits at moderate-to-high transmission, did multigravidae show lower rates than children (PCC = 0.61, 95%CI[-0.12-0.94]). Seroprevalence against the pregnancy-specific antigen VAR2CSA reflected declining malaria trends (PCC = 0.74, 95%CI[0.24-0.77]). 60% (9/15) of hotspots detected from health facility data (n = 6662) using a novel hotspot detector, EpiFRIenDs, were also identified with ANC data (n = 3616). Taken together, we show that ANC-based malaria surveillance offers contemporary information on temporal trends and geographic distribution of malaria burden in the community.


Conflict of interest statement

The authors declare no competing interests.

Figures

Fig. 1
Fig. 1. Relationship between Plasmodium falciparum parasite rates in pregnant women at first ANC visit and children from cross-sectional surveys.
Scatter comparison of PfPRqPCR (ac) and PfPRRDT (df) between children 2–10 years old (n = 3933) and a women attending a first ANC visit 90 days around the dates of cross-sectional surveys (n = 2016), b primigravid women (PG) (n = 602) and c multigravidae (MG) (n = 1414). gi Same as d–f but restricted to low transmission areas (Magude and Manhiça) (n = 3818, 1884, 530, 1354 for children 2–10 years old, all first ANC visits, PG and MG respectively). The three points with error bars of each colour represent the mean values for each of the three years of study ±SD. Grey lines in ai show the hypothetical one-to-one relationship, and the black dashed lines show the linear regressions. jm values of linear regression slopes and origin parameters, Pearson correlation coefficients and χ2 statistics of the relationships between pregnant women and children, with the error bars representing the 95%CI. The horizontal grey lines show the optimal scenario (jl) and the threshold of χ2 value for consistency (m).
Fig. 2
Fig. 2. Temporal trends in Plasmodium falciparum burden.
a Changes in prevalence of different Plasmodium falciparum burden indicators in the three areas (colours) and in total (black) (same sample sizes as for b–g). Error bars indicate the 95% CI. b–g Temporal trends in the number of weekly clinical cases (dashed grey lines) (n = 15,467 divided in the three areas), positivity rates in children 2–10 years old (n = 3933) from cross-sectional surveys (green dots), and in pregnant women at first ANC visit (coloured lines), for the three studied areas (from top to bottom) (n = 6471, 1754 and 4717 for all, PG and MG divided by the three areas). Panels a, c, e show estimates from qPCR results, and panels b, d, f show estimates using the detection limit of RDTs to define parasite rates. Time lags that maximise the Pearson correlation coefficients of the temporal trends between ANC data and clinical cases were applied (see Table 1). PG primigravid women, MG multigravid women, XS cross-sectional surveys. Data are presented as mean values ±SD.
Fig. 3
Fig. 3. Spatial clustering and hotspots of Plasmodium falciparum infections.
ac 2-point correlation functions of P. falciparum infections with geospatial data available in pregnant women at first ANC visit (different gravidity and HIV status shown in different colours) (n by year= 1971, 1613, 1465) and in children 2–10 years old (n by year= 1900, 1565, 468) from cross-sectional surveys (black dashed lines) for the three years and study areas, showing mean values ±SD. di Temporal variation of the spatial distribution of the households from pregnant women at first ANC visits (d for year 1, e for year 2 and f for year 3) and from children attending health facilities (g for year 1, h for year 2 and i for year 3) in Manhiça district (colour coded by their visit date). Cases circled in red belong to hotspots detected using temporal windows of one month. j Temporal distribution of the number of hotspots detected from ANC (orange) and from clinical (blue) data. k Histogram of lifetimes of identified hotspots from ANC (orange) and from clinical (blue) data. l, m Timeline of identified hotspots with their size (y-axis) and colour coded by their lifetime from ANC (l) and clinical malaria cases (m) data. Maps used OpenStreetMap data, available under the Open Database License.
Fig. 4
Fig. 4. Comparison of spatial and temporal trends in seropositive women at first antenatal care visit and Plasmodium falciparum infection in children.
a Pearson correlation coefficients between PfPRqPCR in children 2–10 years old (n = 3933) from cross-sectional surveys and seroprevalence in pregnant women at first ANC visits (n = 5990). Results are shown for different gravidity and HIV status groups from pregnant women (from left to right), and each colour represents a different antigen. Grey and black data points show the Pearson correlation coefficients between children and pregnant women for PfPRRDT and PfPRqPCR, respectively. b Scatter comparison between PfPRqPCR in children (x-axis) and VAR2CSADBL3-4 seropositivity from all pregnant women at first ANC visit. Black dashed line shows the linear regression. c Declines in seroprevalence between year 1 and year 3 for each antigen expressed as percentage of change. P-values were obtained from a Z-test of proportions. d Comparison of the temporal trends of VAR2CSADBL3-4 seroprevalence (red line) and weekly number of Plasmodium falciparum RDT passively detected cases from children (dashed black line) in Ilha Josina (n = 8985). e–g 2-point cross-correlation functions between seropositive cases of different antigens (represented by the different colours) (n by year= 1971, 1613, 1,465) using all first ANC visits and qPCR positivity in children 2–10 years old (n by year = 1900, 1565, 468) from cross-sectional surveys for the three years of study (eg). Black dashed lines show the 2-point correlation function of qPCR positivity in children. Data are presented as mean values, with errors representing the 95%CI in a and c, and the SD in b, dg.

Update of

References

    1. Ohrt C, et al. Information systems to support surveillance for malaria elimination. Am. J. Trop. Med. Hyg. 2015;93:145–152. doi: 10.4269/ajtmh.14-0257. - DOI - PMC - PubMed
    1. WHO. Malaria Surveillance, Monitoring And Evaluation: A Reference Manual. ix, 196 p. http://iris.paho.org/xmlui/handle/123456789/50648 (World Health Organization, 2018).
    1. Mayor A, Menendez C, Walker PGT. Targeting pregnant women for malaria surveillance. Trends Parasitol. 2019;35:677–686. doi: 10.1016/j.pt.2019.07.005. - DOI - PMC - PubMed
    1. Kwesigabo G, et al. Monitoring of HIV-1 infection prevalence and trends in the general population using pregnant women as a sentinel population: 9 years experience from the Kagera region of Tanzania. J. Acquir. Immune Defic. Syndr. 2000;23:410–417. doi: 10.1097/00126334-200004150-00008. - DOI - PubMed
    1. Korenromp EL, et al. Syphilis prevalence trends in adult women in 132 countries - estimations using the Spectrum Sexually Transmitted Infections model. Sci. Rep. 2018;8:11503. doi: 10.1038/s41598-018-29805-9. - DOI - PMC - PubMed

Publication types