. 2023 Jul;25(7):1017-1032.
doi: 10.1038/s41556-023-01167-z. Epub 2023 Jul 6.

Dynamic de novo heterochromatin assembly and disassembly at replication forks ensures fork stability

Affiliations

Dynamic de novo heterochromatin assembly and disassembly at replication forks ensures fork stability

Vincent Gaggioli et al. Nat Cell Biol. 2023 Jul.

Abstract

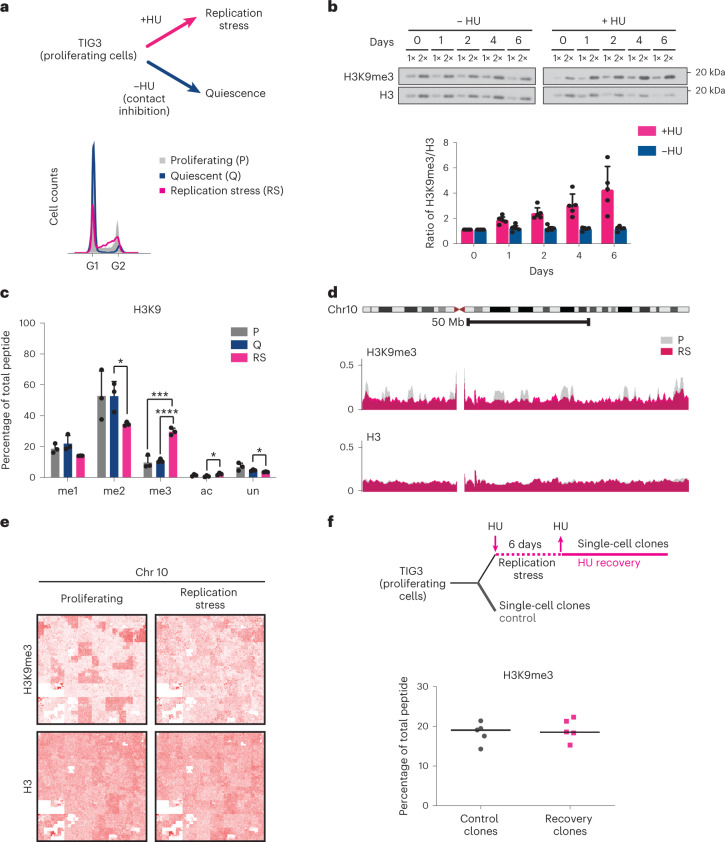
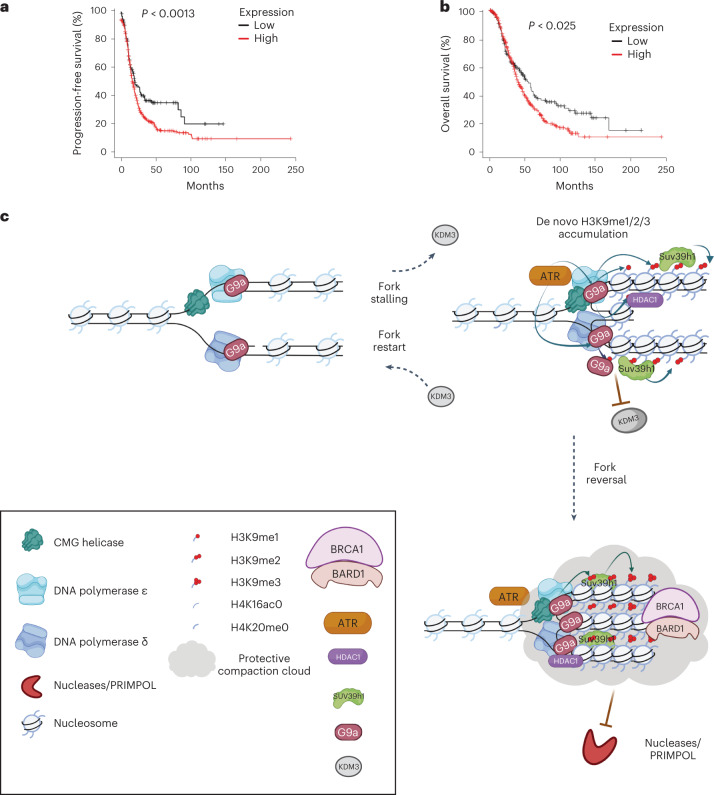
Chromatin is dynamically reorganized when DNA replication forks are challenged. However, the process of epigenetic reorganization and its implication for fork stability is poorly understood. Here we discover a checkpoint-regulated cascade of chromatin signalling that activates the histone methyltransferase EHMT2/G9a to catalyse heterochromatin assembly at stressed replication forks. Using biochemical and single molecule chromatin fibre approaches, we show that G9a together with SUV39h1 induces chromatin compaction by accumulating the repressive modifications, H3K9me1/me2/me3, in the vicinity of stressed replication forks. This closed conformation is also favoured by the G9a-dependent exclusion of the H3K9-demethylase JMJD1A/KDM3A, which facilitates heterochromatin disassembly upon fork restart. Untimely heterochromatin disassembly from stressed forks by KDM3A enables PRIMPOL access, triggering single-stranded DNA gap formation and sensitizing cells towards chemotherapeutic drugs. These findings may help in explaining chemotherapy resistance and poor prognosis observed in patients with cancer displaying elevated levels of G9a/H3K9me3.


Conflict of interest statement

A.G. is co-founder and CSO in Ankrin Therapeutics. N.T., V.G. and R.K. report an international patent filed under PCT/NL2023/050120 for ChromStretch technology. No other authors have competing interests.

Figures

Fig. 1
Fig. 1. Analysis of DNA replication and histone PTM dynamics under chronic replication stress condition.
a, Top: experimental design. TIG3 fibroblasts were cultured in the absence or presence of HU (600 μM) for at least 6 days, rendering cells quiescent due to contact inhibition or long-term exposed to replication stress, respectively. Bottom: cell cycle analysis of proliferating cells and cells treated with or without HU for 6 days. b, Top: time course analysis of H3K9me3 levels by immunoblotting on chromatin extracts from cells treated without (left) or with (right) HU for the indicated time. Representative western blots of five independent experiments. Histone H3 was used as a loading control for chromatin. Bottom, quantification of H3K9me3 levels relative to total H3 in chromatin extracts analysed by western blot. The graphs show the average n = 5 biological replicates with error bars indicating standard deviation. c, Analysis of H3K9 modification by mass spectrometry. Quantification of modifications on the H3 peptide (amino acids 9–17) in proliferating (grey), quiescent (blue) and HU-treated (pink) TIG3 cells. The graph shows the average of three biological replicates with error bars indicating standard deviation. Unpaired two-sided t-test: ****P < 0.0001; ***P < 0.001; *P < 0.05. For full histone PTM analysis, see Extended Data Fig. 1f. d, Overlay of ChIP–seq profiles at chromosome 10 for H3K9me3 and H3 in proliferating (P) and HU-treated cells (RS). e, Visualization of chromosome-wide profiles of ChIP–seq data for H3K9me3 and total H3 using Hilbert curves. See also Extended Data Fig. 2a. f, Analysis of H3K9me3 by mass spectrometry after recovery from HU. Top: experimental setup. Single-cell clones were derived from proliferating cells (control, grey) or cells allowed to recover after persistent replication stress (HU recovery, pink). Bottom: analysis by quantitative mass spectrometry. The lines represent the medians from n = 5 single-cell clones. For full histone PTM analysis, see Extended Data Fig. 2c. Source data
Fig. 2
Fig. 2. De novo H3K9me3 accumulates at stalled replication forks in a G9a-dependent manner.
a, The distributions of active replication sites (red) and H3K9me3 (green) were compared using super-resolution microscopy. Left: representative STED images of untreated (UT) and HU treated (HU) nuclei. Middle: representative intensity profile of the EdU signal (red) and H3K9me3 signal (green) extracted from STED images (left). Right: 3D reconstruction of untreated (UT) and HU treated (HU) nuclei imaged using STED microscopy and illustrating the accumulation of H3K9me3 at replication sites (yellow) upon HU treatment. n = 5 cells examined per condition over two independent experiments with similar results. b, Top: representative image of chromatin fibres acquired by ChromStretch in the absence of HU treatment (left) or after HU treatment (right) and stained for EdU (red), H3K9me3 (green) and H3 (blue). Bottom: intensity profiles of EdU (red), H3K9me3 (green) and H3 (blue) of the representative fibres indicated by the black arrows, in the absence (left) or after HU treatment (right). n = 10 fibres examined per condition over two independent experiments with similar results. c, Analysis of the dynamics of H3K9me3 at replication sites upon replication stress using ChromStretch. Top, experimental design: Cells were first labelled for 20 min with EdU and treated with 1 mM HU for the indicated amount of time. Bottom: quantification of H3K9me3 signal overlapping with EdU (nUT = 106, nHU10 = 100, nHU20 = 104, nHU30 = 104, nHU60 = 104 EdU tracks were analysed; ****P ≤ 0.0001, *P ≤ 0.05, NS, non-significant, Kruskal–Wallis test followed by Dunn’s test). d, Analysis of the dynamics of H3K9me3 at replication sites after release from replication stress using ChromStretch. Left: experimental design. Cells were first treated with 1 mM HU for 1 h and released in medium without HU. At the indicated time post release, cells were labelled with EdU for 20 min. Single chromatin molecule was isolated using ChromStretch. Right: quantification of H3K9me3 signal at individual (n) replication sites (nUT = 100, nHU = 111, nrel20 = 120, nrel30 = 100, nrel45 = 127, nrel60 = 118 EdU tracks were analysed; ****P ≤ 0.0001, NS, non-significant, Kruskal–Wallis test followed by Dunn’s test). e, Quantification of H3K9me1 (left), H3K9me2 (middle) and H3K9me3 (right) at replication sites in the presence or in the absence of G9a activity (UNC0642 – and +, respectively) both at ongoing (UT) and stressed (HU) replication forks using ChromStretch. The number of replication tracks analysed was: for H3K9me1(left): nUT− = 107, nUT+ = 106, nHU− = 131, nHU+ = 101; H3K9me2 (middle): nUT− = 73, nUT+ = 51, nHU− = 55, nHU+ = 88; H3K9me3 (right): nUT− = 67, nUT+ = 68, nHU− = 123, nHU+ = 94 EdU tracks were analysed; ****P ≤ 0.0001, NS, non-significant, Kruskal–Wallis test followed by Dunn’s test). Source numerical data are available in Source Data. Source data
Fig. 3
Fig. 3. H3K9me3, G9a and Suv39h1 accumulation at stalled replication forks is replication checkpoint dependent and results in chromatin compaction.
a, Left: representative images of PLA depicting H3K9me3 presence at replication sites (H3K9me3-EdU PLA, red). Nuclei were counterstained with DAPI (blue). Right: distribution of the total intensity of all H3K9me3-EdU PLA spots per nucleus in wild-type cells (WT), G9a knockout cells (G9a−/−) and wild-type cells treated with 1 µM UNC0642 (UNC0642). Cells were labelled with EdU for 20 min and were either left untreated (UT), treated with 1 mM HU for 1 h (HU) or treated with 1 mM HU for 1 h and released from HU for 25 min and labelled with EdU for 20 min (Rel). (nWT-UT = 2,436, nWT-HU = 2,212, nWT-REL = 2,340, nG9aKO-UT = 1,038, nG9aKO-HU = 1,168, nG9aKO-REL = 1,074, nUNC0642-UT = 2,413, nUNC0642-HU = 2,328, nUNC0642-REL = 2,315 cells analysed). bd, Same as a but showing the distribution of PLA spot intensity per nucleus for H3K9me1-EdU PLA (nWT-UT = 1,346, nWT-HU = 1,050, nWT-REL = 1,192, nG9aKO-UT = 1,543, nG9aKO-HU = 1,470, nG9aKO-REL = 1,630, nUNC0642-UT = 1,502, nUNC0642-HU = 1,296, nUNC0642-REL = 1,338 cells analysed) (b), H3K9me2-EdU PLA (nWT-UT = 1,442, nWT-HU = 1,431, nWT-REL = 1,338, nG9aKO-UT = 1,321, nG9aKO-HU = 1,381, nG9aKO-REL = 1,380, nUNC0642-UT = 1,367, nUNC0642-HU = 1,490, nUNC0642-REL = 1,411 cells analysed) (c) and G9a-EdU PLA (nWT-UT = 1,407, nWT-HU = 1,086, nWT-REL = 1,502, nG9aKO-UT = 1,510, nG9aKO-HU = 1,513, nG9aKO-REL = 1,510, nUNC0642-UT = 1,504, nUNC0642-HU = 1,505, nUNC0642-REL = 1,501 cells analysed) (d). e, Distribution of H3K9me3-EdU (left) or G9a-EdU (right) total PLA spot intensity per nucleus of wild-type cells treated (ATRi+) or not (ATRi−) with 10 µM ATR inhibitor and EdU labelled for 20 min followed by a 1 mM HU treatment for 1 h. For H3K9me3-EdU PLA: nHU− = 909, nHU+ = 931; for G9a-EdU PLA: nHU− = 869, nHU+ = 1,080 cells analysed. f, Same as a but showing the distribution of H3K9me3-EdU total PLA spot intensity per nucleus for the indicated conditions (nctl-UT = 1,509, nctl-HU = 1,509, nctl-REL = 1,506, nUNC0642-UT = 2,003, nUNC0642-HU = 1,529, nUNC0642-REL = 1,543, nsiSUV39h1-UT = 1,514, nsiSUV39h1-HU = 1,502, nsiSUV39h1-REL = 1,500, nUNC0642+siSUV39h1-UT = 1,502, nUNC0642+siSUV39h1-HU = 1,523, nUNC0642+siSUV39h1-REL = 1,507, cells analysed) (note that, for af, blue dashed indicates mean of the distribution, ****P ≤ 0.0001, ***P ≤ 0.001, **P ≤ 0.01, *P ≤ 0.05, NS, non-significant, one-way analysis of variance Kruskal–Wallis test followed by Dunn’s test is used for all statistical analysis). g, Model summarizing G9a and SUV39h1 role at stalled replication forks. Upon replication stress, checkpoint-regulated G9a activity at stressed replication forks results in transient accumulation of H3K9me1/2 allowing SUV39h1 to catalyse H3K9me3 modification. Further accumulating HDAC1 resulted in the loss of H4K16ac. Figure created with biorender.com. h, Representative images of the changes over time of a stripe of photo-activated GFP-H2A for the indicated conditions. This experiment was reproduced independently three times with similar results. i, Mean photo-activated GFP-H2A area over time relative to the area at T = 0 min in percentage ± standard deviation. In PCNA negative (black) and positive (red) for untreated cell: WT-UT (left), cells undergoing replication stress: WT + HU (middle) and cells undergoing replication stress in the absence of G9a activity (right). Unpaired two-sided t-test, ****P ≤ 0.0001, **P ≤ 0.01. For experimental design, see Extended Data Fig. 5e. n = 3 independent experiments. Source numerical data are available in Source Data. Source data
Fig. 4
Fig. 4. Loss of transiently accumulated H3K9me drastically alters the chromatin landscape of stalled forks.
a, Colour-coded diagram showing a selection of proteins enriched (shades of green) or depleted (shades of red) at stalled replication fork in the absence of G9a activity. Proteins were considered enriched when the log2 ratio of HU + G9a inhibition/HU was greater than 0.2 and depleted when the log2 ratio of HU + G9a inhibition/HU was lower than −0.2. bd, Dynamics of BARD1 (b), BRCA1 (c) and RAD51 (d), at replication sites in the presence (WT) and in the absence of G9a activity (UNC0642). The plots are showing the distribution of PLA spots intensity per nucleus in either unperturbed (UT), stalled (HU) and restarted (Rel) replication. BARD1-EdU (nWT-UT = 1,648, nWT-HU = 2,008, nWT-REL = 2,022, nUNC0642-UT = 2,004, nUNC0642-HU = 2,008, nUNC0642-REL = 2,002 cells analysed) (b), BRCA1-EdU (nWT-UT = 1,502, nWT-HU = 1,508, nWT-REL = 1,510, nUNC0642-UT = 1,511, nUNC0642-HU = 1,521, nUNC0642-REL = 1,505 cells analysed) (c) or RAD51-EdU (nWT-UT = 1,511, nWT-HU = 1,510, nWT-REL = 1,503, nUNC0642-UT = 1,521, nUNC0642-HU = 1,502, nUNC0642-REL = 1,505 cells analysed) (d). Cells were labelled with EdU for 20 min and were either left untreated (UT) or treated with 1 mM HU for 1 h (HU) or treated with 1 mM HU for 1 h and released from HU for 25 min and labelled with EdU for 20 min (Rel). e, Dynamics of H3K9me3 at replication sites in the presence (DMSO) and in the absence of G9a activity (UNC0642) as well as in the presence (siCTL) or absence of SMARCAL1 (siSMARCAL1). Plots showing distribution of H3K9me3-EdU PLA spots intensity per nucleus in either unperturbed (UT), stalled (HU) and restarted (Rel) replication. Cells were labelled with EdU for 20 min and were either left untreated (UT) or treated with 1 mM HU for 1 h (HU) or treated with 1 mM HU for 1 h and released from HU for 25 min and labelled with EdU for 20 min (Rel). It is interesting to note that transient accumulation of H3K9me3 at replication sites upon replication stress is independent of fork reversal activity. nsiCTL-UT = 1,338, nsiCTL-HU = 1,337, nsiCTL-REL = 1,339, nsiCTL+UNC0642-UT = 1,341, nsiCTL+UNC0642-HU = 1,138, nsiCTL+UNC0642-REL = 1,343, nsiSMARCAL1-UT = 1,339, nsiSMARCAL1-HU = 1,342, nsiSMARCAL1-REL = 747, nsiSMARCAL1+UNC0642-UT = 1,341, nsiSMARCAL1+UNC0642-HU = 1,340, nsiSMARCAL1+UNC0642-REL = 1,338 cells analysed; blue dashed line represents the mean of the distribution, ****P ≤ 0.0001, ***P ≤ 0.001, **P ≤ 0.01, *P ≤ 0.05, NS, non-significant, Kruskal–Wallis test followed by Dunn’s test is used for all statistical analysis. Source numerical data are available in Source Data. Source data
Fig. 5
Fig. 5. Loss of transient H3K9me3 accumulation at stalled forks impairs replication fork stability and causes genome instability.
a, Top: schematic of replication fork degradation assay with CldU and IdU labelling. Bottom: ratio of IdU to CldU tract length was plotted for the indicated conditions. (nsiCTL = 207, nsiBRCA1 = 214, nsiSUV39h1 = 213, nsiCTL+UNC0642 = 207, nsiBRCA1+UNC0642 = 239, nsiSUV39h1+UNC0642 = 203 replication tracks analysed; ****P ≤ 0.0001, NS, non-significant, Kruskal–Wallis test followed by Dunn’s test). b, Top: schematic of the fork restart assay. Bottom: the IdU track length (µm) was plotted to show fork restart (nWT = 150, nUNC0642 = 150, nG9aKO = 150; ****P ≤ 0.0001, NS, non-significant, Kruskal–Wallis test followed by Dunn’s test). c, Top: schematics of ssDNA gap accumulation. Bottom: the IdU track length (µm) was plotted to assess the accumulation of ssDNA behind the forks for the indicated conditions (nWT_S1− = 151, nUNC0642_S1− = 157, nG9aKO_S1− = 151, nWT_S1+ = 153, nUNC0642_S1+ = 153, nG9aKO_S1+ = 153 replication tracks analysed; ****P ≤ 0.0001, ***P ≤ 0.001, **P ≤ 0.01, NS, non-significant, Kruskal–Wallis test followed by Dunn’s test). Source numerical data are available in Source Data. Source data
Fig. 6
Fig. 6. Loss of KDM3A rescues fork degradation, ssDNA gap accumulation and drug sensitivity of cells lacking G9a activity.
a, Top: schematics of ssDNA gap accumulation. Bottom: IdU track length (µm) distribution for the indicated conditions. n = 100 replication forks analysed per condition (nsiCTL_S1− = 206, nsiPRIMPOL_S1− = 91, nsiKDM3_S1− = 206, nsiCTL+UNC0642_S1− = 201, nsiPRIMPOL+UNC0642_S1− = 202, nsiKDM3+UNC0642_S1− = 201, nsiCTL_S1+ = 206, nsiPRIMPOL_S1+ = 206, nsiKDM3_S1+ = 209, nsiCTL+UNC0642_S1+ = 209, nsiPRIMPOL+UNC0642_S1+ = 203, nsiKDM3+UNC0642_S1+ = 205, replication tracks analysed; ****P ≤ 0.0001, ***P ≤ 0.001, **P ≤ 0.01, NS, non-significant, Kruskal–Wallis test followed by Dunn’s test). b, Top: schematics of the Fork restart assay. Bottom: IdU track length (µm) distribution (nsiCTL = 650, nsiPRIMPOL = 376, nsiKDM3 = 316, nsiCTL+UNC0642 = 502, nsiPRIMPOL+UNC0642 = 369, nsiKDM3+UNC0642 = 302 replication tracks analysed; ****P ≤ 0.0001, ***P ≤ 0.001,**P ≤ 0.01, *P ≤ 0.05, NS, non-significant, Kruskal–Wallis test followed by Dunn’s test). c, Fork degradation performed as Fig. 5a. Ratio of IdU to CldU tract length was plotted for the indicated conditions (nsiCTL = 161, nsiBRCA1 = 164, nsiKDM3 = 161, nsiCTL+UNC0642 = 162, nsiBRCA1+UNC0642 = 163, nsiKDM3+UNC0642 = 176 replication tracks analysed; ****P ≤ 0.0001, NS, non-significant, Kruskal–Wallis test followed by Dunn’s test). d, Dynamics of H3K9me3 at replication sites in the presence (DMSO) or in the absence of G9a activity (UNC0642) and in the presence (siCTL) or absence of KDM3A (siKDM3). Distribution of H3K9me3-EdU PLA spots intensity per nucleus upon unperturbed (UT), stressed (HU) and restarted (Rel) replication. Cells were labelled with EdU for 20 min and were either left untreated (UT) or treated with 1 mM HU for 1 h or treated with 1 mM HU for 1 h and released for 25 min before labelling with EdU for 20 min (Rel). Blue dashed indicates mean of the distribution, nsiCTL-UT = 1,509, nsiCTL-HU = 1,509, nsiCTL-REL = 1,506, nsiCTL+UNC0642-UT = 2,003, nsiCTL+UNC0642-HU = 1,529, nsiCTL+UNC0642-REL = 1,543, nsiKDM3-UT = 1,516, nsiKDM3-HU = 1,504, nsiKDM3-REL = 1,524, nsiKDM3+UNC0642-UT = 1,505, nsiKDM3+UNC0642-HU = 1,536, nsiKDM3+UNC0642-REL = 1,514 cells analysed; ****P ≤ 0.0001, ***P ≤ 0.001, **P ≤ 0.01, *P ≤ 0.05, NS, non-significant, Kruskal–Wallis test followed by Dunn’s test is used for all statistical analysis. e,f, Colony survival assay. Mean survival in wild type (WT) and cells lacking G9a (G9a−/−), in the presence (siCTL) or absence of KDM3A (siKDM3) and treated with different concentrations of olaparib (PARPi, e) or cisplatin (f). Data are normalized to the 0 dose of the corresponding condition. Error bars represent ± standard deviation (n = 3 independent experiment) (****P ≤ 0.0001, **P ≤ 0.01, NS, non-significant, ordinary two-way analysis of variance was used for multiple comparisons). Source numerical data are available in Source Data. Source data
Fig. 7
Fig. 7. G9a overexpression correlates with poor prognosis in ovarian cancer, highlighting the importance of a timely accumulation of de novo H3K9me1/2/3 marks and its disassembly catalysed by ‘writers’ and ‘erasers’ at stressed replication forks to maintain fork stability.
a,b, Combined mean expression was calculated to distinguish TCGA patients with ovarian cancer with low or high GLP/G9a expression,,. Kaplan–Meier curves were generated against progression-free survival (a) and overall patient survival (b) (n = 614 patients). P values were calculated with the use of a two-sided log-rank test. c, G9a/EHMT2 associated with replication forks is activated by canonical DNA replication checkpoint pathway to catalyse H3K9me1/me2 at replication forks upon replication stress. Activated G9a generates a platform of H3K9me1/me2/me3 in concert with Suv39h1 at the site of stressed replication forks, which subsequently recruits histone deacetylase, HDAC1 to deacetylate the nucleosomes. Such closed chromatin conformation may create a protective compaction bubble that protects replication forks by (1) promoting efficient recruitment of fork protection factors, BARD1-BRCA1; and (2) such a conformation may also prevent the access to DNA nucleases and other detrimental factors, such as PRIMPOL that can lead to accumulation of ssDNA gaps behind the replication forks. Furthermore, synergistic activity of G9a and Suv39h1 further prevents the substrate, H3K9me1/me2 nucleosomes, availability to H3K9-demethylase, JMJD1A/KDM3A, timely assembly of which facilitates the disassembly of heterochromatin to promote their fork restart. Figure created with biorender.com. Source numerical data are available in Source Data.
Extended Data Fig. 1
Extended Data Fig. 1. Extended Data Figure. 1 related to Fig. 1. H3K9me3 accumulates in cancer cells and upon persistent replication stress condition.
(a) Bar chart representing global chromatin profiling for enrichment of deacetylated H3K9me1/K14ac0 (red), H3K9me2/K14ac0 (green) and H3K9me3/K14ac0 (purple) epigenetic marks in >40 different ovarian cancer cell lines (the name of each cell line is indicated on the x axis) were analyzed from CCLE database 23. For each chromatin mark, the fold change relative to median value of the respective ovarian cancer cell lines is shown. (b) Analysis of S phase cells undergoing active replication. Cells were pulse-labeled with BrdU for 45 min at the indicated time. BrdU incorporating fractions of S-phase cells were determined by flow cytometry. The percentages of BrdU positive cells are indicated as the mean +/- SD of three independent experiments. (c) Immunoblot analysis of DNA damage and checkpoint signaling. Phosphorylated histone H2AX (γH2A.X), Ser317-phosphorylated Chk1 (Chk1p) and Ser15-phosphorylated p53 (p53-S15p). This experiment was reproduced independently three times with similar results. (d) Persistent replication stress induces senescence, as demonstrated by high senescence-associated-β-galactosidase (SA-β-Gal) activity. TIG3 cells expressing the oncogene B-RAF (OIS: Oncogene induced senescence) were used as positive control for the presence of SA-β-Gal positive cells. This experiment was reproduced independently three times with similar results. (e) Analysis of mitotic cells. Histone H3 serine 10 phosphorylation (H3S10p) was analyzed by flow cytometry of TIG3 cells treated as indicated. The percentages of H3S10p positive cells are indicated as the mean +/- SD of three independent experiments. (f) Analysis of histone PTM levels in proliferating (grey), quiescent (blue) and HU-treated (pink) TIG3 fibroblasts. The graph show the average of three biological replicates with error bars indicating SD. Unpaired two-sided t-test: (****) P < 0.0001; (***) P < 0.001; (**) P < 0.01; (*) P < 0.05. Source numerical data and unprocessed blots are available in source data. Source data
Extended Data Fig. 2
Extended Data Fig. 2. Extended Data Figure. 2 related to Fig. 1. Profiling of histone PTMs by quantitative mass spectrometry upon recovery from replication stress.
(a) Chromosome-wide profiles of ChIP-seq data for H3K9me3 and total H3 visualized Hilbert curves. Profiles for chromosomes 1, 7 for proliferating (P), quiescent (Q) and HU-treated (RS) cells in two biological replicates are shown. (b) Experimental design (top). TIG3 cells were treated for 6 days with 600 μM HU and allowed to recover for 9 days after removal of the drug (+HU/R) or cultured in the absence of HU for the whole period (-HU). Analysis of cell proliferation by high-content live-cell imaging (bottom). The graphs show the mean confluence (%) +range from two technical replicates and are representative of two independent biological replicates. (c) Analysis by quantitative mass spectrometry of histone PTMs in single cell clones derived from proliferating cells (control) or cells allowed to recover after persistent replication stress (HU recovery). Five clones were analyzed for each condition. The graphs show the average of three technical replicates with error bars indicating SD. Source data
Extended Data Fig. 3
Extended Data Fig. 3. Extended Data Figure. 3 related to Fig. 2. Single molecule analysis of H3K9me3 accumulation at stressed replication forks.
(a, b) Left, representative chromatin fibers in the absence of treatment (a) and after a 1 hr incubation in the presence of 1 mM HU (b). Right, intensity profiles of the each representative fibers. The intensity profiles of EdU (red), H3K9me3 (green) and H3 (blue) have been plotted. These experiments were reproduced independently 3 times with similar outcomes. (c) Correlation analysis of H3K9me3 and H3 at EdU spot is shown both for untreated (left) and for cells treated with 1 mM HU for 1 hr (right). R2 indicate the correlation coefficient between H3K9me3 and H3 intensity distribution. (d) Analysis of ChromStretch fibers. Quantification of the intensity of H3, H3K9me3 and EdU both at ongoing (UT) and stalled (HU) replication forks. (nUT = 106, nHU = 104 individual replication tracks analyzed; **** = P ≤ 0.0001, ns = non-significant, One-way ANOVA). Source numerical data are available in source data. Source data
Extended Data Fig. 4
Extended Data Fig. 4. Extended Data Figure. 4 related to Fig. 2. Transient accumulation of H3K9me and G9a at stalled replication forks is dependent upon checkpoint activation.
(af) ChromStretch analysis assessing: (a) Dynamics of H3K9me3 at replication sites at ongoing (UT) and stalled (HU) replication forks. Mean ± SD percentage of colocalization of H3K9me3 and EdU is shown as a bar plot. (n = 3 independent experiments). (b) Dynamics of H3K9me2 at replication sites upon replication stress. For experimental design see Fig. 2c. Quantification of H3K9me2 at EdU sites for the indicated conditions. (nUT= 132, nHU10 = 74, nHU20 = 140, nHU30 = 75, nHU60 = 86; **** = P ≤ 0.0001, ** = P ≤ 0.01, Kruskal-Wallis test followed by Dunn’s test). (c) Dynamics of H3K9me2 at replication sites after release from replication stress. For experimental design see Fig. 2d. Quantification of H3K9me2 at EdU sites for the indicated conditions. (nUT= 100, nHU = 92, nrel30 = 92, nrel60 = 93; **** = P ≤ 0.0001, Kruskal-Wallis test followed by Dunn’s test). (df) Dynamics of H3K9 PTM at replication sites in the presence (UNC0642-) or in the absence of G9a activity (UNC0642+) at ongoing (UT) and stalled (HU) replication forks. Bar plot of the mean of the percentages of H3K9me1 (d), H3K9me2 (e), H3K9me3 (f) colocalization with EdU. (n = 2 independent experiments). (g) Top: Schematic representation of the G9a isoform A. Exon1 was targeted using CRISPR/Cas9 to generate a G9a knock-out. UNC0642 binds G9a SET domain preventing G9a catalytic activity. Bottom: Immunoblot showing G9a levels in wild type cells (WT), wild type where G9a activity was inhibited with UNC0642 (WT + UNC0642) for 2hrs and a G9a knockout clone (G9a-/-). Tubulin is used as a loading control. (h) Top: Cell cycle profile of the indicated cells. Bottom: Mean percentage of cells in various phases of the cell cycle ± standard deviation from 3 independent experiments. (ns = non-significant, One-way ANOVA). (i) Immunoblot showing pCHK1 levels in wild type cells (WT), wild type where G9a activity was inhibited with UNC0642 (WT + UNC0642) and a G9a knock out clone (G9a-/-), in the presence or in the absence of replication stress. CHK1 is used as a loading control. This experiment was reproduced independently three times with similar results. Source numerical data and unprocessed blots are available in source data. Source data
Extended Data Fig. 5
Extended Data Fig. 5. Extended Data Figure. 5 related to Fig. 3. Recruitment of HDAC1 and H4K16 deacetylation at stalled replication forks is H3K9me dependent.
(a) Plot showing distribution of H3K9me3-EdU total PLA spot intensity per nucleus for the indicated conditions. (nsiCTL-UT = 925, nsiCTL-HU = 951, nsiCTL-REL = 990, nsiSETDB1-UT = 1071, nsiSETDB1-HU = 1040, nsiSETDB1-REL = 1138 cells analyzed; blue dashed line represents the mean of the distribution, **** = P ≤ 0.0001, * = P ≤ 0.05, ns = non-significant, Kruskal-Wallis test followed by Dunn’s test). (b) Analysis of ChromStretch fibers to assess the dynamics of H3K9me1 at replication upon replication stress. Quantification of H3K9me1 signal overlapping with EdU for the indicated condition. The signal is represented as a fold increase compared to the mean H3K9me1 signal of the untreated condition. (nsiCTL-UT = 100, nsiCTL-HU = 100, nsiSUV39h1-UT = 132, nsiSUV39h1-HU = 100, nsiSUV39h1+UNC0642-UT = 87, nsiSUV39h1+UNC0642-HU = 100 cells analyzed; **** = P ≤ 0.0001, ns = non-significant, Kruskal-Wallis test followed by Dunn’s test). (c) Plot showing distribution of HDAC1-EdU total PLA spot intensity per nucleus for the indicated conditions. (nWT-UT = 1691, nWT-HU = 1871, nWT-REL = 1771, nUNC0642-UT = 1534, nUNC0642-HU = 1798, nUNC0642-REL = 1652 cells analyzed; blue dashed line represents the mean of the distribution, **** = P ≤ 0.0001, ** = P ≤ 0.01,Kruskal-Wallis test followed by Dunn’s test). (d) Plot showing distribution of H4K16ac-EdU total PLA spot intensity per nucleus for the indicated conditions. (nWT-UT = 1507, nWT-HU = 1254, nWT-REL = 1489, nUNC0642-UT = 1187, nUNC0642-HU = 1488, nUNC0642-REL = 1365 cells analyzed; **** = P ≤ 0.0001, ** = P ≤ 0.01, * = P ≤ 0.05, ns = non-significant, Kruskal-Wallis test followed by Dunn’s test). (e) Chromatin compaction can be followed in replicating (PCNA positive) and non-replicating (PCNA negative) cells in which a stripe of photo-activable GFP-H2A has been activated. Adding HU and/or UNC0642 immediately after the activation of GFP-H2A allow to measure over time the impact of these drugs on chromatin compaction. Figure created with biorender.com. Source numerical data are available in source data. Source data
Extended Data Fig. 6
Extended Data Fig. 6. Extended Data Figure. 6 related to Fig. 4. Chromatin landscape of active replication forks remains unaltered in absence of G9a activity.
(a) Schematic representation of the iPOND-SILAC-MS experiment comparing the protein present at replication fork when G9a is active (DMSO) vs when G9a is inactive (+UNC0642). This comparison was done at stalled replication fork (Fig.4a) or ongoing replication fork (Extended Data Fig. 6b). (b) Diagram showing a selection of the protein that are enriched (shades of green) or depleted (shades of red) at ongoing replication fork in the absence of G9a activity. Proteins considered enriched when log2 (ratio of UT + G9a inhibition/UT) ≥ 0.2. Proteins considered depleted when log2 (ratio of UT+G9a inhibition/UT) ≤ - 0.2. (c) Distribution of H2AK15Ub-EdU total PLA spot intensity per nucleus assessing the level of H2AK15Ub at replication sites for the indicated conditions. (nWT-UT = 1337, nWT-HU = 1312, nWT-REL = 1370, nUNC0642-UT = 308, nUNC0642-HU = 1408, nUNC0642-REL = 1426 cells analyzed; blue dashed line = mean of the distribution, **** = P ≤ 0.0001, ** = P ≤ 0.01, ns = non-significant, Kruskal-Wallis test followed by Dunn’s test). (d) Distribution of H4K20me0-EdU total PLA spot intensity per nucleus assessing the level of H4K20me0 at replication sites for the indicated conditions. (nWT-UT = 1504, nWT-HU = 1400, nWT-REL = 1374, nUNC0642-UT = 1358, nUNC0642-HU = 1096, nUNC0642-REL = 1210 cells analyzed; blue dashed line = mean of the distribution, **** = P ≤ 0.0001, * = P ≤ 0.05, ns = non-significant, Kruskal-Wallis test followed by Dunn’s test). (e) Fold change in transcript levels of dysregulated genes (red) and DNA damage repair (DDR) genes (blue) in wild type cells treated with UNC0642 normalized to untreated wild type cells. Left: In the absence of replication stress. Right: In the presence of replication stress (1 mM HU 1 hr), N = number of genes, unpaired two-sided t-test. (f) Distribution of PCNA-EdU total PLA spot intensity per nucleus assessing the level of PCNA at replication sites for the indicated conditions. (nWT-UT = 732, nWT-HU = 628, nWT-REL = 391, nUNC0642-UT = 723, nUNC0642-HU = 763, nUNC0642-REL = 688 cells analyzed; blue dashed line = mean of the distribution, **** = P ≤ 0.0001, * = P ≤ 0.05, ns = non-significant, Kruskal-Wallis test followed by Dunn’s test). (g) Distribution of RPA-EdU total PLA spot intensity per nucleus assessing the level of RPA at replication sites for the indicated conditions. (nWT-UT = 1344, nWT-HU = 1437, nWT-REL = 1352, nUNC0642-UT = 965, nUNC0642-HU = 793, nUNC0642-REL = 514 cells analyzed; blue dashed line = mean of the distribution, **** = P ≤ 0.0001, * = P ≤ 0.05, ns = non-significant, Kruskal-Wallis test followed by Dunn’s test). Source numerical data are available in source data. Source data
Extended Data Fig. 7
Extended Data Fig. 7. Extended Data Figure. 7 related to Fig. 5. Loss of G9 activity causes genome instability.
(a) Representative image of a combed DNA molecule labelled with CldU and IdU. This experiment was independently reproduced two times with similar results. (b) Bar chart showing the number of origin of replication per megabase (Mb) of DNA analyzed in the indicated conditions. (c) Bar chart showing the average inter-origin distance in kilobase (Kb) in the indicated conditions. (d) Plot showing the distribution of CldU track length in Kb in the indicated conditions. Mean ± SD of the track length distribution is shown. (nWT= 55, nG9aKO = 69, nUNC0642 = 65 CldU tracks; **** = P ≤ 0.0001, ***= P ≤ 0.001, ns = non-significant, One-way ANOVA Kruskal-Wallis test followed by Dunn’s test). (ad) This experiment was independently reproduced two times with similar results. (e) Top panel: Schematic of replication fork progression assay using CldU and IdU labeling. Bottom panel: CldU (red) and IdU (green) track length (µm) distribution for the indicated conditions. Mean ± SD of the track length distribution is shown.(nUT= 158, nUNC0642 = 163, nroscovitin = 161, nUNC0642+roscovitin = 165 CldU and IdU tracks analyzed; **** = P ≤ 0.0001, **= P ≤ 0.01, *= P ≤ 0.05, ns = non-significant, One-way ANOVA Kruskal-Wallis test followed by Dunn’s test). (f) Fork degradation assay using DNA fiber methodology. The distribution of the ratio of IdU to CldU track length (µm) was plotted for the given conditions. (nUT= 155, nUNC0642 = 152, nroscovitin = 154, nUNC0642+roscovitin = 154 tracks analyzed; **** = P ≤ 0.0001, ns = non-significant, One-way ANOVA Kruskal-Wallis test followed by Dunn’s test). (g, h) Representative images (top) and Quantification (bottom) of colony survival assay. Mean survival ± SD from 3 independent experiments in wild type (WT) and cells lacking G9a (G9a-/-) treated with different concentrations of olaparib (PARPi, g) or cisplatin (h) is shown. (**** = P ≤ 0.0001, ** = P ≤ 0.01, ns = non-significant, unpaired two-sided t-test). (i) Primpol was over-expressed in MRC-5 cells 48 h prior to the experiment and accumulation of ssDNA behind the replication forks upon primpol over-expression (primpol OE) and G9a inhibition (UNC0642) was assess using S1 nuclease. Right: IdU track length (µm) distribution for the indicated conditions. (nUT_S1- = 120, nPrimpolOE_S1- = 113, nUNC0642_S1- = 120, nPrimpolOE+UNC0642_S1- = 100, nUT_S1+ = 101, nPrimpolOE_S1+ = 110, nUNC0642_S1+ = 112, nPrimpolOE+UNC0642_S1+ = 114 tracks analyzed; **** = P ≤ 0.0001, *** = P ≤ 0.001, ** = P ≤ 0.01, * = P ≤ 0.05, ns = non-significant, Kruskal-Wallis test followed by Dunn’s test). Source numerical data are available in source data. Source data
Extended Data Fig. 8
Extended Data Fig. 8. Extended Data Figure. 8 related to Extended Data Fig. 4. Flow Cytometry Gating Strategy.
Single nuclei were selected using FSC-A vs SSC-A, followed by FSC-H vs FSC-W and SSC-H vs SSC-W in the flow cytometry analysis. G1 phase, S phase and G2/M phase of the cell cycle were determined based on the intensity of the EdU and the DAPI channel.

References

    1. Luger K, Hansen JC. Nucleosome and chromatin fiber dynamics. Curr. Opin. Struct. Biol. 2005;15:188–196. doi: 10.1016/j.sbi.2005.03.006. - DOI - PubMed
    1. Alabert C, Groth A. Chromatin replication and epigenome maintenance. Nat. Rev. Mol. Cell Biol. 2012;13:153–167. doi: 10.1038/nrm3288. - DOI - PubMed
    1. Bhaumik SR, Smith E, Shilatifard A. Covalent modifications of histones during development and disease pathogenesis. Nat. Struct. Mol. Biol. 2007;14:1008–1016. doi: 10.1038/nsmb1337. - DOI - PubMed
    1. Grewal SI, Jia S. Heterochromatin revisited. Nat. Rev. Genet. 2007;8:35–46. doi: 10.1038/nrg2008. - DOI - PubMed
    1. Henikoff S, Shilatifard A. Histone modification: cause or cog? Trends Genet. 2011;27:389–396. doi: 10.1016/j.tig.2011.06.006. - DOI - PubMed

Publication types

MeSH terms