. 2023 Jul;25(7):975-988.
doi: 10.1038/s41556-023-01171-3. Epub 2023 Jul 6.

Class 3 PI3K coactivates the circadian clock to promote rhythmic de novo purine synthesis

Affiliations

Class 3 PI3K coactivates the circadian clock to promote rhythmic de novo purine synthesis

Chantal Alkhoury et al. Nat Cell Biol. 2023 Jul.

Abstract

Metabolic demands fluctuate rhythmically and rely on coordination between the circadian clock and nutrient-sensing signalling pathways, yet mechanisms of their interaction remain not fully understood. Surprisingly, we find that class 3 phosphatidylinositol-3-kinase (PI3K), known best for its essential role as a lipid kinase in endocytosis and lysosomal degradation by autophagy, has an overlooked nuclear function in gene transcription as a coactivator of the heterodimeric transcription factor and circadian driver Bmal1-Clock. Canonical pro-catabolic functions of class 3 PI3K in trafficking rely on the indispensable complex between the lipid kinase Vps34 and regulatory subunit Vps15. We demonstrate that although both subunits of class 3 PI3K interact with RNA polymerase II and co-localize with active transcription sites, exclusive loss of Vps15 in cells blunts the transcriptional activity of Bmal1-Clock. Thus, we establish non-redundancy between nuclear Vps34 and Vps15, reflected by the persistent nuclear pool of Vps15 in Vps34-depleted cells and the ability of Vps15 to coactivate Bmal1-Clock independently of its complex with Vps34. In physiology we find that Vps15 is required for metabolic rhythmicity in liver and, unexpectedly, it promotes pro-anabolic de novo purine nucleotide synthesis. We show that Vps15 activates the transcription of Ppat, a key enzyme for the production of inosine monophosphate, a central metabolic intermediate for purine synthesis. Finally, we demonstrate that in fasting, which represses clock transcriptional activity, Vps15 levels are decreased on the promoters of Bmal1 targets, Nr1d1 and Ppat. Our findings open avenues for establishing the complexity for nuclear class 3 PI3K signalling for temporal regulation of energy homeostasis.


Conflict of interest statement

The authors declare no competing interests.

Figures
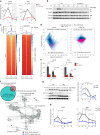
Fig. 1
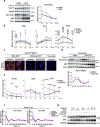
Fig. 1. Bmal1 transcriptional activity is inhibited following Vps15 inactivation.
a, Relative transcript levels of the indicated genes in the livers of 5-week-old Vps15LKO and control male mice collected at the indicated ZT times. The mice were fed ad libitum and kept under a 12-h light–dark regimen (grey shading). Data are the mean ± s.e.m. fold increase compared with the WT (n = 3 Vps15LKOZT0,ZT18, n = 4 WTZT0,ZT6,ZT18 and Vps15LKOZT6,ZT12, and n = 5 WTZT12 animals). *P < 0.05; two-tailed unpaired Student’s t-test. b, Immunoblot analysis of total protein extracts from the livers of the mice in a. c, Bmal1-binding peak profile (top) and heatmap (bottom) of the livers of male WT (n = 2) and Vps15LKO (n = 2) mice collected at ZT6. Peaks are ordered by their signal strength. Each row shows the region from −3 kb to +3 kb from the TSS. d, The log intensity ratio versus mean log intensity (MA) plot showing differential binding of Bmal1 and histone H3K27Ac in the livers of the WT and Vps15LKO mice in c (false detection rate (FDR) < 0.15). Concentration represents the normalized read counts within peaks; fold change was calculated relative to the WT. Blue line, log2(fold change) = 0; pink line, nonlinear LOESS fit curve of the coverage levels and fold changes. e, Bmal1 recruitment to the indicated gene promoters, determined by chromatin immunoprecipitation with quantitative PCR (ChIP–qPCR), in the livers (collected at ZT6–ZT12 and ZT18–ZT24) of mice (n = 3) treated as in a. Data are the mean ± s.e.m. *P < 0.05; one-way analysis of variance (ANOVA) with Benjamini–Hochberg correction. f, Number of overlapping and non-overlapping Bmal1 and H3K27Ac peaks reduced in Vps15LKO mice (top). The GO biological process analysis of the genes corresponding to 539 overlapping peaks is presented (bottom). g,h, Immunoblot analysis of total protein extracts (n = 4; g) and relative transcript levels of the indicated genes (independent repeats, n = 4 for CRECT32,CT36 and n = 5 for all other groups; h) in dexamethasone-synchronized control (green fluorescent protein, GFP) and Vps15-depleted (CRE) MEFs. Densitometric analyses of Rev-Erbα levels normalized to Gapdh. Data are the mean ± s.e.m. fold change compared with GFP-treated cells. Δex2, deletion of exon2 in Vps15 locus. *P < 0.05; two-tailed unpaired Student’s t-test. a,g,h, Rhythmicity was determined using JTK_CYCLE (Supplementary Table 1). Source data and unprocessed blots are provided. Source data
Fig. 2
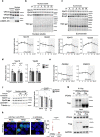
Fig. 2. The lipid kinase activity of Vps34 is dispensable for Rev-Erbα protein expression.
a,b, Immunoblot analysis (n = 3) of dexamethasone-synchronized MEFs treated with dimethyl sulfoxide (DMSO, control) or Vps34 inhibitor (SAR405). Densitometry analyses of Rev-Erbα protein levels, normalized to Actin, presented as the fold change over DMSO-treated MEF cells (right). b, Relative transcript levels (n = 8; b) of dexamethasone-synchronized MEFs treated with DMSO (control) or Vps34 inhibitors (SAR405 and PIK-III). *P < 0.05 for SAR405 versus DMSO and **P < 0.05 for PIK-III versus DMSO; two-way ANOVA with Benjamini–Hochberg correction. a,b, Data are the mean ± s.e.m. from three independent experiments. c, ChIP–qPCR of Bmal1 recruitment to the Nr1d1 and Dbp promoters in MEFs treated with SAR405 or DMSO as in a collected at 24 h post synchronization. Data are the mean ± s.e.m. fold enrichment from three independent experiments (n = 9). *P < 0.05; two-way ANOVA with Benjamini–Hochberg correction. d, Immunoblot analysis of total protein extracts (n = 4). Densitometric analyses of Rev-Erbα levels normalized to Actin (right). e, Relative transcript levels of the indicated genes in dexamethasone-synchronized control (GFP) and Vps34-depleted (CRE) Vps34f/f MEFs. d,e, Data are the mean ± s.e.m. fold change compared with GFP-treated MEFs from three independent experiments (n = 5 for GFPCT16 and n = 6 for all other groups). Rhythmicity was determined using JTK_CYCLE (Supplementary Table 1). f, ChIP–qPCR of Bmal1 recruitment to the Nr1d1 and Dbp promoters in GFP and CRE MEFs collected at 24 h post synchronization. Data are the mean ± s.e.m. from three independent experiments (n = 10 for GFP ChIP-IgG and n = 11 for all other groups). *P < 0.05; two-way ANOVA with Benjamini–Hochberg correction. Source data and unprocessed blots are provided. Source data
Fig. 3
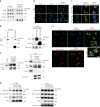
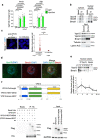
Fig. 3. Nuclear class 3 PI3K interacts with RNA Pol2.
a, Immunoblot analysis of soluble nuclear and cytosolic fractions from MEFs using antibodies to the indicated proteins. Tubulin and lamin A/C serve as controls for loading and fraction cross-contamination. The experiment was performed seven times. b, Immunofluorescence microscopy analyses of Vps15 in MEF cells treated with CSK buffer for 2 min. Nuclei were stained with 4,6-diamidino-2-phenylindole (DAPI). Scale bar, 10 µm. c, Transcription assay with ectopically expressed VPS15–Flag and VPS34–Flag in MEFs. To label de novo transcription sites, MEFs were incubated with BrUTP 24 h post transfection. For co-localization, immunofluorescence microscopy was performed with anti-Flag and anti-BrUTP. Scale bar, 5 µm. d, Immunoblot analyses, using antibodies to the indicated proteins, of the Flag-containing immunoprecipitates from the soluble nuclear fraction of HEK293T cells transfected with empty vector (EV), or VPS15–Flag- or VPS34–Flag-expressing vectors. e, Immunofluorescence microscopy analyses of the co-localization of endogenous RNA Pol2 phospho-S5 (pS5), Vps15 and de novo transcription sites labelled with BrUTP in primary mouse hepatocytes. Scale bars, 10 µm and 5 µm (inset). c,e, The white triangles point to co-localization. f, Immunoblot analyses, using anti-RNA Pol2, of Vps15-containing immunoprecipitates from the soluble nuclear fractions of MEF cells. bf, The experiments were performed three times. g, Immunoblot analyses of VPS15-containing complexes immunoprecipitated from HEK293T cells transiently transfected with Flag-conjugated WT or mutant VPS15 ((VPS15Mut1 (Mut1) and VPS15Mut2 (Mut2)). The cells were collected 48 h post transfection and VPS15 was immunoprecipitated using anti-Flag. The experiment was performed five times. Representative blots (a,d,f,g) or microscopy fields of view (b,c,e) are shown. IP, immunoprecipitation. Unprocessed blots are provided. Source data
Fig. 4
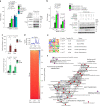
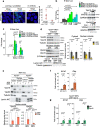
Fig. 4. Vps15 interacts with Bmal1.
a, Immunoblots of Bmal1-containing immunoprecipitates from total extracts of MEFs. Right: clock levels normalized to Bmal1 in immunoprecipitates presented as the mean ± s.e.m. (independent repeats, n = 3). b, ChIP–qPCR analysis of Bmal1 recruitment to the indicated gene promoters in GFP and CRE MEFs 24 h post dexamethasone synchronization. Data are the mean ± s.e.m. fold enrichment from three independent experiments (n = 6 for GFP-IgG, n = 7 for GFP-Bmal1 and n = 8 for all other groups). c, Left: immunoblot of BMAL1 immunoprecipitates from the total extracts of HEK293T cells transfected with increasing amounts of VPS15WT. Right: CLOCK levels normalized to BMAL1 in BMAL1 immunoprecipitates are presented as the fold difference to the cells transfected with empty vector. Data are the mean (independent repeats, n = 2 for VPS15WT–Flag 2.5 μg and n = 3 for all other groups). d, Immunoblot of VPS15–Flag-containing complexes immunoprecipitated from HEK293T cells transfected with the indicated constructs. e, Proximity ligation assay of endogenous VPS15 and Flag–BMAL1 in HEK293T cells (co-transfected with GFP). The ‘no antibodies’ condition served as the negative control. Scale bar, 10 µm. Right: data are the mean ± s.e.m. number of proximity puncta per cell (n = 8 no antibody and n = 25 anti-Flag + anti-VPS15 fields) from three independent experiments (>500 cells per condition). b,e, *P < 0.05; two-tailed unpaired Student’s t-test. f, Immunoblot, using the indicated antibodies, of Vps15 immunoprecipitates from the soluble nuclear fractions of liver tissue of WT 5-week-old male mice (ZT6; fed ad libitum). g, Immunoblot analyses of VPS15WT- and VPS15Mut1-interacting proteins from HEK293T cells immunoprecipitated with anti-Flag. h, Left: immunoblot of the total extracts of GFP and CRE MEFs transduced with adenoviral vectors expressing GFP, VPS15WT or VPS15Mut1 and synchronized by dexamethasone. Right: densitometric analyses of Rev-Erbα normalized to Actin presented as the fold change compared with the GFP-GFP condition. Data are the mean ± s.e.m. from three independent repeats. *P < 0.05 for GFP versus CRE-GFP and **P < 0.05 for CRE-VPS15WT/Mut1 versus GFP-CRE; two-tailed unpaired Student’s t-test. i, Left: domain organization of mouse full-length Bmal1 protein (Protein Data Bank, 4F3L). Right: mapping of its truncated constructs. Middle: Immunoblot of Bmal1 immunoprecipitates from total extracts of HEK293T cells. The experiment was performed three times. Representative blots are shown. aa, amino acids. Source data and unprocessed blots are provided. Source data
Fig. 5
Fig. 5. Vps15 transcriptionally coactivates Bmal1.
a, Left: luciferase assay in HEK293T cells co-transfected with the E-box-Luc reporter and EV or BMAL1–CLOCK with or without VPS15WT, VPS15Mut1, CBP or p300. Relative luminescence presented as fold difference compared with cells transfected with E-box-Luc + EV. Data are the mean ± s.e.m. (independent experiments, n = 4 for BMAL1–CLOCK + VPS15Mut1/CBP, n = 5 for BMAL1–CLOCK + p300, n = 8 for BMAL1–CLOCK + EV and n = 12 for BMAL1–CLOCK + VPS15WT). Right: representative immunoblot with anti-Flag showing the expression levels of BMAL1, CLOCK, VPS15 and GAPDH as the loading control (right). b, Left: luciferase assay in HEK293T cells co-transfected with E-box-Luc reporter construct and EV or plasmids expressing BMAL1 and CLOCK with or without Cry1, VPS15WT or VPS15Mut1. Relative luminescence is presented as the fold difference compared with E-box-Luc-transfected cells. Data are the mean ± s.e.m. (n = 4 independent experiments). Right: representative immunoblot showing the expression levels of Cry1, BMAL1, CLOCK, VPS15 and GAPDH as the loading control. c, ChIP–qPCR analyses of Bmal1 and Vps15 enrichment at the promoters of the indicated genes in the liver tissue of 5-week-old male mice (ZT6). Data are the mean ± s.e.m. fold enrichment (n = 6 mice). ac, *P < 0.05; two-tailed unpaired Student’s t-test. d, Vps15 binding peak profile and heatmap for the livers (n = 2 mice) of WT male mice (ZT6; 5 weeks old). Peaks are ordered by their signal strength and each row shows the promoter region from −3 kb to +3 kb from the TSS. e, HOMER motif analysis of Vps15 peaks. Identified consensus motifs are shown with their respective significance calculated with HOMER and the percentage of target coverage in all ChIP peaks. f, Analysis of GO Biological process using enrichGO showing significantly enriched genes for which chromatin binding of Vps15 was detected in WT liver and for which Bmal1 chromatin enrichment and transcript levels were downregulated in the livers of Vps15LKO mice. Source data and unprocessed blots are provided. Source data
Fig. 6
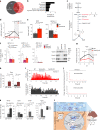
Fig. 6. Vps15 controls de novo purine synthesis in the liver.
a, Number of cycling liver metabolites in 5-week-old Vps15LKO and WT male mice (n = 5). The percentage of metabolites oscillating in the WT are indicated. b, Top six oscillating metabolic pathways in WT liver. All metabolites are listed in Supplementary Table 6. c, Representation of de novo purine synthesis. 15N-glutamine-amide entry is shown. d, Ratio of liver IMP to PRPP in the samples in a (n = 4 for Vps15LKOZT12 and n = 5 for all other groups). The mice were fed ad libitum and kept under a 12-h light–dark regimen (grey shading). e, 15N-glutamine-amide incorporation in IMP at ZT12 in the livers of 5-week-old WT and Vps15LKO male mice (n = 6 for WT and n = 12 for Vps15LKO). f, Left: 15N-glutamine-amide incorporation in AML12 cells expressing GFP, small hairpin RNA (shRNA) targeting Bmal1 (shBmal1) or Vps15 (shVps15; n = 9 independent repeats). Right: depletion controlled in representative immunoblot. g, Relative liver Ppat expression (n = 3 for Vps15LKOZT0, n = 5 for WTZT12 and n = 4 for all other groups). The mice were fed ad libitum and kept under a 12-h light–dark regimen (grey shading). h, ChIP–qPCR of Bmal1 and Vps15 enrichment on the Ppat promoter in the liver of 5-week-old WT male mice (ZT6; n = 6). i, Top: bioluminescence recordings of Nr1d1-Luc in the liver of a representative four-month-old male TtrCre+;Vps15f/f mouse kept in constant darkness (pre-tamoxifen, WT) for 9 days, treated with tamoxifen for 5 days and monitored for 14 days following tamoxifen-induced Vps15iLKO (post-tamoxifen; top). Bottom: locomotor activity is shown (bottom). j, Periodograms (FFT analysis) of the data in i. k, ChIP–qPCR of Bmal1 and Vps15 promoter enrichment in the liver of 5-week-old male mice (ZT6) that were fed ad libitum or fasted for 24 h (n = 3 for fast, n = 4 for fed and n = 6 for IgG). dh,k, Data are the mean ± s.e.m. *P < 0.05; two-tailed unpaired Student’s t-test. l, Functions of class 3 PI3K in vesicular trafficking to lysosomes and as coactivator of the circadian clock for de novo purine synthesis (created with BioRender.com). a,g, Rhythmicity was determined using JTK_CYCLE (Supplementary Table 1). Source data and unprocessed blots are provided. Source data
Extended Data Fig. 1
Extended Data Fig. 1. Bmal1 dysfunction in the livers of Vps15 hepatic mutants.
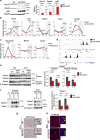
a, Immunoblot analysis of total protein extracts from the liver of five-week-old ad libitum-fed male Vps15LKO and control mice (ZT6). Densitometric analyses of proteins normalized to the Gapdh levels are presented. Data are the mean ± s.e.m., (n = 4), #P < 0.05, two-tailed unpaired Student’s t-test. b, Relative transcript levels of clock genes in the livers of Vps15LKO and control five-week-old ad libitum-fed male mice collected at the indicated ZT times under a 12 h light–dark regimen. Data are presented as the mean ± s.e.m. (n = 3 Vps15LKOZT0,ZT18, n = 5 WTZT12 and n = 4 for all other groups). #P < 0.05 versus WT, two-tailed unpaired Student’s t-test. Rhythmicity pattern tested using JTK_CYCLE (Supplementary Table 1). c, Densitometric analyses of proteins normalized to Gapdh. Data are the mean ± s.e.m. (n = 3). #P < 0.05 versus WT, two-tailed unpaired Student’s t-test. Rhythmicity pattern tested using JTK_CYCLE (Supplementary Table 1). d, Bmal1 ChIP–Seq peak signals on the Nr1d1 and Dbp promoters. The TSS is indicated by a triangle. e, Immunoblot analysis of the cytosolic and soluble nuclear fractions of WT and Vps15LKO mouse livers collected at the indicated ZT times. Densitometric analyses of Bmal1 protein normalized to tubulin (cytosolic fraction) or β-catenin (soluble nuclear fraction) levels presented as the fold change over WTZT0. Data are the mean ± s.e.m. (n = 3). #P < 0.05 versus WT, two-tailed, unpaired Student’s t-test. f, Immunoblot analyses of Bmal1-containing complexes immunoprecipitated from the soluble nuclear fraction of the livers of WT and Vps15LKO mice. Beads alone (marked as B) served as non-specific binding control. Densitometric analysis of the relative Clock levels in Bmal1 immunoprecipitates presented. Data are the mean ± s.e.m. (n = 3). #P < 0.05 versus WT, two-tailed unpaired Student’s t-test. g,h, Immunohistochemistry (g) and immunofluorescent microscopy (h) analyses of Bmal1 in liver sections of Vps15LKO and WT mice (ZT0). Analyses performed on three WT and four Vps15LKO mice, conditions and representative images are shown. Scale bars, 20 µm and 10 µm (inset). Source numerical data and unprocessed blots are provided. Source data
Extended Data Fig. 2
Extended Data Fig. 2. Acute Vps15 depletion does not affect Bmal1 turnover.
a,b, Immunoblots of total extracts of dexamethasone-synchronized control (a) and Vps15-depleted MEFs (b) performed three times; representative repeat shown. c, PI3P detection with HRS–RFP probe in Vps15-depleted (CRE) and control (GFP) MEFs. HRSmut–RFP probe and cells treated without the probe served as non-specific-binding controls. Quantification of HRS–RFP puncta per cell presented the mean ± s.e.m. (n = 66 GFP and n = 73 CRE cells taken from three experiments). #P< 0.000001 versus GFP, two-tailed unpaired Student’s t-test. Scale bar, 10 µm. d, Immunofluorescence microscopy analyses of p62. Experiment repeated three times, representative field shown. Scale bar, 20 µm. e, Fluorescence microscopy of mRFP–EGFP-LC3 in MEFs that were either kept in nutrient-rich media or EBSS for 2 h to induce autophagic flux. Red and yellow puncta were quantified for each cell and data are presented as the percentage of puncta (left) or number of puncta per cell (right; n = 32 GFPgrow, n = 23 GFPEBSS, n = 47 CREgrow, n = 20 CREEBSS cells taken from three experiments). #P < 0.05 grow versus EBSS or CRE versus GFP, two-way ANOVA with Benjamini–Hochberg correction. Scale bar, 5 µm. f, Transcript levels in dexamethasone-synchronized MEFs. Data collected in three independent experiments presented as the fold change ± s.e.m. over GFP-treated cells (n = 4 CRECT32,CT36 and n = 5 other groups). #P < 0.05 versus GFP, two-tailed unpaired Student’s t-test. Rhythmicity was determined using JTK_CYCLE (Supplementary Table 1). g, Immunoblot of cytosolic and soluble nuclear protein extracts in dexamethasone-synchronized MEFs. Densitometric analyses of Bmal1 normalized to tubulin (cytosolic fraction) and Lamin A/C (soluble nuclear fraction) presented as the fold change over GFP-treated cells. Data collected in three independent experiments presented as the mean ± s.e.m. (n = 8 CRECytosol and n = 9 for all other groups). h, Immunofluorescence microscopy of Bmal1 in MEFs. Quantification of Bmal1-positive signal in the nucleus and cytosol presented. Data are the mean fluorescence intensity in n = 278 (GFP) and n = 180 (CRE) cells taken from three experiments. Scale bar, 10 µm. i, Immunoblot of soluble nuclear fractions of MEFs treated with cycloheximide. Densitometric analyses of Bmal1 and Clock normalized to total protein (TGX gels) presented as the fold change ± s.e.m. over the vehicle-treated group (n = 3 independent experiments). Source numerical data and unprocessed blots are provided. Source data
Extended Data Fig. 3
Extended Data Fig. 3. Lipid kinase-independent role of class 3 PI3K in control of the circadian clock.
a,b, Protein (n = 3; a) and relative transcript levels (n = 8; b) in MEFs synchronized with dexamethasone and treated with DMSO or PIK-III. Densitometry analyses of Rev-Erbα protein normalized to the Actin levels presented as the fold change over DMSO-treated cells. Data are the mean ± s.e.m. (n = 3 independent experiments). #P < 0.05 versus DMSO (SAR405) and $P < 0.05 versus DMSO (PIK-III); two-way ANOVA with Benjamini–Hochberg correction. c, PI3P detection with HRS–RFP probe in Vps15f/f MEFs treated with Vps34-IN1 (5 µM) for 18 h. Incubation with and without HRSmut–RFP probe served as a control for non-specific binding. Experiment repeated three times; representative fields shown. Scale bar, 10 µm. d,e, Protein (n = 3; d) and relative transcript levels (n = 9; e) in MEFs synchronized with dexamethasone and treated with DMSO or Vps34-IN1. Densitometry analyses of Rev-Erbα protein normalized to Actin presented as the fold change over DMSO-treated cells (ns, non-specific band). Data collected in three independent experiments presented as the mean ± s.e.m. #P < 0.05 versus DMSO; two-tailed unpaired Student’s t-test. f, Bioluminescence recordings of Nr1d1-Luc oscillations in MEFs synchronized with dexamethasone and treated with DMSO or Vps34 lipid kinase inhibitors (PIK-III, SAR405 and Vps34-IN1) at the indicated doses during the duration of the recording. Data are expressed as average detrended values from n = 4 independent experiments. g, Representative immunoblot analysis in MEF cells treated with DMSO, SAR405, PIK-III or Vps34-IN1 collected at the end of the recording in f. Source data and unprocessed blots are provided. Source data
Extended Data Fig. 4
Extended Data Fig. 4. Vps34 inactivation does not impact Bmal1 protein levels.
a, Densitometric analysis of Vps15 and Vps34 levels normalized to Actin in total protein extracts of synchronized control (GFP) and Vps34-depleted (CRE) MEFs collected 16 h after synchronization with dexamethasone. Data are the mean ± s.e.m. (n = 3). #P < 0.05 versus GFP; two-tailed unpaired Student’s t-test. b, Immunofluorescence microscopy analyses of p62 in Vps34-depleted (CRE) and GFP-transduced MEFs 5 d post infection. Experiment repeated three times, representative field shown. Scale bar, 20 µm. c, Relative transcript levels of the indicated genes in dexamethasone-synchronized control (GFP) and Vps34-depleted (CRE) MEFs. Data collected in three independent experiments presented as the fold change ± s.e.m. over GFP-treated cells (n = 5 GFPCT16 and n = 6 for all other groups). #P < 0.05 versus GFP; two-tailed unpaired Student’s t-test. Rhythmicity was determined using JTK_CYCLE (Supplementary Table 1). d, Immunoblot analysis, using the indicated antibodies, of cytosolic and soluble nuclear protein extracts in dexamethasone-synchronized control and Vps34-depleted MEFs. Densitometric analyses of Bmal1 protein normalized to tubulin (cytosolic fraction) and β-catenin (soluble nuclear fraction) presented as the fold change over GFP-treated cells. Data collected in three independent experiments are the mean ± s.e.m. (n = 8). Source data and unprocessed blots are provided. Source data
Extended Data Fig. 5
Extended Data Fig. 5. Rhythmic nuclear expression of class 3 PI3K subunits.
a, Immunoblot analysis, using the indicated antibodies, of the soluble nuclear and cytosolic fractions of HEK293T cells. GAPDH and LAMIN A/C served as purity controls for the cytosolic and soluble nuclear fractions. Experiment repeated five times; representative repeat shown. b,c, Immunoblot analysis of soluble nuclear (b) and euchromatin (c) fractions from the livers of eight-week-old male WT mice. Densitometric analysis of Vps15 and Vps34 normalized to total protein (TGX gels) are presented as the fold change over ZT0. Data are the mean ± s.e.m. (n = 4 mice). Rhythmicity pattern was tested using JTK_CYCLE (Supplementary Table 1). d, Mean normalized Vps15 and Vps34 protein levels in soluble nuclear (as in b) and euchromatin (as in c) fractions during the light (ZT0–ZT8) and dark (ZT12–ZT20) phase. Data are the mean ± s.e.m. (n = 8 mice in dark and n = 16 mice in light). #P < 0.05 versus light; two-tailed unpaired Student’s t-test. e, Relative transcript levels of the indicated genes in the livers of mice treated as in b. Data are presented as the mean ± s.e.m. (n = 4 mice). Rhythmicity was determined using JTK_CYCLE (Supplementary Table 1). f, Immunoblot analysis, using the indicated antibodies, of the soluble nuclear protein extracts of MEF cells treated with ivermectin for the indicated times. Densitometric analyses of Vps15 and Vps34 normalized to lamin B1 presented as the fold change over vehicle-treated cells. Data are the mean ± s.e.m. (independent repeats: n = 7 ivermectin (4 h) and n = 8 for all other groups). #P < 0.05 versus DMSO; two-tailed unpaired Student’s t-test. g, Immunoblot analyses of IPOA5 co-immunoprecipitated with ectopically expressed VPS15 and VPS34 from HEK293T cells using anti-Flag (ev, empty vector). Immunoprecipitation was performed three times; representative blots shown. h, Proximity ligation assay between endogenous VPS15 and ectopic Flag–VPS34 protein in HEK293T cells (co-transfection with GFP-expressing vector visualized transfected cells). The ‘no antibody’ condition served as a control for the non-specific signal. Scale bar, 10 µm. Data are the mean ± s.e.m. of proximity puncta per cell (n = 8 fields (no antibody) and n = 14 fields (Flag + VPS15) with over 300 cells collected in three independent experiments for each condition is presented; no antibody condition shared with Fig. 4e). #P = 0.00005 versus no antibody; two-tailed unpaired Student’s t-test. Source numerical data and unprocessed blots are provided. Source data
Extended Data Fig. 6
Extended Data Fig. 6. Vps15 interacts with Bmal1.
a, Bmal1 and RNA Pol2 pS5 recruitment to the promoters of the indicated genes in MEFs transduced with adenoviral vectors expressing VPS15WT or GFP as a control (determined by ChIP–qPCR). The cells were dexamethasone-synchronized and collected 24 h after synchronization. Data are presented as the log2-transformed fold change enrichment over IgG ± s.e.m. (n = 8 independent experiments). #P < 0.05 versus IgG; two-tailed unpaired Student’s t-test. b, Immunoblot analyses of Vps15-containing immunoprecipitates from the soluble nuclear and cytosol fractions of MEF cells. Immunoprecipitation was performed three times; representative blots shown. c, Proximity ligation assay between endogenous VPS15 and BMAL1 proteins in HEK293T cells. The no antibody condition served as a control for non-specific binding. Scale bar, 10 µm. Data are the mean ± s.e.m. proximity puncta per cell (n = 9 fields (no antibody) or n = 36 fields (VPS15 + BMAL1) with over 1,000 cells collected in three independent experiments for each condition). #P = 0.004 versus no antibody; two-tailed unpaired Student’s t-test. d, Immunofluorescence microscopy analyses of endogenous Vps15 and Bmal1 in MEF cells. The white triangles point to the co-localization. Experiment repeated three times, representative field shown. Scale bar, 5 µm. e, Immunoblot analyses, using anti-Vps15, of Vps15-containing immunoprecipitates from the soluble nuclear fraction of WT livers of five-week-old ad libitum-fed male mice collected at the indicated ZT times. Quantification of Bmal1 in Vps15 immunoprecipitates normalized to the non-specific binding to beads is presented as the fold change over ZT0. Data are the mean ± s.e.m. (n = 3 independent experiments on different mice). f, Schematic representation of Flag-tagged VPS15-deletion mutants. Immunoblot analyses, using anti-Flag, of Bmal1-His-containing immunoprecipitates from total protein extracts of HEK293T cells expressing deletion mutants of VPS15 (Flag tagged) together with Bmal1-His full-length (Fl) protein. Experiment performed three times and representative blot shown. Source numerical data and unprocessed blots are provided. Source data
Extended Data Fig. 7
Extended Data Fig. 7. Vps34-independent function of Vps15 in Bmal1–Clock coactivation.
a, Proximity ligation assay of BMAL1 and Flag–VPS34 in HEK293T cells (GFP co-transfection shows transfected cells). No antibody served as a non-specific control. Scale bar, 10 µm. Data are the mean ± s.e.m. proximity puncta per cell (n = 4 fields (no antibody) and n = 16 fields (Flag+BMAL1) with over 290 cells collected in three independent experiments). #P = 0.009 versus no antibody; two-tailed unpaired Student’s t-test. b, Luciferase assay in HEK293T cells co-transfected with E-box-Luc reporter, empty vector or BMAL1–CLOCK, with or without increasing doses of VPS15WT or VPS34WT. Relative luminescence presented as the fold difference over E-box-Luc. Data are the mean ± s.e.m. (independent experiments, n = 3 BMAL1–CLOCK + VPS34 and n = 5 for all other groups). #P < 0.05; two-tailed unpaired Student’s t-test. Representative immunoblot of VPS15 and VPS34 shows overexpression. c, Luciferase assay in HEK293T cells co-transfected with E-box-Luc reporter, empty vector or BMAL1–CLOCK, with or without Cry1 or VPS34 (control and VPS15WT conditions shared with Fig. 5b). Relative luminescence presented as the fold difference over the E-box-Luc only condition. Data are the mean ± s.e.m. (n = 4 independent experiments). #P < 0.05; two-tailed unpaired Student’s t-test. d, Immunoblot of the cytosolic and soluble nuclear extracts of dexamethasone-synchronized MEFs. Densitometric analyses of proteins normalized to tubulin (cytosol) and β-catenin (nucleus) presented as the fold change over the GFP condition. Data are the mean ± s.e.m. (n = 8 independent repeats). #P < 0.05 versus GFP; two-tailed unpaired Student’s t-test. Bottom panel shows the fraction purity. e, Immunoblot of the cytosolic and nuclear extracts of dexamethasone-synchronized MEFs. Densitometric analyses of proteins normalized to tubulin (cytosol) and lamin A/C (nucleus) presented as the fold change over the GFP condition. Data are the mean ± s.e.m. (n = 3 independent experiments). #P < 0.05; two-tailed unpaired Student’s t-test. f, ChIP–qPCR of Vps15 in dexamethasone-synchronized MEFs 24 h post synchronization. Data collected in three independent experiments presented as the mean ± s.e.m. fold enrichment over IgG (n = 9). #P < 0.05 versus IgG; two-tailed unpaired Student’s t-test. g, ChIP–qPCR of Vps15 in dexamethasone-synchronized control and Vps34-depleted MEFs 24 h post synchronization. Data collected in three independent experiments presented as the mean ± s.e.m. fold enrichment over IgG (n = 10 ChIP-IgG-CRE, n = 11 ChIP-Vps15-CRE and n = 12 for all other groups). #P < 0.05 versus IgG, two-way ANOVA with Benjamini–Hochberg correction. Source numerical data and unprocessed blots are provided. Source data
Extended Data Fig. 8
Extended Data Fig. 8. De novo purine synthesis in liver depends on Vps15.
a, Heatmap showing cycling metabolites in the livers of five-week-old ad libitum-fed Vps15LKO and control male mice. Rhythmicity pattern determined with JTK_CYCLE (Supplementary Table 1). Columns correspond to different mice and cell colour shows the relative metabolite level. b, Pie chart of chemical classification of metabolites arrhythmic in Vps15LKO; percentage of each class of metabolites cycling in WT liver presented. Metabolite examples shown as graphs. Data are the mean ± s.e.m. (n = 5). #P < 0.05 versus WT (glyceraldehyde 3-phosphate: ZT0 P < 0.000001, ZT6 P = 0.008, ZT18 = 0.01; decanoic acid: ZT0 P = 0.007; succinyladenosine: ZT6 P = 0.03, ZT12 P = 0.0001, ZT18 = 0.0001; arginossuccinate: ZT0 P = 0.04); two-tailed unpaired Student’s t-test. c, Schematic representation of the purine metabolism. Data are the mean ± s.e.m. (n = 5). #P < 0.05 versus WT (PRPP: ZT0 P = 0.02, ZT6 P = 0.002, ZT12 P = 0.0003, ZT18 P = 0.03; glutamine: ZT6 P = 0.007; aspartate: ZT0 P = 0.009, ZT6 P = 0.009, ZT12 P = 0.0001, ZT18 P = 0.0006; glycine: ZT12 P = 0.02, ZT18 P = 0.01; IMP: ZT0 P = 0.008; GMP: ZT0 P < 0.000001; GDP: ZT0 P < 0.000001; guanosine: ZT0 P = 0.01, ZT6 P = 0.004, ZT12 P = 0.04, ZT18 P = 0.0002; AMP: ZT0 P = 0.002, ZT12 P = 0.01, ZT18 P = 0.007; ADP: ZT12 P = 0.006; ATP: ZT0 P = 0.0001; adenosine: ZT0 P = 0.04; inosine: ZT0 P = 0.0007, ZT6 P = 0.0004, ZT18 P = 0.002; hypoxanthine: ZT0 P = 0.001, ZT6 P = 0.001, ZT18 P = 0.001; xanthine: ZT0 P < 0.000001, ZT6 P < 0.000001, ZT12 P = 0.02, ZT18 P = 0.0001); two-tailed unpaired Student’s t-test. d, Ppat transcript levels in primary hepatocytes transduced with the indicated adenoviral vectors. Data are the mean ± s.e.m. (n = 7 independent experiments). #P < 0.05 versus GFP; two-tailed unpaired Student’s t-test. e, Ppat transcript levels in Vps15f/f primary hepatocytes transduced with GFP or CRE adenoviral vectors. Data are the mean ± s.e.m. (independent experiments, n = 8 GFP and n = 9 CRE). #P = 0.00001 versus GFP; two-tailed unpaired Student’s t-test. f, Bmal1 recruitment, determined by ChIP–qPCR, to the promoter of Ppat in pooled liver tissue samples collected at ZT6–12 and ZT18–24 of five-week-old ad libitum-fed Vps15LKO and control male mice. Data are the mean fold enrichment over IgG (independent experiments, n = 2 IgG and n = 3 ChIP-Bmal1). Source data are provided. Source data
Extended Data Fig. 9
Extended Data Fig. 9. Bmal1 transcriptional activity is inhibited following acute depletion of Vps15 in liver.
a,b, Immunoblot analysis, using the indicated antibodies, of total protein extracts from the liver of 3–4-month-old male and female ad libitum-fed Vps15iLKO and control mice. The samples were collected every 4 h under a 12 h light–dark regimen. Densitometric analyses of protein levels normalized to Gapdh presented as a Loess best-fit curve (n = 3 WTZT8 and Vps15iLKOZT12,ZT20 and n = 4 for all other groups). Rhythmicity was determined using JTK_CYCLE (Supplementary Table 1). c, Immunoblot analysis, using the specified antibodies, of the soluble nuclear fractions of the livers of WT and Vps15iLKO male and female mice collected at the indicated time points. Densitometric analyses of proteins normalized to Lamin B1 (soluble nuclear fraction) presented as a Loess best-fit curve (n = 3 WTZT0,ZT8 and Vps15iLKOZT0,ZT8,ZT12,ZT20, and n = 4 for all other groups). d, Immunohistochemistry analyses of Bmal1 in liver sections of Vps15iLKO and control male mice (ZT0) treated as in a. Scale bars, 20 µm and 10 µm (inset). Analyses performed on three mice; representative images are shown. e, Recordings of circadian Nr1d1-Luc expression in the livers of control (pre-tamoxifen) and Vps15iLKO (post-tamoxifen) male mice receiving luciferin in their drinking water (animals 2 and 3). The mice were injected with Ad-Nr1d1-Luc vectors via their tail vein. Bioluminescence started 48 h after injection and was monitored for 9 d (WT) in constant darkness. Tamoxifen was injected for five consecutive days, after which the Vps15iLKO phase was recorded. Simultaneously monitored spontaneous locomotor activity profiles are shown (bottom). f, Periodograms (FFT analysis) of the data shown in e. g, Relative transcript levels of the indicated genes in the livers of mice treated as in a. Data are log2-transformed normalized fold change as a Loess best-fit curve (n = 3 WTZT8, Vps15iLKOZT20; n = 4 Vps15iLKOZT8, WTZT20; n = 6 Vps15iLKOZT12; n = 7 Vps15iLKOZT4; n = 8 WTZT0, Vps15iLKOZT0, Vps15iLKOZT16; n = 9 WTZT12, WTZT16; and n = 10 for all other groups). Rhythmicity was determined using JTK_CYCLE (Supplementary Table 1). h, Bmal1 recruitment to the promoter of the indicated genes (determined by ChIP–qPCR) in pooled liver tissue (collected at ZT6) of male mice treated as in a. Data are the mean ± s.e.m. fold enrichment over IgG (n = 4 Vps15iLKO, n = 5 W and n = 6 IgG). #P < 0.05 versus IgG; two-tailed unpaired Student’s t-test. Source data and unprocessed blots are provided. Source data
Extended Data Fig. 10
Extended Data Fig. 10. Dampened response to fasting in hepatic Vps15 mutants.
a, Relative transcript levels of the indicated genes in liver tissue collected at ZT6 from WT and Vps15LKO male mice that were fed ad libitum or fasted for 24 h. Data are the mean ± s.e.m. fold change over the ad libitum-fed WT (n = 4). #P < 0.05 versus WT or Fed; two-way ANOVA with Benjamini–Hochberg correction. b, Immunoblot analysis, using the indicated antibodies, of the cytosolic and soluble nuclear fractions of the liver tissue of WT mice treated as in a. Densitometric analyses of Vps15 or Bmal1 proteins normalized to Tubulin (cytosol) or Histone H3 (nucleus) levels presented as the fold change ± s.e.m. over WT fed (n = 4). #P = 0.01 versus Fast; two-tailed unpaired Student’s t-test. Source data and unprocessed blots are provided. Source data

References

    1. Reinke H, Asher G. Crosstalk between metabolism and circadian clocks. Nat. Rev. Mol. Cell Biol. 2019;20:227–241. doi: 10.1038/s41580-018-0096-9. - DOI - PubMed
    1. Welsh DK, Takahashi JS, Kay SA. Suprachiasmatic nucleus: cell autonomy and network properties. Annu. Rev. Physiol. 2010;72:551–577. doi: 10.1146/annurev-physiol-021909-135919. - DOI - PMC - PubMed
    1. Stokkan KA, Yamazaki S, Tei H, Sakaki Y, Menaker M. Entrainment of the circadian clock in the liver by feeding. Science. 2001;291:490–493. doi: 10.1126/science.291.5503.490. - DOI - PubMed
    1. Schibler U, Ripperger J, Brown SA. Peripheral circadian oscillators in mammals: time and food. J. Biol. Rhythms. 2003;18:250–260. doi: 10.1177/0748730403018003007. - DOI - PubMed
    1. Takahashi JS. Transcriptional architecture of the mammalian circadian clock. Nat. Rev. Genet. 2017;18:164–179. doi: 10.1038/nrg.2016.150. - DOI - PMC - PubMed

Publication types

MeSH terms