. 2023 Nov;15(11):1591-1598.
doi: 10.1038/s41557-023-01256-4. Epub 2023 Jul 6.

Design of allosteric sites into rotary motor V1-ATPase by restoring lost function of pseudo-active sites

Affiliations

Design of allosteric sites into rotary motor V1-ATPase by restoring lost function of pseudo-active sites

Takahiro Kosugi et al. Nat Chem. 2023 Nov.

Abstract

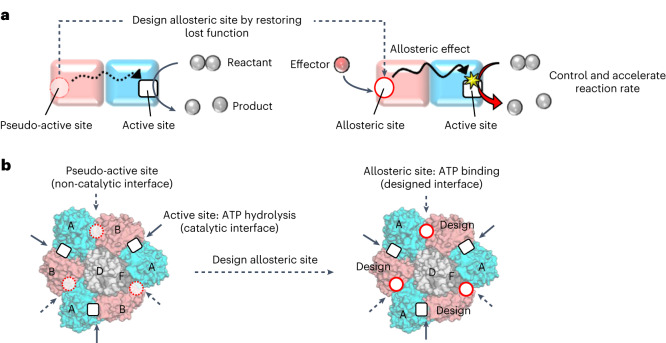
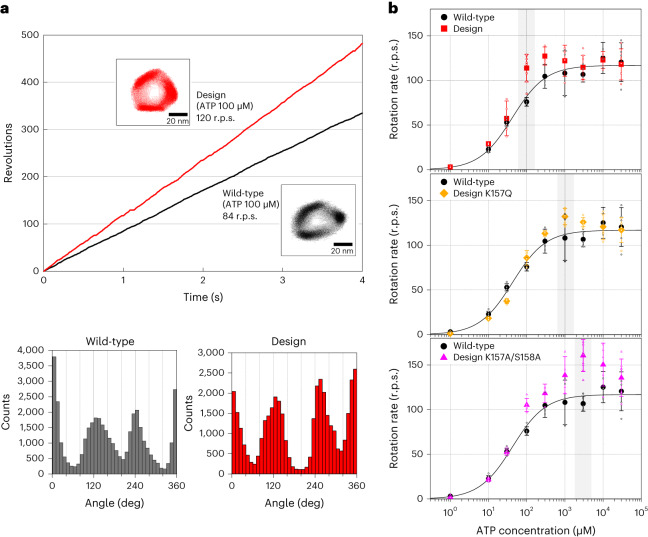
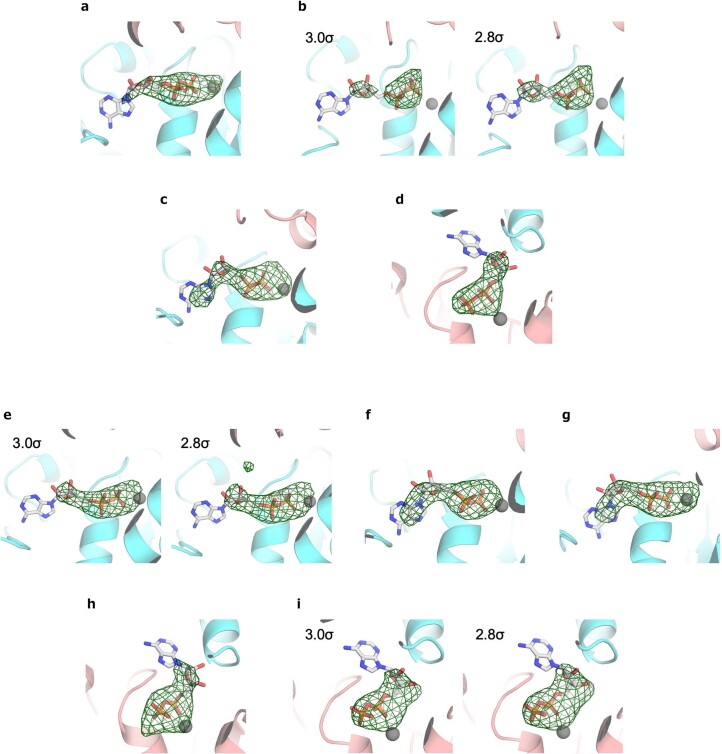
Allostery produces concerted functions of protein complexes by orchestrating the cooperative work between the constituent subunits. Here we describe an approach to create artificial allosteric sites in protein complexes. Certain protein complexes contain subunits with pseudo-active sites, which are believed to have lost functions during evolution. Our hypothesis is that allosteric sites in such protein complexes can be created by restoring the lost functions of pseudo-active sites. We used computational design to restore the lost ATP-binding ability of the pseudo-active site in the B subunit of a rotary molecular motor, V1-ATPase. Single-molecule experiments with X-ray crystallography analyses revealed that binding of ATP to the designed allosteric site boosts this V1's activity compared with the wild-type, and the rotation rate can be tuned by modulating ATP's binding affinity. Pseudo-active sites are widespread in nature, and our approach shows promise as a means of programming allosteric control over concerted functions of protein complexes.


Conflict of interest statement

The authors declare no competing interests.

Figures

Fig. 1
Fig. 1. Strategy for designing allosteric sites in protein complexes.
a, Strategy for the design of an allosteric site in a protein dimer complex. The non-catalytic subunit (pink) has a pseudo-active site, the function of which (for example, the ability to bind to a small molecule) has been lost during evolution. By computationally restoring the lost function, this pseudo-active site is engineered to be an allosteric site that controls a function of the active site in the catalytic subunit (cyan) upon the small (that is, effector) molecule binding. b, Overview of design of allosteric sites in E. hirae V1-ATPase. The active sites in the catalytic interface and the pseudo-active sites in the non-catalytic interfaces are indicated by solid and dashed arrows, respectively, in the hexameric ring of V1 consisting of A subunits (cyan) and B subunits (pink). The rotor of the D and F subunits (grey) is located in the centre of the ring. The pseudo-active sites in the non-catalytic interfaces are designed to be ATP-binding allosteric sites that control the ATP hydrolysis function of the active sites in the catalytic interfaces.
Fig. 2
Fig. 2. Computational design of an ATP-binding allosteric site by engineering the pseudo-active site of V1-ATPase.
a, Structural differences between the active site in the A subunit and the pseudo-active site in the B subunit. The A subunit’s active site has a P-loop (GX1X2X3X4GK(T/S)), which is a well-known motif for binding to the phosphate group of ATP, and has a space to bind ATP. On the other hand, the B subunit’s pseudo-active site does not have either the P-loop or space for ATP binding. The B subunit has a loop (that is, the pseudo P-loop) at the position corresponding to the P-loop in the A subunit. The amino acid sequence and backbone geometry of the pseudo P-loop are different from the typical ones of P-loops, and the space around the pseudo P-loop is filled with side chains. b, A backbone structure of the P-loop built at the pseudo-active site. c, The created ATP-binding site at the pseudo-active site. Residues of the built P-loop (green) and grey residues (11 positions in total) were selected for the side-chain design. The residues changed from the original sequence by the design are denoted with characters: the P-loop was built at the residue positions 151–158 with the amino acid sequence GPPGAGKS; the Walker-B motif coordinating magnesium ion was built with Glu248; the nucleotide-binding pocket was made with Ala159 and Ser339. The typical features of P-loops are shown at the left bottom. Orientation: the vector from the Cα atom of the last strand residue immediately before the P-loop to the Cα atom of the conserved Lys points away from the vector from the Cα atom of the same last strand residue to its Cβ atom. Backbone torsion pattern: the residues in P-loops have the typical backbone torsion pattern, represented by ABEGO torsion bins in conformational space defined using φ/ψ backbone dihedral angles: EBBGAGAA (the torsion bins A and B are the α-helix and β-sheet regions; G and E are the positive φ regions). Amino acid sequence: the P-loop is identified by the conserved sequence GX1X2X3X4GK(T/S). In addition, this motif has an additional conserved residue Gly at X3, indicated by a star. The torsion pattern and amino acid sequence logos were created by WebLogo.
Fig. 3
Fig. 3. Nucleotide binding to the designed sites, revealed by crystal structures.
a,b, Solved crystal structures viewed from the C-terminal domain of the A subunit and the designed B subunit: A3(De)3 complex structure in the absence of nucleotides (2.8 Å resolution) (a); A3(De)3 complex structure bound to three ADPs in the catalytic interfaces and two ADPs in the designed non-catalytic interfaces (3.2 Å resolution) (b). ADP molecules are shown as spheres. c,d, Superposition of the computational design model of the designed B subunit (white) and the solved crystal structure in the absence of nucleotides (pink) (chain D of A3(De)3_empty was used because this had the highest resolution data of the three designed B subunits): comparison for the entire backbone (the Cα r.m.s.d. calculated by MICAN is 1.48 Å) (c); comparison for the designed binding site (d). The backbone geometry of the designed P-loop was almost identical to that of the design model. e, The interface between chains C and D in A3(De)3_(ADP·Pi)1cat(ADP)2cat,2non-cat. The designed P-loop (green) firmly grabs the phosphate group of ADP. The sugar and base of ADP were found at the interface with the A subunit (cyan). The Fo − Fc omit map at 3.0σ obtained by removing ADP and Mg2+ from the model is shown in mesh representation. A stereo view is shown in Supplementary Fig. 8. f,g, Structural comparison for the ATP-binding mode between the computational design model (f) and the solved crystal structure (g) (chain D in A3(De)3_(ADP·Pi)1cat(ADP)2cat,2non-cat). Oxygen, nitrogen and phosphate atoms are coloured red, blue and orange, respectively.
Fig. 4
Fig. 4. ATP binding to the designed site accelerates the rotation rate allosterically.
a, A typical rotation time course of the designed V1 (red) and the wild-type V1 (black), at 100 µM ATP. All data for the wild-type V1-ATPase were obtained from ref. . The insets show the rotation x,y trajectory. The angle distributions are shown at the bottom. b, [ATP] dependence of rotation rates for the wild-type (black), the designed V1 (red), the design mutant K157Q (orange) and the design double-mutant K157A/S158A (magenta). The [ATP] at the most accelerated rotation is highlighted in grey. The rates were plotted with averaged values using three molecules or more (Supplementary Table 1) and the error bars represent the s.d. The black lines are the fitted curves to the Michaelis–Menten equation for the wild-type rotation rates. Source data
Fig. 5
Fig. 5. The mechanism of allosteric acceleration, revealed by analysis of rotation sub-steps and solved crystal structures.
a, A close-up rotation time course of the design at 100 µM ATP and the rotation x,y trajectory. The main pause and sub-pause are shown in black and red, respectively. The black dashed and solid horizontal lines show angles for the main pause and sub-pause, respectively. b, Time constants of duration times of the main pause (left) and the sub-pause (right) at different [ATP]s for the wild-type V1 (black), the designed V1 (red) and the design double mutant K157A/S158A (magenta). The time constants were plotted with values obtained by analysing all detected pauses for three molecules and the error bars represent the s.d. See Supplementary Figs. 14 and 15 for distributions of the duration time. Note that for the main pauses at 100–3,000 μM ATP, two different time constants were obtained for each [ATP] assuming consecutive reactions (Supplementary Fig. 14). c, Comparison of A3(De)3_(ADP)3cat,1non-cat (top) and A3(De)3_(ADP)3cat,2non-cat (bottom). The hexameric structures viewed from the C-terminal domain of the A and B subunits (left) and the structures of the catalytic interfaces viewed from side (right) are shown for closed and open-like conformations, respectively. ADP molecules are shown as red spheres. d, Structure-based interpretation of the facilitated ADP release by the allosteric effect. Ellipses indicate the A subunits (cyan) and designed B subunits (pink). Nucleotides are shown by red (or pink) circles. Source data
Extended Data Fig. 1
Extended Data Fig. 1. Fo-Fc omit maps for ligand molecules in A3(De)3_(ADP·Pi)1cat(ADP)2cat,2non-cat.
At the chain A (a), B (b), C (c), D (d), and E (e) in A3(De)3_(ADP·Pi)1cat(ADP)2cat,2non-cat, the Fo-Fc omit map at 3.0σ for ligand molecules are shown in green mesh. The A- and B-subunit are colored by cyan and pink, respectively.
Extended Data Fig. 2
Extended Data Fig. 2. Fo-Fc omit maps for ligand molecules in A3(De)3_(ADP)3cat,1non-cat or A3(De)3_(ADP)3cat,2non-cat.
At the chain A (a), B (b), C (c), D (d), G (e), H (f), I (g), J (h), and L (i) in A3(De)3_(ADP)3cat,1non-cat or A3(De)3_(ADP)3cat,2non-cat, the Fo-Fc omit maps at 3.0σ for ligand molecules are shown in green mesh. The A- and B-subunit are colored by cyan and pink, respectively. For the chain B, G and L, the Fo-Fc omit maps at 2.8σ are also shown to identify position of the molecules more clearly; the omit maps expand along the molecule shape by including the lower density value.

Similar articles

Cited by

References

    1. Monod J, Wyman J, Changeux J-P. On the nature of allosteric transitions: a plausible model. J. Mol. Biol. 1965;12:88–118. doi: 10.1016/S0022-2836(65)80285-6. - DOI - PubMed
    1. Boyer PD. The ATP synthase—a splendid molecular machine. Annu. Rev. Biochem. 1997;66:717–749. doi: 10.1146/annurev.biochem.66.1.717. - DOI - PubMed
    1. Zeqiraj E, van Aalten DM. Pseudokinases—remnants of evolution or key allosteric regulators? Curr. Opin. Struct. Biol. 2010;20:772–781. doi: 10.1016/j.sbi.2010.10.001. - DOI - PMC - PubMed
    1. Ribeiro AJM, et al. Emerging concepts in pseudoenzyme classification, evolution, and signaling. Sci. Signal. 2019;12:eaat9797. doi: 10.1126/scisignal.aat9797. - DOI - PubMed
    1. Wang, J. et al. Ligand-triggered allosteric ADP release primes a plant NLR complex. Science364, eaav5868 (2019). - PubMed

Publication types

Substances