. 2023 Jul;29(7):1760-1774.
doi: 10.1038/s41591-023-02414-4. Epub 2023 Jul 6.

SARS-CoV-2-specific immune responses and clinical outcomes after COVID-19 vaccination in patients with immune-suppressive disease

Collaborators, Affiliations

SARS-CoV-2-specific immune responses and clinical outcomes after COVID-19 vaccination in patients with immune-suppressive disease

Eleanor Barnes et al. Nat Med. 2023 Jul.

Abstract

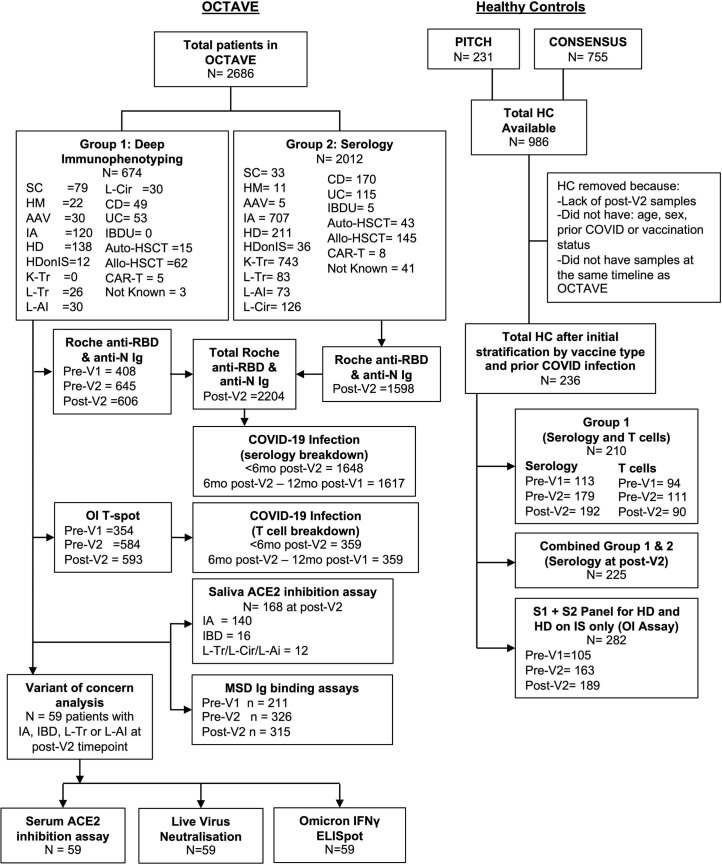
Severe acute respiratory syndrome coronavirus 2 (SARS-CoV-2) immune responses and infection outcomes were evaluated in 2,686 patients with varying immune-suppressive disease states after administration of two Coronavirus Disease 2019 (COVID-19) vaccines. Overall, 255 of 2,204 (12%) patients failed to develop anti-spike antibodies, with an additional 600 of 2,204 (27%) patients generating low levels (<380 AU ml-1). Vaccine failure rates were highest in ANCA-associated vasculitis on rituximab (21/29, 72%), hemodialysis on immunosuppressive therapy (6/30, 20%) and solid organ transplant recipients (20/81, 25% and 141/458, 31%). SARS-CoV-2-specific T cell responses were detected in 513 of 580 (88%) patients, with lower T cell magnitude or proportion in hemodialysis, allogeneic hematopoietic stem cell transplantation and liver transplant recipients (versus healthy controls). Humoral responses against Omicron (BA.1) were reduced, although cross-reactive T cell responses were sustained in all participants for whom these data were available. BNT162b2 was associated with higher antibody but lower cellular responses compared to ChAdOx1 nCoV-19 vaccination. We report 474 SARS-CoV-2 infection episodes, including 48 individuals with hospitalization or death from COVID-19. Decreased magnitude of both the serological and the T cell response was associated with severe COVID-19. Overall, we identified clinical phenotypes that may benefit from targeted COVID-19 therapeutic strategies.


Conflict of interest statement

E.B. consults for AstaZeneca, Roche and Vaccitech and has patents in ChAdox1 HBV and HCV vaccines. I.B.M. receives consulting fees and honoraria from AbbVie, AstraZeneca, Bristol Myers Squibb, Boehringer Ingelheim, Cabaletta, Causeway Therapeutics, Celgene, Evelo, Gilead, Janssen, Pfizer, Novartis, Eli Lilly, Moonlake and UCB Pharma and research support from Bristol Myers Squibb, Boehringer Ingelheim, Celgene, Janssen, Novartis and UCB Pharma. C.S.G. has received research grants from AstraZeneca but unrelated to any of the work described in this manuscript. Furthermore, the funder had no specific role in the conceptualization, design, data collection, analysis, decision to publish or preparation of the manuscript. P. Klenerman was part of an advisory board for AstraZeneca for work unrelated to vaccines. L.L. acted as a paid advisor to Pfizer and AstraZeneca for work unrelated to vaccines and was on an advisory board for AstraZeneca for pre-exposure prophylaxis. L.L. is a Trustee of Kidney Research UK and is associated with the UK Kidney Association. The authors declare no other relevant conflicts of interest. The OCTAVE study group comprises investigators, sub-investigators and clinical trial staff. The PITCH consortium comprises investigators and sub-investigators in the UK Department of Health and Social Care-funded study.

Figures

Fig. 1
Fig. 1. Anti-SARS-CoV-2 RBD total Ig responses in whole OCTAVE cohort at post-V2 timepoint.
a, Proportion of group 1 and group 2 non (<0.8 AU ml−1), low (<380 AU ml−1) and high (>380 AU ml−1) anti-SARS-CoV-2 spike RBD total Ig responses. Statistical comparisons of the proportion of low and no versus high response and no versus low and high response in disease groups compared to healthy controls are presented. b, Magnitude of serological response in disease groups and healthy controls. Statistical comparisons comparing disease group to healthy controls are presented. c, Anti-SARS-CoV-2 spike RBD total Ig responses comparing previously infected with infection-naive patents. Statistical comparison of infection-naive individuals and previously infected individuals within each group is presented. d, Anti-SARS-CoV-2 spike RBD total Ig responses separated by vaccine type. Statistical comparison of vaccine type in each disease group is presented. Unpaired statistical comparison was made on all groups using a two-sided Kruskal–Wallis with post hoc Dunn’s testing. Comparisons of proportions were performed using χ2 or Fisher’s exact tests adjusted for significance using Bonferroni correction (adjusted alpha = 0.003). Only significant comparisons are presented. * indicates statistically significant by Bonferroni-adjusted alpha. Boxes represent median and IQR; whiskers represent ±1.5× IQR. AAV, ANCA-associated vasculitis; CD, Crohn’s disease; HC, healthy controls; HD, hemodialysis; HD on IS, hemodialysis on immunosuppression; HM, hemotological malignancy; IA, inflammatory arthritis; L-AI, autoimmune hepatitis; L-Cir, liver cirrhosis; L-Tr, liver transplant; SC, solid cancer; UC, ulcerative colitis.
Fig. 2
Fig. 2. Serological responses to CCCs and SARS-CoV-2 VOCs after vaccination.
a, Anti-SARS-CoV-2 RBD-binding total Ig before first vaccine (pre-V1) and before (pre-V2) and after (post-V2) second vaccine in group 1 participants. b, Anti-SARS-CoV-2 spike binding IgG, IgM and IgA assessed at all available timepoints. IgG was assessed in all group 1 participants; IgM and IgA were assessed in group 1 participants in the UC, CD, L-Tr, L-AI, L-Cir, IA and ANCA-associated vasculitis disease groups. Lines indicate threshold for seropositivity. c, Spearman’s correlation of anti-HCoV-OC43 spike IgG at pre-V1 compared to pre-V2 anti-SARS-CoV-2 full-spike IgG assessed in all group 1 participants. d, Serum IgG binding to SARS-CoV-2 VOC spike at post-V2 timepoint. e,f, Inhibition of SARS-CoV-2 VOC spike binding to hACE2 by participant serum (e) or saliva (f) at post-V2 timepoint. g,h, Microneutralization of live ancestral or omicron BA.1 SARS-CoV-2 at the post-V2 timepoint (h). Correlation of microneutralization IC50 with ancestral anti-SARS-CoV-2 RBD-binding total Ig (g) and microneutralization IC50 separated by previous SARS-CoV-2 infection status. d,e,g,h, n = 59 participants selected from liver and inflammatory disease groups with anti-SARS-CoV-2 RBD total Ig above 250 AU ml−1. f, n = 168 participants selected from inflammatory and liver disease groups. df, Lines represent median and IQR. Paired statistical comparisons among multiple groups (df,h) were assessed using two-sided Friedman’s test with Dunn’s correction or Wilcoxon’s rank-sum test with Bonferroni correction. Unpaired statistical comparisons among multiple groups were assessed using two-sided Mann–Whitney U-test with Bonferroni correction. *P < 0.05, **P < 0.01, ***P < 0.001, ****P < 0.0001. AAV, ANCA-associated vasculitis; CD, Crohn’s disease; HC, healthy controls; HD, hemodialysis; HD on IS, hemodialysis on immunosuppression; HM, hematological malignancy; IA, inflammatory arthritis; L-AI, autoimmune hepatitis; L-Cir, liver cirrhosis; L-Tr, liver transplant; MNA, microneutralization; Nucleocapsid negative, N-ve; Nucleocapsid positive, N+ve; NS, not significant; SC, solid cancer; V1, COVID-19 vaccine dose 1; V2, COVID-19 vaccine dose 2; UC, ulcerative colitis.
Fig. 3
Fig. 3. T cell responses to ancestral and Omicron BA.1 SARS-CoV-2 after vaccination.
a,b, IFNγ T cell response to SARS-CoV-2 spike measured by Oxford Immunotec assay presented as the proportion of individuals with or without an anti-SARS-CoV-2 spike T cell response (a) and the magnitude of IFNγ T cell response in disease groups (n = 645) and healthy controls (n = 189) (b). a,b, The statistical comparison presented is disease group compared to healthy controls (HC) in all participants in group 1. c,d, IFNγ T cell response to ancestral and Omicron BA.1 spike or pools of peptides covering regions mutated in BA.1 and their ancestral equivalents, measured by in-house IFNγ ELISpot at post-V2 timepoint (n = 59 participants selected from liver, rheumatic and inflammatory disease cohorts). eh, Selected examples of the correlation of anti-SARS-CoV-2 RBD binding total Ig with IFNγ T cell response to ancestral SARS-CoV-2 spike at pre-V2 (e,g) and post-V2 (f,h) timepoints in group 1 (all disease groups) (e,f) and ANCA-associated vasculitis on rituximab patients (g,h). Unpaired statistical comparisons (b,c,d) were assessed with a Kruskal–Wallis test with post hoc Dunn’s testing (adjusted alpha = 0.003). Paired statistical tests were performed with two-sided Wilcoxon’s rank-sum test with Bonferroni correction (adjusted alpha = 0.0125). ac, * indicates statistically significant by Bonferroni-adjusted alpha. ***adjusted P < 0.001, ****adjusted P < 0.0001. eh, Correlations are Spearman’s rank-sum correlation, and fitted line is presented. b, Boxes represent median and IQR; whiskers represent ±1.5× IQR. AAV, ANCA-associated vasculitis; CD, Crohn’s disease; CLD, chronic liver disease; HD, hemodialysis; HD on IS, hemodialysis on immunosuppression; HM, hematological malignancy; IA, inflammatory arthritis; L-AI, autoimmune hepatitis; L-Cir, liver cirrhosis; L-Tr, liver transplant; Nucleocapsid negative, N-ve; Nucleocapsid positive, N+ve; NS, not significant; RC, rheumatic conditions; SC, solid cancer; UC, ulcerative colitis.
Fig. 4
Fig. 4. Predictors of anti-SARS-CoV-2 spike antibody and T cell responses after two doses of COVID-19 vaccine.
Forest plot of multivariable logistic regression model fitted on post-V2 anti-SARS-CoV-2 RBD-binding total Ig antibody (whole group 1 and group 2 (n = 2,204) and matched healthy controls (n = 225)) (a) and IFNγ T cell responses (group 1 (n = 645) and matched healthy controls (n = 189)) (b). OR of anti-SARS-CoV-2 RBD-binding total Ig >380 AU ml−1 (a) and OR of anti-SARS-CoV-2 spike IFNγ T cell response ≥4 SFCs per 106 PBMCs (b). Center of error bars represents OR, and whiskers represent 95% CI. P values are outputs of multivariable logistic regression model. P < 0.05 is significant and marked with blue lines. AAV, ANCA-associated vasculitis; CD, Crohn’s disease; DMARDs, disease-modifying anti-rheumatic drugs; HD, hemodialysis; HD on IS, hemodialysis on immunosuppression; HM, hematological malignancy; IA, inflammatory arthritis; L-AI, autoimmune hepatitis; L-Cir, liver cirrhosis; L-Tr, liver transplant; OSFC, zero spot forming cells; SC, solid cancer; UC, ulcerative colitis; wks, weeks.
Fig. 5
Fig. 5. SARS-CoV-2 infection and severity after COVID-19 vaccination.
a,b, COVID-19 incidence-free progression over time after second vaccine and infection rate per 1,000 double-vaccinated days, split by post-V2 anti-SARS-CoV-2 RBD-binding total Ig responder status (n = 1,617) (a) and post-V2 IFNγ T cell response to SARS-CoV-2 spike (n = 359) (b). Total number (c,e) and proportion (d,f) of SARS-CoV-2 infections stratified by COVID-19 disease severity and SARS-CoV-2 RBD-binding total Ig (n = 440)(c,d) or SARS-CoV-2 spike IFNγ T cell (n = 98) (e,f) response status. Severity data are shown at 6-month post-V2 and 12-month post-V1 timepoints and both timepoints combined, including only patients with known infection severity. g,h, Magnitude of post-V2 SARS-CoV-2 RBD-binding total Ig (n = 2,191) (g) and SARS-CoV-2 spike IFNγ T cell response (n = 573) (h) stratified by COVID-19 infection/severity—includes all non-hospitalized individuals with or without SARS-CoV-2 infection (infected and uninfected, non-hospitalized) and infected individuals who were not hospitalized with COVID-19 (infected, non-hospitalized) and individuals who were hospitalized or died with COVID-19 (infected, hospitalized). Fisher’s exact tests (d,f) or two-sided Mann–Whitney rank-sum statistical tests (g,h) were used without correction for multiple comparisons. a,b, Lines represent COVID-19-free progression, and shading represents 95% CI. g,h, Boxes represent median and IQR; whiskers represent ±1.5× IQR. *P < 0.05, ****P < 0.0001. Ab, anti-SARS-CoV-2 RBD-binding total Ig; Hosp–Oxygen, hospitalized with COVID-19 and required oxygen; Hosp–No Oxygen, hospitalized with COVID-19 but did not require oxygen; mo, month.
Extended Data Fig. 1
Extended Data Fig. 1. Recruitment and analysis overview of OCTAVE and healthy control groups.
Recruitment and analysis overview of OCTAVE and HC participants. MSD = MesoScale Discovery, Ig = Immunoglobulin, S = Spike, RBD = Receptor binding domain, N = Nucleocapsid.
Extended Data Fig. 2
Extended Data Fig. 2. Binding IgA, IgG and IgM to SARS-CoV-2 Spike receptor binding domain (RBD) and N- terminal domain (NTD) measured by MSD assay.
Binding IgA, IgG and IgM to SARS-CoV-2 Spike (a) receptor binding domain (RBD) and (b) N-terminal domain (NTD) measured by MSD assay. IgG in all patients in group 1 at all available timepoints, IgA and IgM in all timepoints from all group 1 participants in the IA, AAV, IBD, L-Tr, L-AI and L-Cir disease groups at the pre-V1 (Pre-V1), pre-V2 (Pre-V2) and post-V2 (Post V2) timepoints. Two-sided Mann-Whitney U test corrected for multiple comparisons by Bonferroni correction. * = adjusted P value < 0.05, ** adjusted P value < 0.01, ****adjusted P value < 0.0001. Boxes represent median and IQR, whiskers represent +/- 1.5x IQR.
Extended Data Fig. 3
Extended Data Fig. 3. Correlation of vaccine induced IgG with baseline common cold coronavirus antibodies.
Correlation plot of pre first vaccine (Pre-V2) and post second vaccine (Post-V2) anti- SARS-CoV-2 Spike binding IgG (MSD Assay) against baseline (Pre-V1) common cold coronavirus spike IgG, IgA and IgM antibodies. IgG data collected at baseline, Pre-V2 and Post-V2 in all participants in group 1. IgM and IgA collected in all group 1 participants in the UC, CD, L-Tr, L-AI, L-Cir, IA and AAV disease groups. Includes HCoV’s – 229E, HKU1, NL63 and OC43. Pearson correlation. *P < 0.05, **P < 0.01.
Extended Data Fig. 4
Extended Data Fig. 4. Correlation of post- second vaccine immune assay responses.
Correlation plot of all assays used to evaluate serological and cellular responses on the 59 group 1 participants with deep immunophenotyping at the Post-V2 timepoint. Spearman rank sum test used. R2 depicted by area of circle and colour legend. * P value < 0.05; ** P value < 0.01, ***; P value < 0.001.
Extended Data Fig. 5
Extended Data Fig. 5. Correlation of serum and salivary inhibition of ACE2 binding.
Spearman rank sum correlation of % inhibition of ACE2 by serum and saliva Ig at the post-V2 in immunocompromised individuals (n = 54).
Extended Data Fig. 6
Extended Data Fig. 6. Correlation of anti-RBD Ig titre against full- Spike IFNy ELISpot magnitude at the pre- and post-V2 timepoints in OCTAVE subgroups.
anti-SARS-CoV-2 RBD Ig titre (Roche assay) plotted against full- Spike IFNy ELISpot magnitude at the pre- and post-V2 timepoints in OCTAVE subgroups. Solid cancer, Crohn’s disease and Autologous-HSCT show positive correlations at pre-v2 but not post-v2. Inflammatory arthritis and liver cirrhosis sub-groups showed no significant correlation pre-V2 but showed weak positive correlation post-V2. Pearson correlations taken at each timepoint and individual sub-group.
Extended Data Fig. 7
Extended Data Fig. 7. Multivariable logistic regression model presenting odds ratio of anti-SARS-CoV-2 RBD non- responsiveness after two COVID-19 vaccine doses.
Forest plot depicting the outcome of a multivariable logistic regression model, presenting the odds ratio of non-response as measured by a Roche anti-RBD Ig titre of <0.8 AU/mL. All individuals in group 1 and group 2 with post-V2 serological titre included, except L-Cirr, UC, and CD groups which had no non-responders and therefore were not included in analysis. N = 1821 in disease group and n = 225 matched healthy controls.
Extended Data Fig. 8
Extended Data Fig. 8. Correlation of Oxford Immunotec T-Spot SARS-CoV-2 spike peptide pools.
Exploratory scatter plot to show correlation between the ELISpot Spike 1 + 2 & Full Spike Assay measures, for all patients with both values available in the Deep Immunophenotyping Group. Presented on the log scale. Pearson’s correlation.

Similar articles

Cited by

References

    1. Haas EJ, et al. Impact and effectiveness of mRNA BNT162b2 vaccine against SARS-CoV-2 infections and COVID-19 cases, hospitalisations, and deaths following a nationwide vaccination campaign in Israel: an observational study using national surveillance data. Lancet. 2021;397:1819–1829. - PMC - PubMed
    1. Pritchard E, et al. Impact of vaccination on new SARS-CoV-2 infections in the United Kingdom. Nat. Med. 2021;27:1370–1378. - PMC - PubMed
    1. Nyberg T, et al. Comparative analysis of the risks of hospitalisation and death associated with SARS-CoV-2 omicron (B.1.1.529) and delta (B.1.617.2) variants in England: a cohort study. Lancet. 2022;399:1303–1312. - PMC - PubMed
    1. Office for National Statistics. People with long-term health conditions, UK: January to December 2019. https://www.ons.gov.uk/peoplepopulationandcommunity/healthandsocialcare/... (2020).
    1. Marjot T, et al. Outcomes following SARS-CoV-2 infection in patients with chronic liver disease: an international registry study. J. Hepatol. 2021;74:567–577. - PMC - PubMed

Publication types