. 2023 Jul;29(7):1821-1831.
doi: 10.1038/s41591-023-02430-4. Epub 2023 Jul 6.

A prognostic risk score for development and spread of chronic pain

Collaborators, Affiliations

A prognostic risk score for development and spread of chronic pain

Christophe Tanguay-Sabourin et al. Nat Med. 2023 Jul.

Abstract

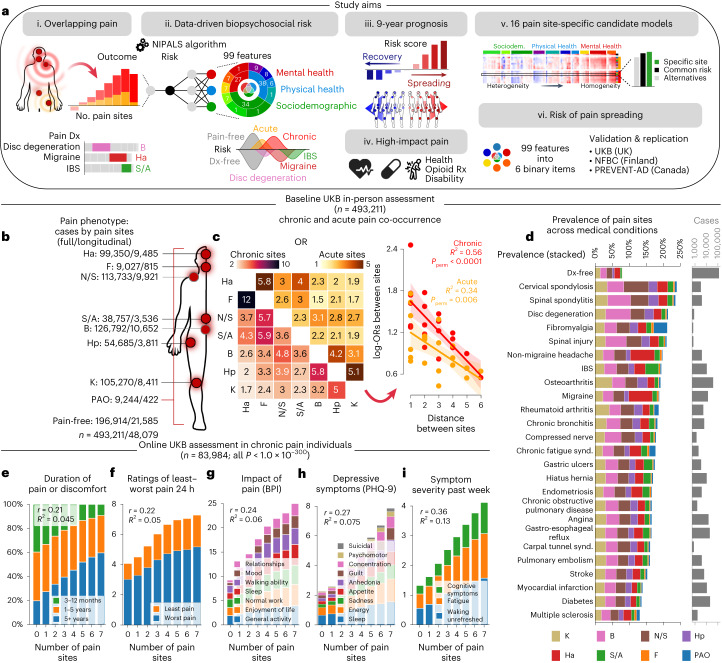
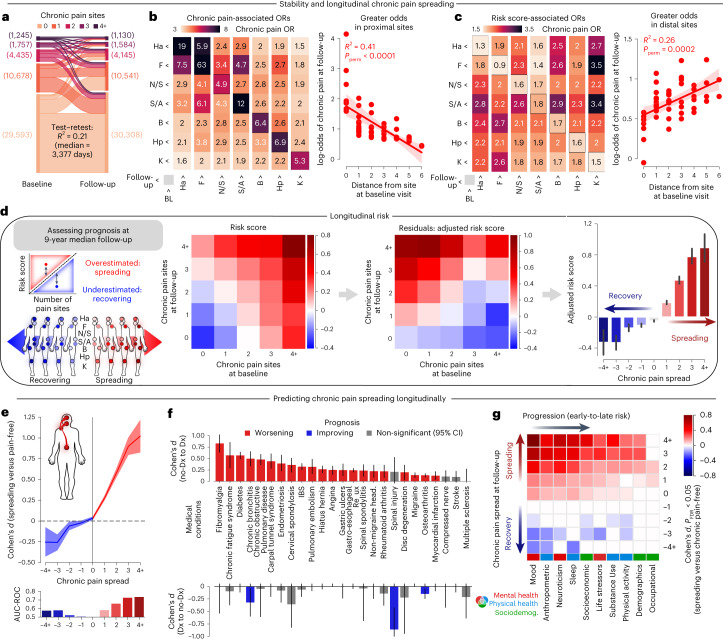
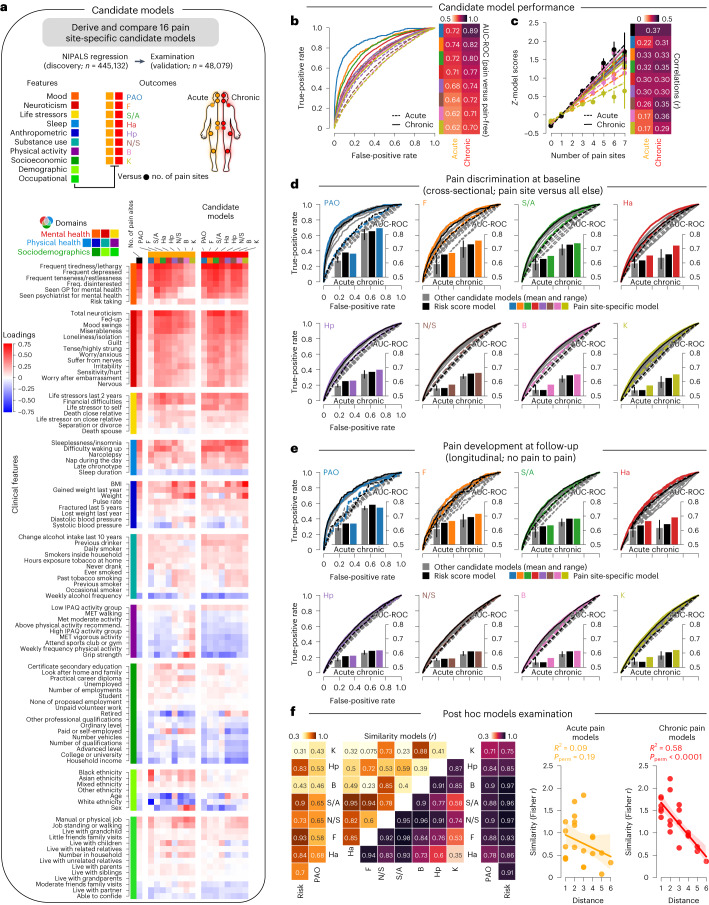
Chronic pain is a complex condition influenced by a combination of biological, psychological and social factors. Using data from the UK Biobank (n = 493,211), we showed that pain spreads from proximal to distal sites and developed a biopsychosocial model that predicted the number of coexisting pain sites. This data-driven model was used to identify a risk score that classified various chronic pain conditions (area under the curve (AUC) 0.70-0.88) and pain-related medical conditions (AUC 0.67-0.86). In longitudinal analyses, the risk score predicted the development of widespread chronic pain, the spreading of chronic pain across body sites and high-impact pain about 9 years later (AUC 0.68-0.78). Key risk factors included sleeplessness, feeling 'fed-up', tiredness, stressful life events and a body mass index >30. A simplified version of this score, named the risk of pain spreading, obtained similar predictive performance based on six simple questions with binarized answers. The risk of pain spreading was then validated in the Northern Finland Birth Cohort (n = 5,525) and the PREVENT-AD cohort (n = 178), obtaining comparable predictive performance. Our findings show that chronic pain conditions can be predicted from a common set of biopsychosocial factors, which can aid in tailoring research protocols, optimizing patient randomization in clinical trials and improving pain management.


Conflict of interest statement

The authors declare no competing interests.

Figures

Fig. 1
Fig. 1. Phenotyping pain in the UK Biobank.
a, Schematic showing the study workflow. IBS, irritable bowel syndrome; Dx, diagnosis; S/A, stomach or abdominal; B, back; Ha, headache; Rx, prescription; UKB, UK Biobank; NFBC, Northern Finland Birth Cohort; Sociodem., sociodemographic. b, Anatomical body map of pain sites and counts of pain cases (combined acute and chronic) for the full sample and for individuals with a follow-up visit 9 years later (in-person assessment). F, facial; N/S, neck or shoulder; Hp, hip; K, knee; PAO, pain all over. c, Odds ratios (ORs) of co-occurrence between pain sites (chronic on the left and acute on right) at baseline. The log-OR of co-occurring pain between two sites were negatively associated with their distances in chronic (Pperm < 0.0001) and acute pain (Pperm = 0.006, using 10,000 two-sided permutation (perm) tests). The 95% confidence interval (CI) estimated across 1,000 bootstrap samples is shown. d, The prevalence of pain is shown per body site among noncancer medical conditions commonly associated with chronic pain and the count of cases reported. ei, In the online assessment pain questionnaire in chronic pain individuals, the number of coexisting pain sites (0 indicates no major sites) was associated (two-sided Pearson’s r correlations, all P < 1.0 × 10−300) with the duration or discomfort of pain (e), rating of the least and worst pain out of 10 in the last 24 h (f), interference of pain across seven dimensions (g), depressive symptom severity in last 2 weeks (h) and symptom severity during the last week (i). BPI, brief pain inventory; PHQ, patient health questionnaire.
Fig. 2
Fig. 2. A multivariate model classifying and predicting different pain conditions.
a, Classification of 99 clinical features grouped in three domains and ten categories. b, Venn diagram and bar graph show the model’s explained variance (R2) (ordered based on discovery results) in the number of pain sites across the three domains. c, The variance explained is shown for the ten categories and the category contributing the least was compared to a null model generated from 10,000 permutations. d, The model performance is shown in the testing set (validation data) using explained variance and root mean squared error (RMSE) for acute and chronic pain conditions separately (nchronic = 17,948; nacute = 13,117). Mean estimated across number of sites ± s.e.m. are shown. e, Cohen’s d effect sizes in the risk score for each pain site (acute in orange and chronic in red) compared to pain-free individuals. f, The diagnostic ability of our model to classify acute and chronic pain conditions is displayed using the AUC-ROC. g, The diagnostic ability of our model to classify the selected medical conditions is displayed using Cohen’s d and measured with AUC-ROC (selected Dx compared to Dx-free individuals). The 95% CI estimated across 1,000 bootstrap samples is shown. *PAO was excluded from model training in the discovery set. Dx, diagnoses.
Fig. 3
Fig. 3. Forecasting the spreading and recovery of chronic pain.
a, Test–retest variance explained (R2) in the number of chronic pain sites (4+ including PAO) between baseline and the follow-up visit. b, Odds of reporting chronic pain sites at baseline and the follow-up visit depended on the distance on the body map (Pperm < 0.0001). c, Our risk score, however, increased the odds of reporting pain at distal sites (Pperm = 0.0002, using 10,000 two-sided permutation tests). The 95% CI estimated across 1,000 bootstrap samples is shown. d, The matrices display the risk score depending on the changes in the number of chronic pain sites before (left matrix) and after (right matrix) adjusting linearly and exponentially for the number of chronic pain sites initially reported at baseline, age and years of follow-up. A negative-adjusted risk score was associated with recovery and a positive-adjusted risk score was associated with spreading of chronic pain. Means and s.e.m. are shown. e, The diagnostic capacities of our adjusted risk score for recovering and spreading was tested using Cohen’s d effect size (presented as mean ± s.e.m. estimated from 10,000 bootstrap samples) and AUC-ROC discrimination when compared to chronic pain-free participants. f, The same approach was conducted for diagnoses of medical conditions using Cohen’s d effect sizes (presented as mean ± s.e.m. estimated from 10,000 bootstrap samples). g, The order of progression between the pain determinants was determined using Cohen’s d in each category after controlling for multiple comparison. The factors are ordered depending on their importance in spreading and recovery. Early factors showed significant differences between small changes in chronic pain (for example, pain +1 or −1 site), whereas late factors only showed differences between large changes in chronic pain. FDR, false discovery rate.
Fig. 4
Fig. 4. Predicting secondary outcomes associated with high-impact pain.
a, Schematic of secondary outcomes examined: health ratings, opioid medications and disability and/or sickness. b, Cross-sectional performance of the risk score on secondary outcomes. Cohen’s d effect sizes and explained variance (R2, on the left with P estimated using a two-sided Pearson’s r correlations) were used across self-reported ratings of overall health ratings while Cohen’s d and AUC-ROC discriminations were used for opioid medication use and inability to work due to sickness or disability in the validation data. c, Longitudinal prognosis of secondary outcomes at about 9 years follow-up predicted from the risk score at baseline. Cohen’s d and AUC-ROC were measured in worsening at follow-up (left in red) and improvement (right in blue). P obtained using a two-sided unequal variance t-test (Welch’s approximation). Sample sizes are included in parenthesis. ATC, Anatomical Therapeutic Classification; N02A, Opioids ATC Classification.
Fig. 5
Fig. 5. A common risk shared across chronic pain conditions.
a, Schematic describing that a total of 16 site-specific candidate models (for example, acute knee versus all else) were derived cross-sectionally in the discovery set using NIPALS. Feature loadings (Pearson’s r correlation coefficient between features and the models’ scores) are shown in the testing set for each model. IPAQ, International Physical Activity Questionnaire; MET, metabolic equivalent task. b, Candidate models’ capacities to discriminate between the pain sites they were trained on from pain-free individuals are shown using AUC-ROC. c, The risk score derived from each candidate model correlated with number of coexisting pain sites for acute and chronic pain conditions separately (risk scores presented as mean ± s.e.m. estimated from 10,000 bootstrap samples, nchronic = 17,948; nacute = 13,117). d, Cross-sectional discrimination for each pain site in acute (dashed line) and chronic (full line) pain conditions against the rest of the testing cohort (pain-free and other pain sites) using the model specific to the site (in color), to the number of pain sites (black) and to other candidate models trained on different pain sites (gray). e, The same analyses were performed in the longitudinal data to predict the development of chronic pain in pain-free individuals about 9 years later. f, Post hoc analyses show that similarities between the feature loadings the different models (Fisher-normalized) can be explained (R2) by the distance between the sites in chronic (Pperm < 0.0001), but not acute pain conditions (Pperm = 0.19, using 10,000 two-sided permutation tests). The 95% CI estimated across 1,000 bootstrap samples is shown.
Fig. 6
Fig. 6. The risk of pain spreading screening.
a, Schematic describing the steps implemented to develop the ROPS on 459,855 participants. b, Core selected features retained and binarized to form a six-item short score capturing 63% of the variance explained by the full risk score predicting the number of pain sites. c, Model performance on the testing set for the number of pain sites in both acute and chronic pain sites in the cross-sectional (nchronic = 17,948, nacute = 13,117) and longitudinal data and with pain intensity during the online assessment. d, In the online pain assessment, the ROPS was associated with the interference of pain, symptom severity during the last week and the depressive symptoms severity in last 2 weeks (nROPS:0 = 9,794, nROPS:1 = 18,460, nROPS:2 = 20,102, nROPS:3 = 16,489, nROPS:4 = 10,423, nROPS:5 = 4,349 and nROPS:6 = 911). eh, These results were replicated in independent cohorts including the NFBC cohort (using equivalent score items, longitudinal-only sample, n = 4,710) and the PREVENT-AD cohort (using identical score items). Hd, hand; A, arm; Ft, feet; C, chest; L, leg; GAI, geriatric anxiety scale; GDS, geriatric depression scale. In the NFBC, the ROPS predicted the number of pain sites and classified different pain conditions in both cross-sectional (n = 5,525) (nchronic = 1,489; nacute = 2,374) and longitudinal data (n = 4,710) with similar accuracy as in the UKB (e). The ROPS determined impact, working disability and depressive mood in the NFBC cohort (nROPS:0 = 334, nROPS:1 = 413, nROPS:2 = 408, nROPS:3 = 344, nROPS:4 = 184, nROPS:5 = 62 and nROPS:6 = 12) (f). In the PREVENT-AD cohort, the ROPS predicted the number of pain sites and classified different pain conditions in cross-sectional data (g). The ROPS determined sensory and affective pain measured with the MPQ, anxiety and depressive mood (nROPS:0 = 13, nROPS:1 = 29, nROPS:2 = 12, nROPS:3 = 22, nROPS:4 = 8 and nROPS:5 = 2) (h). Box plots show the medians and are bound by the first and third quartiles. Data points outside 1.5 × interquartile range are shown as diamonds. PAO in both replication cohorts was defined as pain in five or more sites. The 95% CI was estimated across 1,000 bootstrap samples (c,e,g). In boxplots, the center line (median), white dot (mean), box (inner quartiles), whiskers (bottom and top bounds) and diamonds (outliers outside 1.5 × interquartile range) are shown. MSK, musculoskeletal. *Longitudinal data had a different n than the whole sample.
Extended Data Fig. 1
Extended Data Fig. 1. Online UK Biobank assessment of the experience of pain.
a. Demographics of participants across sex, ethnicity and age. b. Pain reported in the past 3 months (chronic pain, > 3 months) for single and multi-site pain. c. High-resolution representation of anatomical body map sites and counts across a total of 13 sites: 10 along the medial line, 2 along the lateral line (shoulder to arm-hand) and 1 not localized (widespread). PAO, pain all over; Ha, headache; Fc, facial; N/S, neck or shoulder; C, chest; S/A, stomach or abdominal; B, back; Hp, hip; L, leg; K, knee; Ft, feet; A, arm; Hd, hand. d. Cross-sectional analysis of co-existing pain and pain ratings. Odds ratios (OR) of co-occurrence between sites in the past 3 months (left diagonal, yellow) and Pearson’s r correlations between pain ratings in the last 24 hours (right diagonal; green). Both the log- normalized OR of pain sites (Pperm < 0.0001) and fisher- normalized r correlations (Pperm < 0.0001, using 10,000 two-sided permutation tests) were negatively associated with their distance. 95% Confidence interval estimated across 1,000 bootstrap samples is shown. e-f. A total of 14 common chronic pain diagnoses were included. e. Counts of diagnoses across the entire online assessment and the prevalence of those reporting pain or discomfort in the past 3 months. No Dx includes those without any of the 14 diagnoses. f. Pain prevalence and mean pain ratings (10, as bad as you can imagine) across each diagnosis stacked across body sites.
Extended Data Fig. 2
Extended Data Fig. 2. Discovery and Validation data for the risk score development.
Pie charts displaying a. demographics, b. acute (≤3 months) and c. chronic (>3 months) pain phenotypes for the discovery data the model is trained on and the validation data the model is tested on, at baseline and follow-up. d. Years between baseline and follow-up visit in the validation data (9 years median). e. Schematic on using NIPALS to predict co-existing pain from biopsychosocial features. f. Model specification based on tenfold cross-validation by minimizing the root mean squared error (RMSE) and maximizing the explained variance (R2) average across tenfolds. Following the scree plot (elbow rule) criterion and to minimize overfitting, 3 components were selected. g. Random stratified sampling of 200 participants projected across the 3 components separately and combined as our risk score.
Extended Data Fig. 3
Extended Data Fig. 3. Model interpretation and performance in the discovery data.
a–g. Identical analyses conducted in the original discovery from which the model was derived (see Fig. 2). a. Classification of 99 clinical features grouped in three domains and ten categories. b. Venn diagram and bar graph show the model’s explained variance (ordered based on discovery results) in the number of pain sites across the three domains c. The variance explained is shown for the ten categories d. The model performance is shown in the training set (that is, discovery data) using explained variance (R2) and Root Mean Squared Error (RMSE) for acute and chronic pain conditions separately (n Chronic = 196,706, n Acute = 126,313). Mean estimated across number of sites +/-standard errors are shown. e. Cohen’s d effect sizes in the risk score for each pain site (acute in orange and chronic in red) compared to pain-free individuals. f. The diagnostic ability of our model to classify acute and chronic pain conditions is displayed using AUC-ROC. AUC, area under the curve; ROC, receiver operating characteristic. g. The diagnostic ability of our model to classify the selected medical conditions is displayed using Cohen’s d and measured with AUC-ROC (selected Dx compared to Dx-free individuals). Error bars estimated from 10,000 bootstrap resampling are shown. *Pain all over the body was excluded from model training in the discovery set. Dx, diagnoses.
Extended Data Fig. 4
Extended Data Fig. 4. Model features and model integration through network analysis.
a. Model feature weights projected to the risk score. Error distributions estimated across 1,000 bootstrap samples are shown. b. Schematic of a network approach to integrate the risk model’s categories. Edges and nodes were evaluated using strength of partial correlation and weighted node centrality. LS, life stressors; N, neuroticism; M, mood; SU, substance use; S, sleep; PA, physical activity; A, anthropometric; SE, socioeconomic; O, occupational; D, demographic. c. Schematic of the network analysis approach examining the centrality of each category and its connections across thresholds. d. Partial correlation network analyses across three levels: sparse (absolute partial correlation above 0.1), intermediate (above 0.05) and full (all edges) across the discovery data (upper row) and validation data (lower row).
Extended Data Fig. 5
Extended Data Fig. 5. Examination of outcomes associated with high-impact pain in the discovery set.
a. Schematic of a selection of three selected secondary outcomes. ATC, Anatomical Therapeutic Classification; N02A, opioids ATC Classification b. Cross-sectional performance of the risk score on the secondary outcomes in the discovery data. Cohen’s d effect sizes and explained variance (R2, on the left) were used across self-reported ratings of overall health ratings while Cohen’s d and AUC-ROC discriminations were used for opioid medication use and inability to work due to sickness or disability. Cohen’s d effect sizes and AUC-ROC discriminations were used. Sample sizes are included in parentheses.
Extended Data Fig. 6
Extended Data Fig. 6. Examination of three prospective biological makers and their associations with pain.
a. Schematic describing the selected biological markers: c- reactive inflammatory protein, a polygenic risk score for the number of pain sites, and a validated brain signature for sustained pain. b-e. Genome-wide association study of number of pain sites in the discovery data. b. The Manhattan plot shows association -log10 (P) for each single nucleotide polymorphism. c. The partitioned heritability in tissues of the Benita et al. dataset is shown for 78 tissues grouped into eight tissue classes: central nervous system (CNS), peripheral nervous system (PNS), endocrine (END), myeloid (MYE), B cells (B), T cells (T), adipose (ADI) and muscle (MUS). P-values were FDR-adjusted (10%) for enrichment with significant tissues colored. d. Details shown for the CNS tissue class. e. PRS repeated across an array of thresholds, with the least stringent threshold taken to maximize prediction. Associations between each threshold with the number of pain sites, risk score and CRP is shown and estimated using a two-tailed Pearson’s r correlation (standard error are estimated from 1,000 bootstrap samples). f. Two-tailed Pearson’s r correlation was also used to assess the association between CRP (log- transformed for parametric estimations) and the number of pain sites in both discovery (P < 1.0e-300) and validation (P < 3.4e-83) datasets. g. The association between the selected PRS and the number of pain sites in both discovery (P < 1.0e-300) and validation (P < 5.1e-114) datasets. Ha, headache; F, facial; N/S, neck or shoulder; S/A, stomach or abdominal; B, back; Hp, hip; K, knee. h. Visualization of the absolute connectivity from the Tonic Pain Signature (ToPS) computed from resting-state functional Magnetic Resonance Imaging (rsfMRI) and thresholded for the top 5% of weights. Represents the sum of normalized dynamic conditional correlation connectivity across each brain parcel. PAG, periaqueductal gray; S1, primary somatosensory cortex; S2, secondary somatosensory cortex; L, left; R, right. i. Circular graph representing the links of the computed ToPS across each major brain networks. j. The association between the ToPS (top 5% weights) and the number of pain sites in the validation (P < 5.0e-13) dataset. The Cohen’s d effect sizes for each marker are presented for each pain site compared to pain-free individuals. Comparisons were FDR-corrected (q < 0.05, ns > 0.05).
Extended Data Fig. 7
Extended Data Fig. 7. Inflammatory, genetic, and functional connectivity markers associated with the risk score for pain.
a. Schematic describing the selected biological markers: c- reactive inflammatory protein, a polygenic risk score for the number of pain sites, and a validated brain signature for sustained pain. CRP, C-reactive protein; PRS, polygenic risk score; ToPS, Tonic Pain Signature. b-c. Two-tailed Pearson’s r correlation the association between CRP (log-transformed for parametric estimations) and our risk score in both b. validation set (P < 1.0e-300), and c. discovery set (P < 1.0e-300). d, e. The association between the selected PRS and our risk score in both d. validation set (P < 1.8e-125), and e. discovery set (P < 1.0e-300). f. The association between the ToPS and our risk score in the validation set (P < 2.6e-45). Venn diagram shows the correlation between the biological measures with respect to the three domains and their unions. g. Markers were combined as one variable and examined in the validation set. The respective contribution of biological markers to pain risk score and the number of pain sites are reported in the Venn diagrams.
Extended Data Fig. 8
Extended Data Fig. 8. Deriving candidate models for chronic and acute pain conditions.
a. Schematic describing the 99 features to derive a total of 16 site-specific candidate models cross-sectionally in the discovery set. b. tenFold cross-validation was used to estimate the root mean squared error (RMSE) and explained variance (R2). The same number of components were used to ensure comparability between derived models using NIPALS. c. Weights used for each model (normalized to allow comparison) grouped across categories and domains. Ha, headache; F, facial; N/S, neck or shoulder; S/A, stomach or abdominal; B, back; Hp, hip; K, knee. d. Candidate models’ capacities to discriminate between the pain sites they were trained on from pain-free individuals are shown using AUC-ROC. e. The risk score derived from each candidate model correlated with number of co-existing pain sites. f. Cross- sectional discrimination for each pain site in acute (dashed line) and chronic (full line) pain conditions against the rest of the training cohort (that is, pain-free and other pain sites) using the model specific to the site (in color), to the number of pain sites (black), and to other candidate models trained on a different pain site (gray). g. Post-hoc analyses show that similarities between the weights of the different models (Fisher-normalized) can be explained (R2) by the distance between the sites in chronic (Pperm = 0.0003) but not acute pain conditions (Pperm = 0.51, using 10,000 two-sided permutation tests).
Extended Data Fig. 9
Extended Data Fig. 9. Minimal demographic bias in the original risk score and the Risk Of Pain Spreading.
Cross-sectional AUC-ROC discrimination of chronic pain sites compared to pain-free individuals within a. females and males separately, b. white, black, mixed, and Asian ethnicities and c. each ethnicity and sex interaction. d. Model fit using explained variance (R2) for both risk scores across each demography is shown. Sample sizes are reported in parentheses from the entire UK Biobank cohort.
Extended Data Fig. 10
Extended Data Fig. 10. Validation of the ROPS in two independent cohorts.
Pie charts displaying a. demographics, b. acute (≤3 months) and c. chronic (>3 months) pain phenotypes for the replication data, shown in the Prevent-AD in the top row, and in the NFBC at 31 and 46 years old shown in the second and third rows respectively. NFBC, Northern Finland Birth Cohort; Ha, headache; F, facial; N/S, neck/shoulder; B, back; S/A, stomach/abdominal; Hp, hip; K, knee; A, arm/elbow; Hd, hand; Ft, feet; C, chest; L, leg. c. Years between baseline (31 years old) and follow-up visit (46 years old) in the Northern Finland Birth Cohort data (15-year follow-up). d. Equivalence of the six-item pain risk score (ROPS) in the NFBC to the original from UK Biobank, also used in Prevent-AD.

Comment in

  • A risk score for pain outcomes.
    Welberg L. Welberg L. Nat Neurosci. 2023 Aug;26(8):1319. doi: 10.1038/s41593-023-01411-7. Nat Neurosci. 2023. PMID: 37537349 No abstract available.

References

    1. Busse JW, et al. Guideline for opioid therapy and chronic noncancer pain. CMAJ. 2017;189:E659–E666. - PMC - PubMed
    1. Finley CR, et al. What are the most common conditions in primary care?: systematic review. Can. Fam. Physician. 2018;64:832–840. - PMC - PubMed
    1. Todd KH, et al. Pain in the emergency department: results of the pain and emergency medicine initiative (PEMI) multicenter study. J. Pain. 2007;8:460–466. - PubMed
    1. Chou R, Shekelle P. Will this patient develop persistent disabling low back pain? JAMA. 2010;303:1295–1302. - PubMed
    1. Gatchel RJ, Peng YB, Peters ML, Fuchs PN, Turk DC. The biopsychosocial approach to chronic pain: scientific advances and future directions. Psychol. Bull. 2007;133:581. - PubMed

Publication types