. 2023 Jul;29(7):1793-1803.
doi: 10.1038/s41591-023-02429-x. Epub 2023 Jul 6.

A multi-ancestry polygenic risk score improves risk prediction for coronary artery disease

Affiliations

A multi-ancestry polygenic risk score improves risk prediction for coronary artery disease

Aniruddh P Patel et al. Nat Med. 2023 Jul.

Abstract

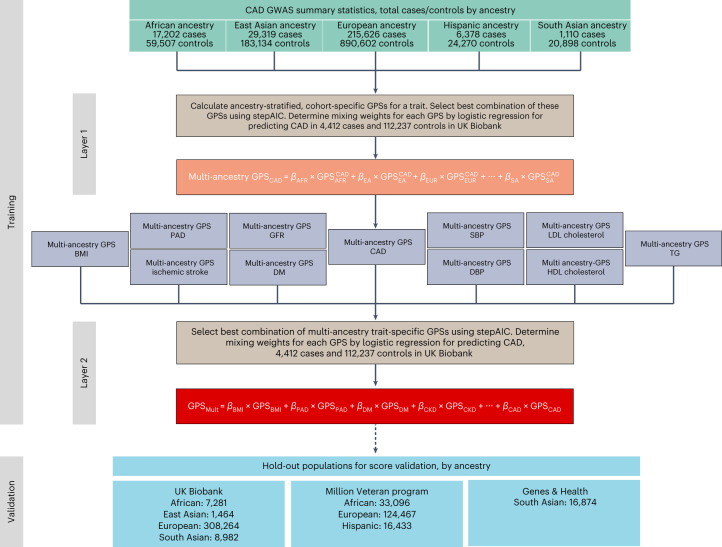
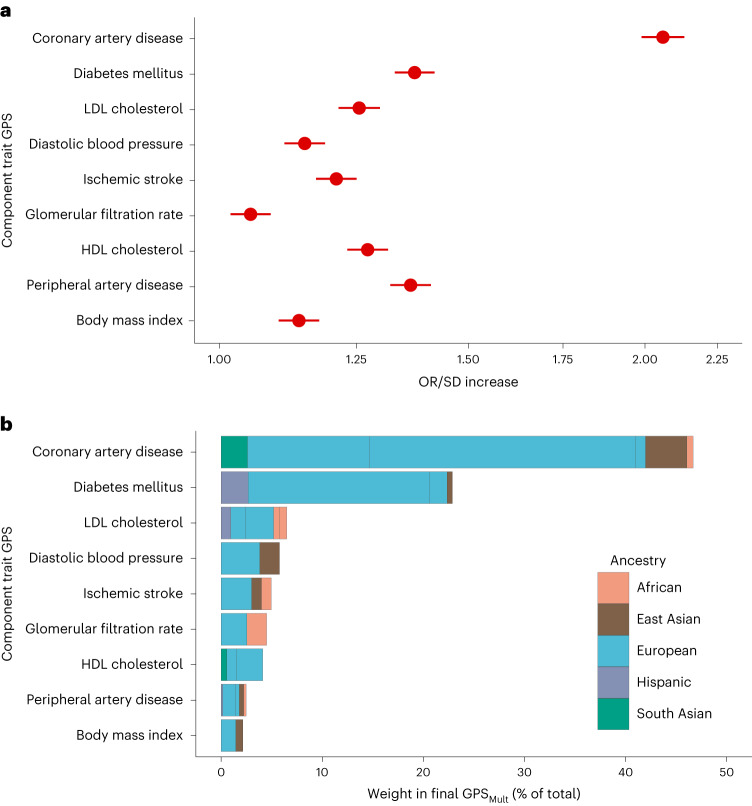
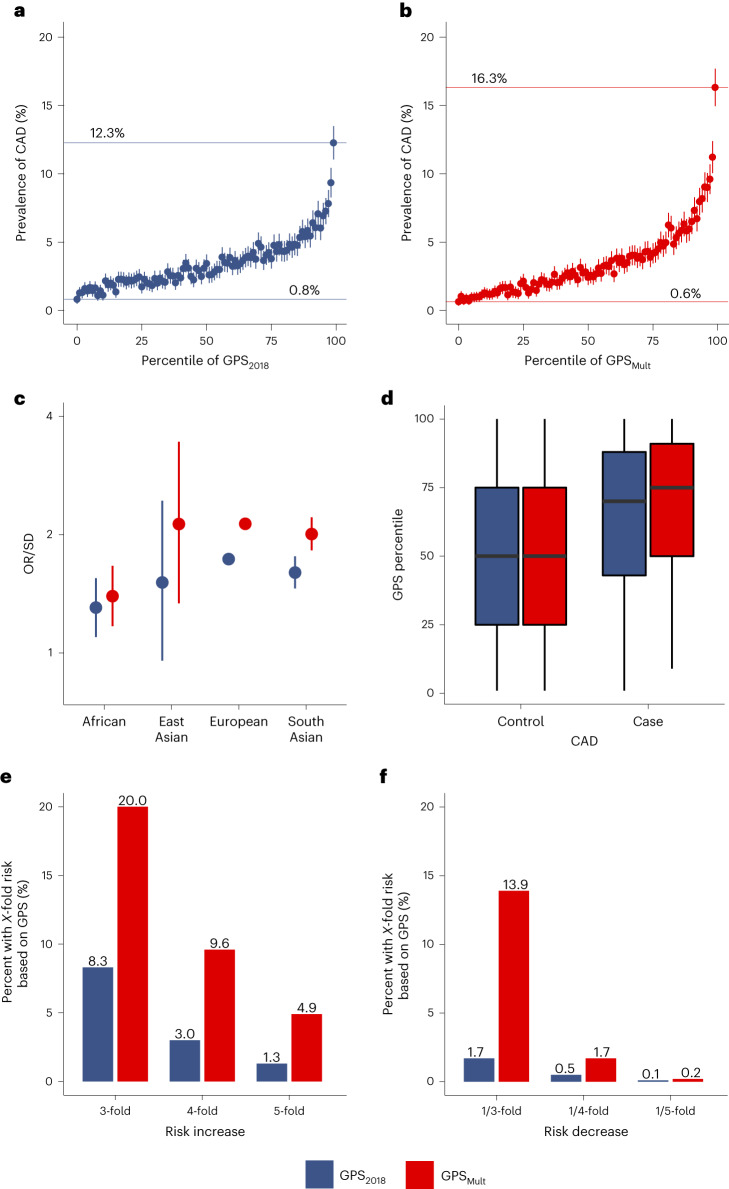
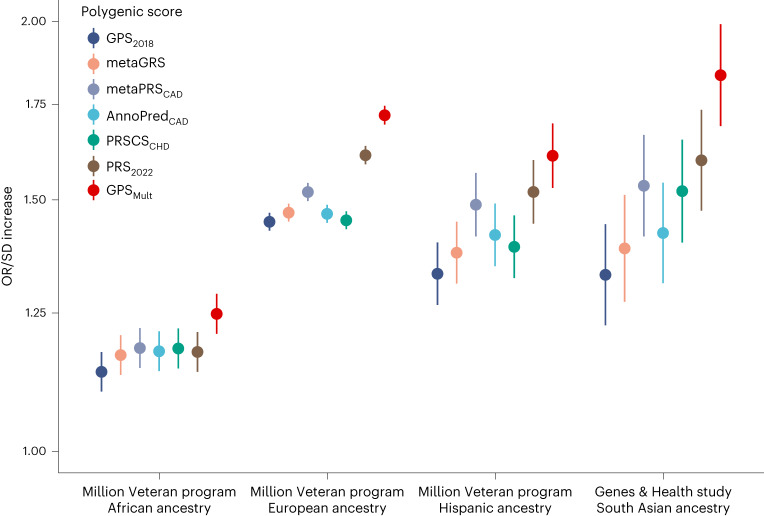
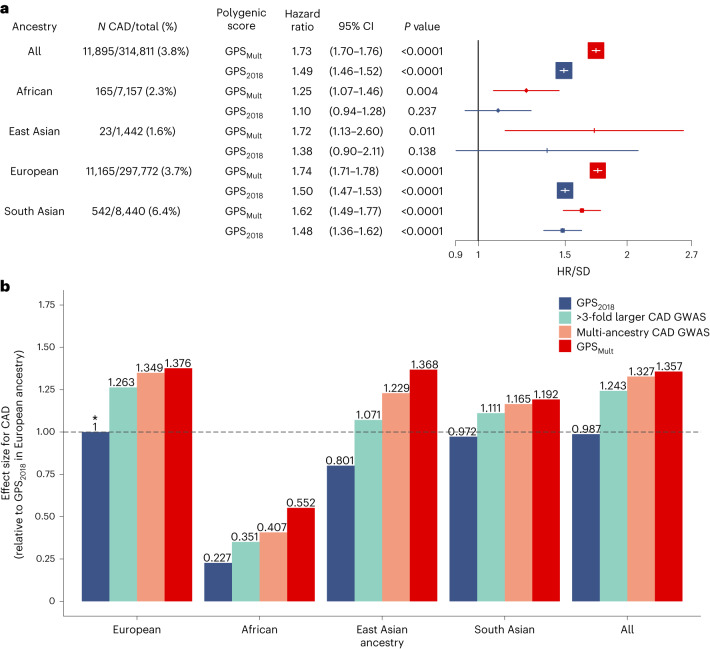
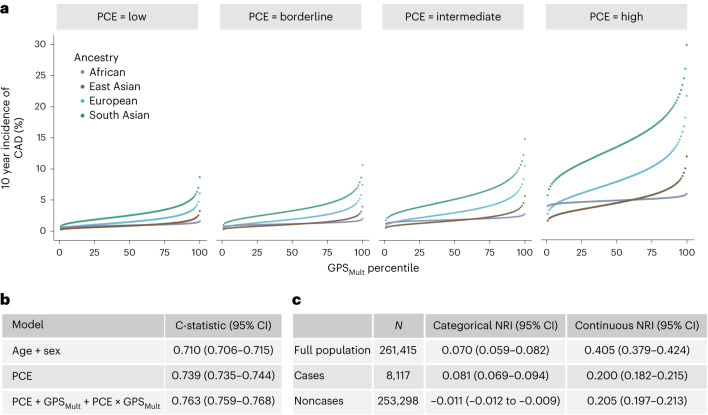
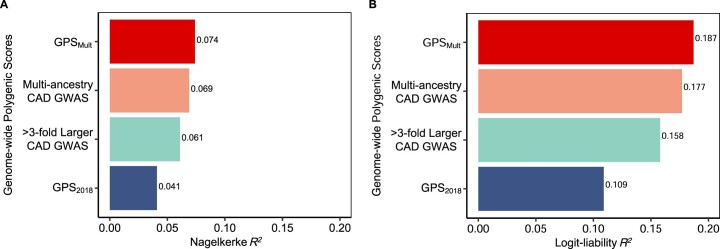
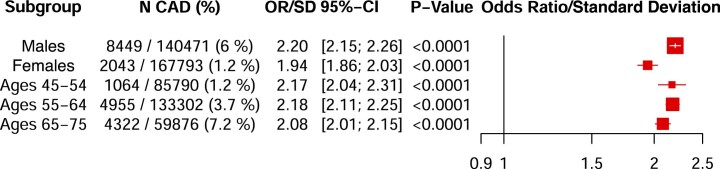
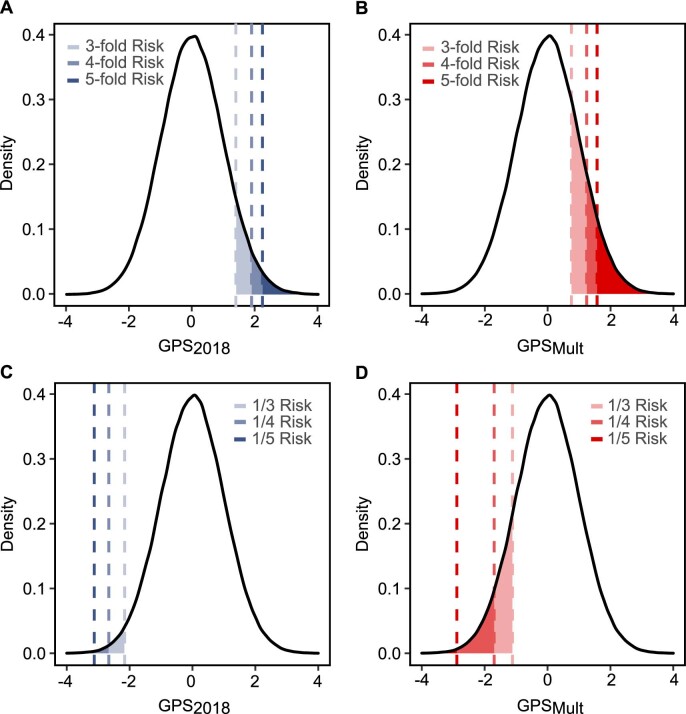
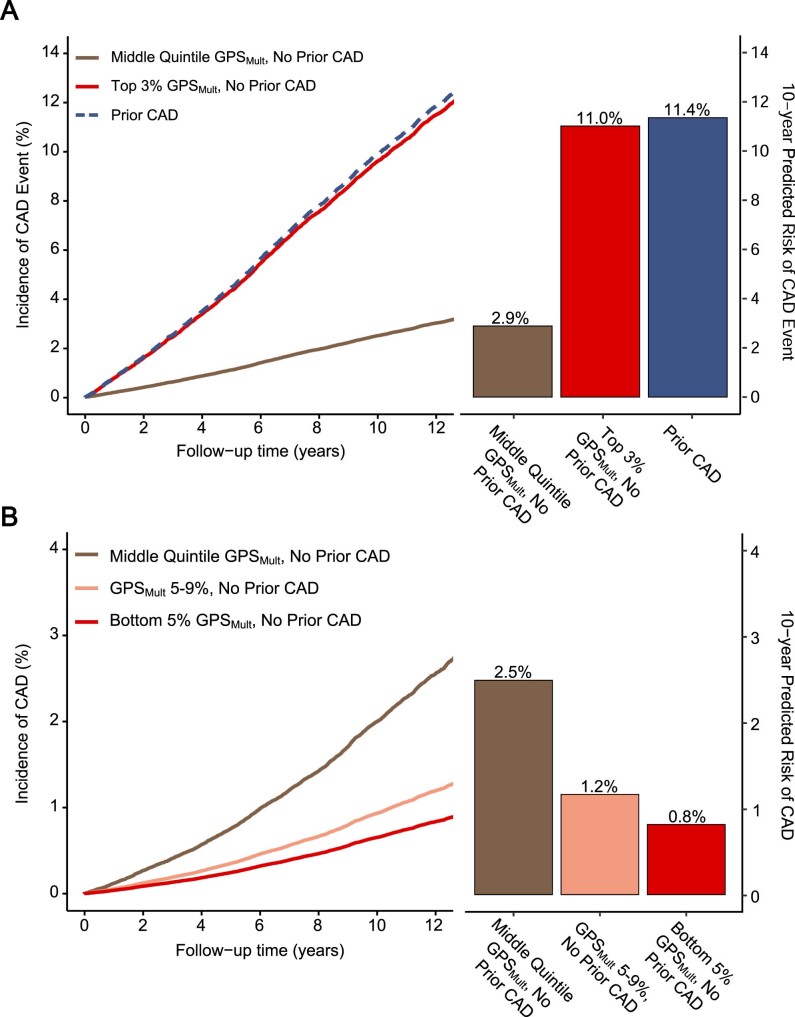
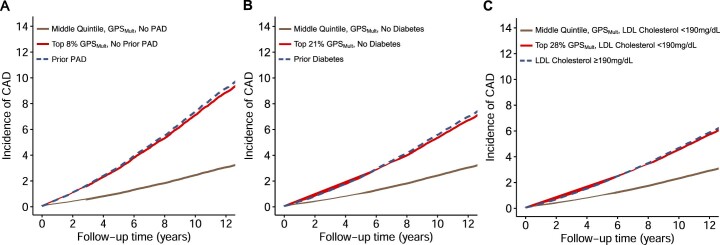
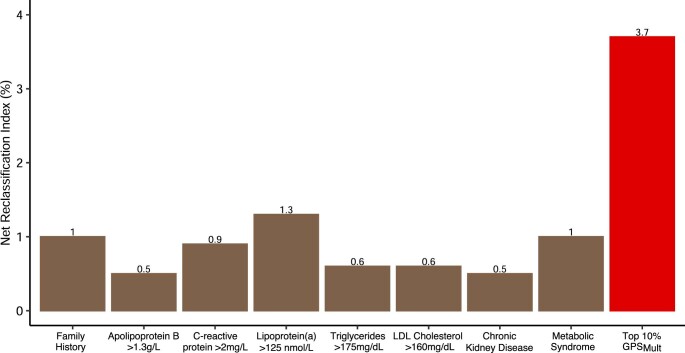
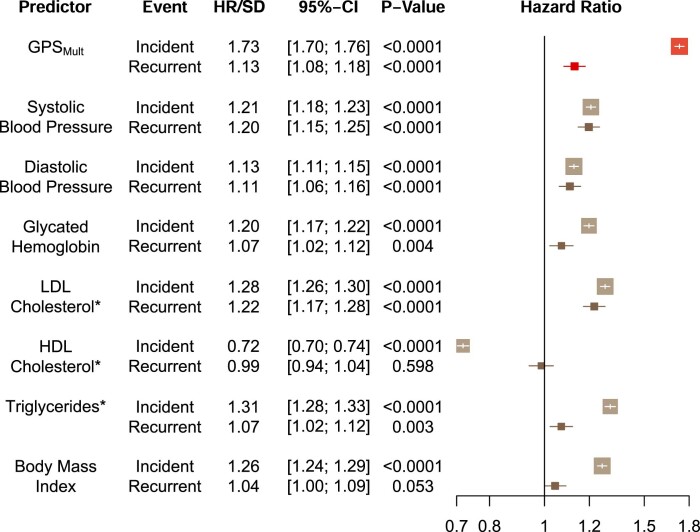
Identification of individuals at highest risk of coronary artery disease (CAD)-ideally before onset-remains an important public health need. Prior studies have developed genome-wide polygenic scores to enable risk stratification, reflecting the substantial inherited component to CAD risk. Here we develop a new and significantly improved polygenic score for CAD, termed GPSMult, that incorporates genome-wide association data across five ancestries for CAD (>269,000 cases and >1,178,000 controls) and ten CAD risk factors. GPSMult strongly associated with prevalent CAD (odds ratio per standard deviation 2.14, 95% confidence interval 2.10-2.19, P < 0.001) in UK Biobank participants of European ancestry, identifying 20.0% of the population with 3-fold increased risk and conversely 13.9% with 3-fold decreased risk as compared with those in the middle quintile. GPSMult was also associated with incident CAD events (hazard ratio per standard deviation 1.73, 95% confidence interval 1.70-1.76, P < 0.001), identifying 3% of healthy individuals with risk of future CAD events equivalent to those with existing disease and significantly improving risk discrimination and reclassification. Across multiethnic, external validation datasets inclusive of 33,096, 124,467, 16,433 and 16,874 participants of African, European, Hispanic and South Asian ancestry, respectively, GPSMult demonstrated increased strength of associations across all ancestries and outperformed all available previously published CAD polygenic scores. These data contribute a new GPSMult for CAD to the field and provide a generalizable framework for how large-scale integration of genetic association data for CAD and related traits from diverse populations can meaningfully improve polygenic risk prediction.


Conflict of interest statement

S.A. has served as a scientific advisor to Third Rock Ventures. A.C.F. is a co-founder of Goodpath and reports a grant from Abbott Vascular. P.T.E. receives sponsored research support from Bayer AG and IBM Research; he has also served on advisory boards or consulted for Bayer AG, MyoKardia and Novartis. A.S.B. reports institutional grants from AstraZeneca, Bayer, Biogen, BioMarin, Bioverativ, Novartis, Regeneron and Sanofi. P.N. reports research grants from Allelica, Apple, Amgen, Boston Scientific, Genentech/Roche and Novartis, personal fees from Allelica, Apple, AstraZeneca, Blackstone Life Sciences, Foresite Labs, Genentech/Roche, GV, HeartFlow, Magnet Biomedicine and Novartis, scientific advisory board membership of Esperion Therapeutics, Preciseli and TenSixteen Bio, scientific co-founder of TenSixteen Bio, equity in Preciseli and TenSixteen Bio, and spousal employment at Vertex Pharmaceuticals, all unrelated to the present work. A.V.K. is an employee of Verve Therapeutics; has served as a scientific advisor to Amgen, Novartis, Silence Therapeutics, Korro Bio, Veritas International, Color Health, Third Rock Ventures, Illumina, Ambry and Foresite Labs; holds equity in Verve Therapeutics, Color Health and Foresite Labs; and is listed as a co-inventor on patent applications related to assessment and mitigation of risk associated with perturbations in body fat distribution. The remaining authors declare no competing interests.

Figures

Fig. 1
Fig. 1. Overview of GPSMult development.
Polygenic scores were constructed using cohort-specific, ancestry-stratified summary statistics for CAD and CAD-related traits, resulting in 51 GPS across all traits and ancestries. For each trait (for example, CAD) the best-performing combination of cohort-specific, ancestry-stratified GPSs was determined using stepAIC, and their optimal mixing weights (β) were determined using logistic regression in 116,649 individuals of European ancestry in the UK Biobank training dataset. The selected GPSs were linearly combined using these mixing weights to yield multi-ancestry scores predicting CAD for each trait (layer 1). The best-performing combination of multi-ancestry, trait-specific GPSs was determined using stepAIC, and their optimal mixing weights (β) were determined using logistic regression in 116,649 individuals of European ancestry in the UK Biobank training dataset. The selected GPSs were linearly combined using these mixing weights to yield GPSMult (layer 2). Ancestries: AFR, African; EA, East Asian; EUR, European; HISP, Hispanic; SA, South Asian. Source GWAS traits: CAD,,,,, body mass index (BMI),, ischemic stroke,,, diabetes mellitus (DM), peripheral artery disease (PAD),,, glomerular filtration rate (GFR),, systolic blood pressure (SBP),, diastolic blood pressure (DBP),, LDL cholesterol,,, HDL cholesterol,,, triglycerides (TG),,.
Fig. 2
Fig. 2. Trait-specific component polygenic score performance and ancestry-specific polygenic score composition of GPSMult.
a, The OR/SD with 95% CI for prevalent CAD risk of the multi-ancestry, trait-specific layer 1 GPSs was assessed in logistic regression models adjusted for age, sex, genotyping array and the first ten principal components of ancestry in the same training group of n = 116,649 independent UK Biobank European ancestry individuals. b, The contributing weights of each of the ancestry-stratified, cohort-specific GWAS-based GPS to each of the trait-based layer 1 polygenic scores are proportional to stacked bar size, which are colored according to ancestry of source GWAS, and normalized to 100% to reflect composition in the overall GPSMult. Of 51 ancestry- and trait-specific scores that were included in the GPS training analysis, 32 scores significantly contributed to overall prediction in GPSMult after optimization of score selection with stepAIC and weighting through logistic regression in the two layers.
Fig. 3
Fig. 3. Improvements in polygenic prediction of prevalent CAD prediction.
a,b, The mean prevalence of CAD with 95% CI according to 100 groups of the UK Biobank European ancestry validation dataset consisting of n = 308,264 independent participants, binned according to the percentile of the GPS2018 (a) and GPSMult (b). c, The OR/SD with 95% CI for prevalent CAD of GPSMult was assessed in a logistic regression model adjusted for age, sex and the first ten principal components of ancestry in n = 7,281 independent individuals of African ancestry, n = 1,464 independent individuals of East Asian ancestry, n = 308,264 independent individuals of European ancestry, and n = 8,982 independent individuals of South Asian ancestry. d, Distributions of GPS2018 and GPSMult percentiles across the UK Biobank European ancestry validation dataset consisting of n = 308,264 independent participants. For all box plots: central line of each box, median; top and bottom edges of each box, first and third quartiles; whiskers extend 1.5× the interquartile range beyond box edges. e, Proportion of UK Biobank validation population with 3-, 4- and 5-fold increased risk for CAD versus the middle quintile of the population, stratified by GPS. The odds ratio assessed in a logistic regression model adjusted for age, sex, genotyping array and the first ten principal components of ancestry. f, Proportion of UK Biobank testing population with 1/3, 1/4, and 1/5 risk for CAD versus the middle quintile of the population, stratified by GPS. Odds ratio assessed in a logistic regression model adjusted for age, sex, genotyping array and the first ten principal components of ancestry.
Fig. 4
Fig. 4. External validation of GPSMult and benchmarking against published polygenic scores for CAD across multiple ancestries in Million Veteran Program and Genes & Health studies.
The OR/SD with 95% CI for prevalent CAD risk was assessed for each polygenic score in a logistic regression model adjusted for age, sex, genotyping array and the first ten principal components of ancestry in the same group of individuals per cohort: n = 33,096 independent African ancestry individuals in the Million Veteran Program; n = 124,467 independent European ancestry individuals in the Million Veteran Program; n = 16,433 independent Hispanic ancestry individuals in the Million Veteran Program; n = 16,874 independent South Asian ancestry individuals in the Genes & Health Study, using high-performing published scores from the Polygenic Score Catalog (GPS2018 (ref. ), metaGRS, metaPRSCAD, AnnoPredCAD, PRSCSCHD and PRS2022 (ref. ), as well as GPSMult. Results for these and additional CAD polygenic scores published in the Polygenic Score Catalog are available in Supplementary Tables 6 and 7.
Fig. 5
Fig. 5. Incident CAD prediction by GPSMult stratified by ancestry.
a, Adjusted HR/SD of the polygenic score with corresponding 95% CIs and P values for incident CAD by ancestry, stratified by the version of the polygenic score, calculated from Cox proportional-hazards regression models adjusted for age, sex, genotyping array and the first ten principal components of ancestry in the UK Biobank validation dataset, consisting of n = 7,157 independent individuals of African ancestry, n = 1,442 independent individuals of East Asian ancestry, n = 297,772 independent individuals of European ancestry, and n = 8,440 independent individuals of South Asian ancestry. GPS2018 corresponds to a previously published polygenic score for CAD. P values are derived from a Wald test implemented in the coxph function in R and are two-sided. b, The score effect sizes relative to the effect size of GPS2018 in European ancestry individuals. ‘>3-fold larger CAD GWAS’ designates a polygenic score generated using summary statistics of largely European ancestry from the most recent CARDIOGRAMplusC4D excluding the UK Biobank (GPSCADEUR). ‘Multi-ancestry CAD GWAS’ refers to the polygenic score generated by combining ancestry-specific polygenic scores generated using GWAS summary statistics from CARDIOGRAMplusC4D, Genes & Health, Biobank Japan, Million Veteran Program and FinnGEN biobanks in layer 1 (GPSCADANC). GPSMult designates polygenic score for CAD designed with summary statistics from multiple ancestries and multiple CAD-related traits in layer 2. Asterisk designates the reference group for calculating relative gain.
Fig. 6
Fig. 6. Discrimination and reclassification by a model integrating polygenic and clinical risk for incident CAD.
a, The cumulative incidence of CAD over 10 years predicted by modeling GPSMult, AHA/ACC PCE 10-year risk estimate, and their interaction in the UK Biobank validation dataset binned according to the percentile of the GPSMult. Individuals were grouped by risk categories of the PCE (predicted 10-year risk of atherosclerotic cardiovascular disease as ‘low’ (<5%), ‘borderline’ (5% to <7.5%), ‘intermediate’ (≥7.5% to <20%) and ‘high’ (≥20%)), and stratified by ancestry. b, C-statistics are based on 10-year follow-up events from Cox regression models of listed variables. PCE includes age and sex variables in its risk estimation. c, The improvement in the predictive performance of the addition of the GPSMult to the PCE was evaluated using continuous and categorized NRI, with a risk probability threshold of 7.5% and CIs (95%) obtained from 100-fold bootstrapping.
Extended Data Fig. 1
Extended Data Fig. 1. Sequential improvements in R2 with GPSMult in the UK Biobank Study.
The proportion of phenotypic variance explained by the polygenic score predicting coronary artery disease (CAD) was calculated in the UK Biobank European ancestry validation cohort for each GPS score using the A: Nagelkerke’s pseudo-R2 metric, as the difference of the full model inclusive of the polygenic score plus age, sex, genotyping array, and the first ten principal components of ancestry minus R2 for the covariates alone; and B: logit-liability R2 metric. GPS2018 denotes previously published polygenic score for CAD. > 3-fold larger CAD GWAS designates metrics for polygenic score generated using summary statistics from the most recent Coronary ARtery DIsease Genome wide Replication and Meta-analysis plus The Coronary Artery Disease Genetics consortium analysis (CARDIOGRAMplusC4D) excluding the UK Biobank. Multi-ancestry CAD GWAS refers to the polygenic score generated by combining ancestry-specific polygenic scores generated using discovery data from Genes & Health, Biobank Japan, Million Veteran Program, FinnGen, and CARDIOGRAMplusC4D (excluding UK Biobank). GPSMult designates polygenic score for CAD designed with summary statistics from multiple ancestries and multiple CAD-related traits.
Extended Data Fig. 2
Extended Data Fig. 2. GPSMult performance by sex and age subgroups.
The odds ratio per standard deviation (OR/SD) with 95% confidence intervals for prevalent coronary artery disease (CAD) risk of the GPSMult was assessed in a logistic regression model adjusted for age, sex, genotyping array, and the first ten principal components of genetic ancestry in the European ancestry validation dataset of the UK biobank (N = 308,264 independent participants) stratified by sex and age subgroups. P values are derived from a t-test implemented in the GLM function in R and are two-sided.
Extended Data Fig. 3
Extended Data Fig. 3. Coronary artery disease risk in the extreme ends of the polygenic score distribution.
Proportion of UK Biobank validation population with 3, 4, and 5-fold increased risk for CAD versus the middle quintile of the population identified by GPS2018 (A) and GPSMult (B). The odds ratio assessed in a logistic regression model adjusted for age, sex, genotyping array, and the first ten principal components of ancestry. Proportion of UK Biobank testing population with 1/3, 1/4, and 1/5 risk for CAD versus the middle quintile of the population, population identified by GPS2018 (C) and GPSMult (D). Odds ratio assessed in a logistic regression model adjusted for age, sex, genotyping array, and the first ten principal components of ancestry. GPS: Genome-wide polygenic score; CAD: coronary artery disease.
Extended Data Fig. 4
Extended Data Fig. 4. Extremes of risk for incident coronary artery disease identified by tail distributions of GPSMult.
A: Cumulative incidence of coronary artery disease (CAD) events (%) over length of the follow-up period stratified by presence of prior CAD or with no prior CAD and for the middle quintile or top 3% of the population for GPSMult risk, estimated using Cox proportional-hazards regression model adjusted for age, sex, genotyping array, and the first ten principal components of ancestry in the European ancestry UK Biobank validation dataset. The estimated 10-year CAD event risk was predicted using same model standardized to the mean of each of the covariates. B: Cumulative CAD risk (%) stratified by the bottom 5%, the 5–9% segment, and the 40–59% segment of the population for GPSMult risk, estimated using Cox proportional-hazards regression model adjusted for age, sex, genotyping array, and the first ten principal components of ancestry in the European ancestry validation dataset of the UK Biobank Study. The estimated 10-year CAD risk was predicted using same model standardized to the mean of each of the covariates. GPS: Genome-wide polygenic score.
Extended Data Fig. 5
Extended Data Fig. 5. Equivalents of increased risk for incident coronary artery disease event identified by high GPSMult in the UK Biobank Study.
A: Cumulative incidence of coronary artery disease (CAD) events (%) over length of follow-up stratified by presence of prior peripheral artery disease (PAD) or no prior PAD with GPSMult in the middle quintile or top 8% of the population, estimated using Cox proportional-hazards regression model adjusted for age, sex, genotyping array, and the first ten principal components of ancestry in the European ancestry UK Biobank validation dataset. B: Cumulative incidence of CAD events (%) over length of follow-up stratified by presence of prior diabetes mellitus (DM) or no prior DM with GPSMult in the middle quintile or top 21% of the population, estimated using Cox proportional-hazards regression model adjusted for age, sex, genotyping array, and the first ten principal components of ancestry in the European ancestry UK Biobank validation dataset. C: Cumulative incidence of CAD events (%) over length of follow-up stratified by presence of prior severe hypercholesterolemia (estimated untreated low-density lipoprotein cholesterol, LDL-C 190 mg/dL or higher), or no prior hypercholesterolemia with GPSMult in the middle quintile or top 28% of the population, estimated using Cox proportional-hazards regression model adjusted for age, sex, genotyping array, and the first ten principal components of ancestry in the European ancestry UK Biobank validation dataset.
Extended Data Fig. 6
Extended Data Fig. 6. Net reclassification with presence of high GPSMult or CAD risk enhancing factors over PCE 10-year risk estimates.
Net reclassification of coronary artery disease (CAD) cases and non-cases at the 7.5% threshold achieved by presence of established CAD risk enhancing factors or high GPSMult when added to a baseline model of just the American Heart Association/American College of Cardiology Pooled Cohort Equations in the European ancestry validation dataset of the UK Biobank.
Extended Data Fig. 7
Extended Data Fig. 7. Association of GPSMult and risk factors with incident and recurrent coronary artery disease events.
Hazards ratio per standard deviation (HR/SD) with 95% confidence intervals of variable of interest for incident disease assessed in individuals without prior coronary artery disease (CAD) followed for development of first CAD event with Cox proportional hazards regression model adjusted for age, sex, genotyping array, and the first ten principal components of ancestry in the European ancestry validation dataset of the UK Biobank Study (N = 308,264 independent participants). HR/SD of variable of interest for recurrent disease assessed in individuals with prior CAD followed for development of recurrent CAD event with Cox proportional hazards regression model adjusted for age, sex, genotyping array, and the first ten principal components of ancestry. P values are derived from a Wald test implemented in the coxph function in R and are two-sided. *LDL-C, HDL-C, and triglyceride values were adjusted for cholesterol-lowering medication status, as previously described. BP: Blood pressure. BMI: Body-mass index. HgbA1c: Glycated hemoglobin. LDL-C: Low-density lipoprotein cholesterol. HDL-C: High-density lipoprotein cholesterol.

Similar articles

Cited by

References

    1. Roth GA, et al. Global, regional, and national age-sex-specific mortality for 282 causes of death in 195 countries and territories, 1980–2017: a systematic analysis for the Global Burden of Disease Study 2017. Lancet. 2018;392:1736–1788. - PMC - PubMed
    1. Arnett DK, et al. 2019 ACC/AHA guideline on the primary prevention of cardiovascular disease: a report of the American College of Cardiology/American Heart Association Task Force on Clinical Practice Guidelines. Circulation. 2019;140:e596–e646. - PMC - PubMed
    1. DeFilippis AP, et al. An analysis of calibration and discrimination among multiple cardiovascular risk scores in a modern multiethnic cohort. Ann. Intern. Med. 2015;162:266–275. - PMC - PubMed
    1. Patel AP, Wang M, Kartoun U, Ng K, Khera AV. Quantifying and understanding the higher risk of atherosclerotic cardiovascular disease among South Asian individuals. Circulation. 2021;144:410–422. - PMC - PubMed
    1. Goff David C, et al. 2013 ACC/AHA guideline on the assessment of cardiovascular risk. Circulation. 2014;129:S49–S73. - PubMed

Publication types