. 2023 Aug;24(8):1265-1280.
doi: 10.1038/s41590-023-01545-7. Epub 2023 Jul 6.

Transitional dendritic cells are distinct from conventional DC2 precursors and mediate proinflammatory antiviral responses

Affiliations

Transitional dendritic cells are distinct from conventional DC2 precursors and mediate proinflammatory antiviral responses

Fernando Bandeira Sulczewski et al. Nat Immunol. 2023 Aug.

Abstract

High-dimensional approaches have revealed heterogeneity amongst dendritic cells (DCs), including a population of transitional DCs (tDCs) in mice and humans. However, the origin and relationship of tDCs to other DC subsets has been unclear. Here we show that tDCs are distinct from other well-characterized DCs and conventional DC precursors (pre-cDCs). We demonstrate that tDCs originate from bone marrow progenitors shared with plasmacytoid DCs (pDCs). In the periphery, tDCs contribute to the pool of ESAM+ type 2 DCs (DC2s), and these DC2s have pDC-related developmental features. Different from pre-cDCs, tDCs have less turnover, capture antigen, respond to stimuli and activate antigen-specific naïve T cells, all characteristics of differentiated DCs. Different from pDCs, viral sensing by tDCs results in IL-1β secretion and fatal immune pathology in a murine coronavirus model. Our findings suggest that tDCs are a distinct pDC-related subset with a DC2 differentiation potential and unique proinflammatory function during viral infections.


Figures

Extended Data Fig. 1
Extended Data Fig. 1. tDC are distinct transcriptionally.
a. CD135-enriched splenocytes from hCD2EYFP mice were stained and sorted. Briefly, lineage containing CD3+/CD19+/NK1.1+/Ly6G+ cells were removed, and cells were gated using the strategy described in Fig.1f. DC2 were further separated as EYFP+ and EYFP cells. Shown are cells before (upper panels) and after sort (bottom panels). b. MA plots of bulk-RNAseq data comparing tDC vs DC2 and tDC vs pDC. Genes with 2-fold Log2 change are shown in red (up) and blue (down) (see also Supplementary Table S4). c. MA plot comparing tDC vs all other DC (pDC, DC2 and DC1). Genes with 2-fold Log2 change are shown in red (up) and blue (down) (see also Supplementary Table S1). d. scRNAseq of splenic DC subsets. Splenic DCs were sorted as shown in Fig.1c and sequenced using droplet-based genomics. After filtering, 2,110 cells were analyzed. UMAP of clusters detected using Seurat’s pipeline (right). Heatmap of top DEG between clusters (left). e. DC signature scores generated using CIBERSORTx in the bulk-RNAseq data from (a) was overlayed on UMAP from (d). f. As in (e), but DC signature scores were overlayed on the KNetL Plot from Fig.1d.
Extended Data Fig. 2
Extended Data Fig. 2. tDC originate from BM progenitors.
a. Gating strategy used for the analysis of skin-draining lymph node (LN) and lung DC subsets excluded. Lineage contains CD3+/CD19+/NK1.1+/Ly6G+ cells. b. Bar graphs (mean + SD) showing the contribution of donor cells to LN and lung DC populations (gated as in (a)) in mixed BMC generated by transplanting 50% CD45.1 WT and 50% CD45.2 TCF4cKO BM, normalized to NK cells (n=6 mice in 2 experiments). Statistics determined by two-way ANOVA with Dunnett’s multiple comparison test. c. Bar graph (mean + SD) showing the percentage of splenic DC (gated as in Fig.1f) labeled with the lineage tracing CD300cTdT (n=4 mice in 3 experiments). d. Adoptive cell transfer of 30,000 BM (left) or splenic (right) CX3CR1EGFP CD45.1 pDC into CD45.2 WT non-irradiated congenic mice. Recipient mice were euthanized at different time points (2-8-days) and the number of recovered cells (gated on CD45.1+ and CX3CR1+) calculated per 1000 cells transferred (mean + SD). N=3/time point except n=2 for splenic pDC at 8-days. N represents number of mice and experiments. e. CyTOF analysis of blood and spleen DC, analyzed by UMAP. Cells were gated as CD3CD19NK1.1Ly6G. Populations were delineated manually (top) and colored by marker expression (bottom)(n=2 mice in 2 experiments). f. Spleen, blood and BM of hCD2EYFP mice were analyzed for the presence of EYFP+ cells, that were further separated in Ly6D+ pDC and CX3CR1+ tDC. Lineage includes CD3+/CD19+/NK1.1+/Ly6G+ cells. One representative of 3 experiments.
Extended Data Fig. 3
Extended Data Fig. 3. tDC originate from pro-pDC.
a. CD135+ BM cells were enriched, sorted as CD45+/CD3/CD19/Ly6G, and prepared for scRNA-seq. Cells with a pDC-specific gene enrichment score of >0.15 were selected and re-clustered using Seurat as shown in Fig.3d. Violin plots show the expression of the indicated genes in the clusters defined in Fig.3d. b. As in (a) but GSEA of selected pathways from clusters defined in Fig.3d. Bubble size indicates the normalized enriched score (NES), and color scale depicts False Discovery Rate (FDR). c. TdTomato expression in bone marrow progenitor cells from CD300cTdT mice, gated as in Fig.3j. One representative experiment. d. Imm pDC, pro-pDC and pro-cDC from the BM of CX3CR1EGFP or hCD2EYFP CD45.1 mice were purified as described in Fig.3j and transferred into CD45.2 WT mice. 2- and 4-days post-transfer, recipient mice were analyzed for transferred cells in the spleen. Shown is the number of cells recovered in the spleen of recipient mice (mean + SD). Imm pDC: n=3 at 2- and 4-days. Pro-pDC: n=3 at 2-days, and n=5 at 4-days. Pro-cDC: n=3 at 2-days, and n=5 at 4-days. N represents number of mice and independent experiments. e. BM cells from CX3CR1EGFP or hCD2EYFP CD45.1 mice were CD135-enriched and purified by cell sorting using the gating strategy shown in Fig.3j. Purified progenitors were adoptively transferred into congenic non-irradiated CD45.2 WT mice and analyzed 4-days later in the spleen of recipient mice. Left panels show post-sort purity of progenitors. Right panels show transferred cells recovered in the spleen of recipient mice, analyzed using the gating strategy described in Fig.1f. In both cases, lineage includes CD3+/CD19+/CD335+/Ly6G+ cells. One representative of ≥ 3 experiments.
Extended Data Fig. 4
Extended Data Fig. 4. tDC originate from DN progenitors.
a. Gating strategy of CD135-enriched BM progenitors from hCD2EYFP mice. Cells were stained for flow cytometry. Lineage contain CD3+/CD19+/NK1.1+/Ly6G+ cells. EYFP labeling is shown in the lower panels. One representative of 3 experiments. b. As in (a), but CD115 progenitors were further gated based on the expression Ly6C, whereas CD127 and DN progenitors were gated based on the expression of Ly6D and SiglecH (top). Bottom histograms show EYFP expression in each population. One representative of 3 experiments. c. The schematic shows adoptive transfer of 15,000-30,000 from CX3CR1EGFP CD45.1 BM progenitors into WT CD45.2 non-irradiated congenic mice. Transferred cells were identified in the spleen of recipient mice as CD45.1+ and CX3CR1+ cells. Bar graphs (mean + SD) show the percentage of each population recovered in the spleen (gated as shown in Fig.1f). N ≥ 2/mice and experiments. d. As in (c), but bar graphs (mean + SD) number of cells recovered in the spleen of recipient mice. N represents number of mice and independent experiments.
Extended Data Fig.5
Extended Data Fig.5. tDC convert into DC2.
a. tDC were purified using the gating strategy described in Fig.1f. Top graph shows cell purity after sort. Bottom graphs show the outcome of transferred cells in the spleen of recipient mice analyzed at 4-days. One representative of 6 experiments. b. Bar graphs (mean + SD) of the total number of splenic DC in hCD2-iCre+/− Cx3cr1DTR+/− mice inoculated with DT and analyzed 1 day after (n=5 mice in 4 experiments), or inoculated with DT every second day and analyzed 7 days later (n=5 mice in 4 experiments). “C” represents control mice (n=8 mice in 4 experiments), which are a combination of hCD2-iCre−/− Cx3cr1DTR+/− mice inoculated with DT or hCD2-iCre+/− Cx3cr1DTR+/− mice inoculated with PBS (no differences were observed between these control mice). Statistics determined by one-way ANOVA with Tukey’s multiple comparison test. c. As in (b), but BM progenitors from hCD2EYFP CX3CR1DTR mice were analyzed after 7 days of DT inoculation (n=4 mice). Control mice are hCD2EYFP CX3CR1DTR mice inoculated with PBS (n= 3 mice). Bar graphs (mean + SD) of the frequency of total progenitor populations from Fig.3j. Data pooled from 2 experiments. Statistical differences were determined by unpaired two-tailed t-test. d. Mouse splenic DC subsets were sorted using the gating strategy show in Fig.1f and Fig.4g, and analyzed by PCR assay for IgH D-J rearrangements. Actin and IgH germline (GL) are also shown. One representative of 3 experiments. e. DC2 from CD300cTdT mice were gated as indicated in Fig.4f, and further separated in TdTomato+ and TdTomato. Heatmap indicating the relative expression (Z-score of gMFI) of surface markers. Z-score was calculated base of n=2 mice in 2 experiments.
Extended Data Fig. 6
Extended Data Fig. 6. tDC have lower turnover rate than pre-DC2 and required IRF4.
a. Mice were inoculated i.p. with 1 mg of BrdU on day 0 and then fed continuously for 14 days with 0.8 mg/mL of BrdU in drinking water. After 14 days, BrDU was removed. Mice were euthanized at different time points post-BrdU removal, spleen cell suspension prepared and stained for BrdU and the identification of DC subsets as described in Fig.1f and Fig.5e. N ≥ 2/mice per time point in 2 independent experiments. b. Expression of Ki-67 in each splenic DC population gated as described in Fig.1f and Fig.5e, analyzed by flow cytometry. One representative of 3 experiments. c. BM cells from IRF4cKO or IRF4control mice were cultured with FLT3L as described in Fig.2c. At day 6, tDC were sorted and re-cultured in complete media and 1% FLT3L for 1 and 2 days. Bar graphs (mean + SD) show the percentage of each DC recovered. N=3 biologically independent samples in 3 experiment. d. Bar graphs (mean + SD) of the total number of splenic DC (gated a Fig.1f and Fig.4f) in hCD2EYFP CX3CR1DTR mice inoculated with DT every second day (n=3 mice) or left untreated (n=3 mice), and analyzed at day 10. Statistics determined by unpaired two-tailed t-test. e. As in (d), but shown is the number of other immune cells.
Extended Data Fig. 7
Extended Data Fig. 7. tDC respond to microbial stimulation and uptake antigen in vivo.
a. Splenic DC subsets purified as described in Fig.1f and Fig.4f were analyzed by Nanostring. Heatmap shows the expression of TLRs by each DC subset. N=2 mice in 2 experiments. b. Whole spleen cell suspensions were activated with LPS, MPLA, Resiquimod or PolyIC for 6 hrs. Heatmap showing the upregulation of MHCII and CD86 in pDC, tDC, ESAM+ EYFP+ and EYFP DC2, and DC1. Min and max correspond to the lowest and highest gMFI per row, respectively. N=6 mice per group. Data pooled from 4 experiments. c. As in (b), but bar graphs (mean + SD) of cytokine production. Whole spleen cell suspensions were activated with LPS (n=6), MPLA (n=4), Resiquimod (n=6) or PolyIC (n=6) for 6 hrs. TNF and IL-12p40 were detected by intracellular cytokine staining. N represents mice and data was pooled from 4 experiments. Statistical differences were determined by One-way ANOVA with Tukey’s multiple comparisons test. d. Mice were inoculated with yellow-green polystyrene (YG-PS) beads i.v. Three hrs later, spleens were harvested and the phagocytosis of the particle was assessed by flow cytometry in each DC population, gated as in Fig.1f (n=3 mice in 3 experiments). Bars represent mean + SD. Statistical differences were determined by One-way ANOVA with Tukey’s multiple comparisons test. e. As in (d), but mice were inoculated with PKH26-labeled SRBC (n=6 mice in 4 experiments).
Extended Data Fig. 8
Extended Data Fig. 8. Number of immune cells, viral titer and ALT in pDC- and pDC/tDC- depleted animals infected with M-CoV.
a. Liver cell suspensions were enriched in immune cells using a Percoll gradient, and stained with a cocktail of Ab for the analysis of neutrophils and lymphocytes. One representative of 3 experiments. b. As in (b), but cell suspensions were stained for the analysis of DC and other myeloid cells. Lineage contains CD3+/CD19+/NK1.1+/Ly6G+ cells. One representative of 3 experiments. c. Liver of WT mice were analyzed for the number of DC subsets by flow cytometry 2- and 5-days post-M-CoV infection. Fold change of the number of each subset to day 0 is shown. N=3 at 0 days, n=14 at 2-days, and n=11 at 5-days. Data pooled from ≥ 4 experiments. p-values represent statistical differences between tDC and DC2 vs DC1. d. Liver immune cell numbers 2-days post-M-CoV infection of pDCΔ (n=3); pDCΔtDCΔ (n=6) and control (n=5) mice. pDCΔ mice are BDCA2-DTR+/− mice inoculated with DT one day before M-CoV infection. pDCΔtDCΔ are hCD2EYFP CX3CR1DTR mice inoculated with DT every other day for 5-days before M-CoV infection. Control mice are a combination of BDCA2-DTR+/− or hCD2EYFP CX3CR1DTR mice inoculated with PBS, and DTR−/− mice inoculated with DT (no difference in control mice was observed). Shown is mean + SD. N represents independent mice in 2 experiments. e. As in (d), but serum ALT values (mean + SD) were determined 2-, 5- and 7-days post-M-CoV infection. N ≥ 4 mice/group/time point in 4 experiments. f. As in (e), but viral titers (log10 pfu/gr. Tissue) in liver (top) and spleen (bottom) were determined 2-, 5- and 7-days post-M-CoV infection. N ≥ 4 mice/group/time point. Violin plots show distribution of data pooled from 4 exp. Statistical differences determined by Two-way ANOVA with Tukey’s multiple comparisons test (c,e,f), or One-way ANOVA with Tukey’s multiple comparisons test per subset (d).
Extended Data Fig. 9
Extended Data Fig. 9. tDC promote immune pathology following M-CoV infection.
a. TCF4cKO vs TCF4control mice were generated by transplanting Itgax-Cre+/− Tcf4fl/fl or Itgax-Cre−/− Tcf4fl/fl BM into lethally irradiated CD45.1 WT mice, respectively. 2 months post-reconstitution, mice were infected with M-CoV, and the frequency of liver DC (mean + SD) analyzed 2-days later (n=6 mice/group in 2 experiments). b. Percentage weight loss (left, mean + SD) and survival (right) of TCF4cKO (n=7) vs TCF4control (n=10) mice in 3 experiments. c. As in (b), but viral titers (log10 pfu/gr. tissue) were determined 5-days post-M-CoV infection. N=7 mice for TCF4control and n=6 mice for TCF4cKO. Violin plots show distribution from 3 experiments. d. As in (b), but shown is serum ALT (mean + SD; n=6 mice/group in 3 experiments). e. Serum cytokines were determined by Luminex in control (n=7 mice), pDCΔ (n=8) and pDCΔtDCΔ (n=8) 2-days p.i. in 4 experiments. Shown are cytokines significantly different between pDCΔ vs pDCΔtDCΔ mice. f. Percentage weight loss (left, mean + SD) and survival (right) of pDCΔ mice inoculated with anti-NK1.1 Ab or isotype control on day -1, 0 and 2 post-infection with M-CoV. N=3 mice/group except n=5 mice for pDCΔ + isotype, pooled from 2 experiments. g. As in (f), but viral titers were evaluated at 5-days p.i. (n=3 mice/group). Violin plots show distribution from 2 experiments. h. As in Fig.8j, but splenic viral titers (log10 pfu/gr. tissue) were determined. N=5 mice/group except n=8 for pDC + control Ab. Violin plots show distribution from 2 experiments. i. As in Fig.8k but heatmaps show secretion of TNF, IL-6 and IL-12p70 by DC subsets (N=4 mice/subset in 4 experiments). Statistical differences were determined by unpaired two-tailed t-test (a,c-d), One-way ANOVA (e,h) or Two-way ANOVA (b,f) with Tukey’s multiple comparisons test, and Mantel-Cox test for survival (b,f).
Extended Data Fig. 10
Extended Data Fig. 10. Summary of DC development at steady state.
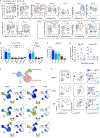
FIGURE 1.
FIGURE 1.. tDC are a distinct DC population developmentally related to pDC.
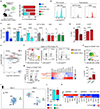
a. Spleen DC subsets were sorted from hCD2Cre+/− Rosa26EYFP+/− (hCD2EYFP) mice as shown in Fig.1f and Extended Data Fig.1a (our rationale for using hCD2EYFP mice is explained in Fig.4), and prepared for bulk RNAseq analysis. PCA plot of the top 500 most variable DEG in each DC subset (differences between EYFP+ and EYFP DC2 are analyzed in Fig.4). b. Heatmap of selected genes from (a). Shown is Z-score of normalized expression. c. Splenocytes of WT mice were enriched in CD135+ cells and stained for cell sorting. Populations #1 and #3 were purified, mixed 1:1 and processed for droplet-based genomics. Excluded lineage contains CD3+/CD19+/NK1.1+/Ly6G+ cells. d. KNetL plot of scRNAseq data. After filtering and removing a small fraction of monocytes, 2,075 cells were analyzed using the KNetL pipeline. Shown are KNetL clusters (top) and annotations based on subset-specific scores using CIBERSORTx (bottom)(Extended Data Fig.1f). e. Heatmap of selected genes differentially expressed in (d) clusters. Gene expression after normalization and imputation is shown. f. Gating strategy used for the analysis of spleen DC subsets. CD135-enriched splenocytes were stained and analyzed by flow cytometry. Excluded lineage contains CD3+/CD19+/NK1.1+/Ly6G+ cells. g. Left shows schematic of BMC generated by transplanting 50% WT (CD45.1) and 50% TCF4cKO (CD45.2) BM into lethally irradiated CD45.1 WT mice. Right shows bar graphs (mean + SD) of the contribution of donor cells to splenic DC populations (gated as in Fig.1f) in BMC, normalized to NK cells (n=6 mice in 2 experiments). Statistics were determined by one-way ANOVA with Dunnett’s multiple comparison test. h. Bar graph (mean + SD) showing the percentage of EYFP+ splenic DC (gated as in Fig.1f) in hCD2EYFP mice (n=5 mice in 4 experiments). i. Bar graph (mean + SD) showing the percentage of TdTomato+ splenic DC (gated as in Fig.1f) in CD300cTdT mice. Percentage relative to pDC is shown (n=4 mice in 3 experiments; see also Extended Data Fig.2c).
FIGURE 2.
FIGURE 2.. tDC originate from BM progenitors.
a. Percentage (mean + SD) of each DC subset recovered after the adoptive transfer of 30,000 BM or splenic CX3CR1EGFP CD45.1 pDC into CD45.2 WT non-irradiated congenic mice. Transferred cells were analyzed in the spleen of recipient mice after 2-8 days. BM: n=4 at 2- and 4-days, and n=3 at 8-days. Spleen: n=3 at 2- and 4-days, and n=2 at 8-days. N represents mice and experiments. b. Bar graphs (mean + SD) of the total number of each splenic DC subset (gated a in Fig.1f) in littermate controls (C; n=11 BDCA2-DTR−/− mice) or BDCA2-DTR+/− mice inoculated with DT and analyzed 1 day later (n=8 mice), or inoculated with DT every second day and analyzed at day 7 (n=8 mice). Data pooled from 5 exp. Statistical differences were determined by one-way ANOVA with Tukey’s multiple comparison test. c. Left shows schematic of BM cells cultured with FLT3L +/− OP9-DL1 cells. Right shows the gating strategy to detect DC subsets at 6-days of BM culture, analyzed by flow cytometry (excluded lineage contains CD3+/CD19+/F4/80+ cells). One representative of 5 experiments. d. Histograms of hCD2EYFP (left) or CD300cTdT (right) expression in BM-derived DC as defined in (c), analyzed at 6-days. One representative of 3 experiment. e. pDC and tDC percentage (mean + SD) in BM cultures from (c), gated on total live and single cells. N=5 samples/time point, except n=6 samples for FLT3L+DL1 at 4-days. Data pooled from ≥ 5 experiments. Statistical differences were determined by Two-way ANOVA with Sidak multiple comparisons test. f. Histograms of protein expression of DC markers in BM-derived DC as defined in (c) or splenic DC as defined in Fig.1f. Number indicates gMFI x 102. One representative of 3 experiments.
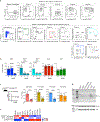
FIGURE 3.
FIGURE 3.. tDC originate from pro-pDC.
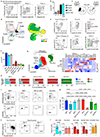
a. CD135-enriched BM cells were sorted as live/singlets/CD45+/Lineage (CD3/CD19/CD335/Ly6G) cells and prepared for scRNAseq using droplet-based genomics. After filtering for low quality cells, 2831 cells were clustered using Seurat and represented in a UMAP. b. Splenic pDC-signature in BM progenitors. A signature matrix was generated using RNAseq data of splenic DC and CIBERSORTx. Labeled are cells with a positive gene enrichment score. c. UMAP showing the expression of the indicated genes. d. UMAP of “pDChigh” cells in the BM. Cells from (b) with a pDC-specific gene enrichment score of >0.15 were selected and re-clustered using Seurat. e. Inference of differentiation trajectory of the clusters defined in (d) using Slingshot. f. Inference of differentiation trajectory of the clusters defined in (d) using RNA velocity. Velocity vector is indicated as streamlines. g. Velocity illustrating the expression of selected pDC- and tDC- specific genes. h. Unbiased X-shift clustering of BM progenitors analyzed by CyTOF and represented by UMAP. CD135-enriched BM cells were gated as Lineage (CD3/CD19/CD335/Ly6G) B220/MHCII/CD117int-lo/CD135+, and concatenated with 10,000 B220+ pDC (left). UMAP was plotted based on the expression of all markers excluding lineage, and colored based on the expression of the indicated proteins (right). i. Heatmap depicting marker enrichment modeling (MEM) scores in clusters identified in (h). imm pDC: immature pDC; early pro: early progenitors. j. CD135-enriched BM cells were gated as Lineage (CD3/CD19/ CD335/Ly6G) B220/MHCII/ CD117int-lo/CD135+ as in (h). Graphs show bi-axial gating strategy to identify immature pDC (cluster 4; CD11c+CX3CR1Ly6D+SiglecH+), pro-pDC (cluster 3; CD11c+CX3CR1+Ly6D+SiglecH+) and pro-cDC (clusters 2 and 7; CD11cCX3XR1+CD115+ Ly6C+/−). k. Bar graph (mean + SD) showing the percentage of BM pDC, imm pDC, pro-pDC and pro-cDC labeled with EYFP in hCD2EYFP mice. N=4 mice and 4 independent experiments. l. Clusters gated as in (j) were overlaid on the CyTOF UMAP of (h). m. 15,000-30,000 pro-cDC, imm pDC or pro-pDC sorted from BM of CX3CR1EGFP CD45.1 mice using the strategy described in (j) were adoptively transferred into non-irradiated WT CD45.2 congenic mice. The spleen of recipient mice was analyzed 2-4-days later to evaluate the outcome of transferred cells. Shown is the percentage (mean + SD) of each DC subset recovered in the spleen of recipient mice. Pro-cDC: n=3 at 2-days and n=5 at 4-days. Imm pDC: n=3 at 2- and 4-days. Pro-pDC: n=3 at 2-days and n=5 at 4-days. N represents number of mice and independent experiments. n. As in (m), but splenic tDC recovered following the adoptive transfer of pro-pDC were further divided into tDClo and tDChi. A representative gating strategy (left) and percentage (mean + SD) of each tDC population (right) are shown. N=3 at 2-days and n=5 at 4-days. N represents number of mice and independent experiments. o. As in (m), but progenitors were sorted from hCD2EYFP mice and adoptively transferred into congenic non-irradiated recipients. The spleen of recipient mice was analyzed for the presence of transferred cells at 4-days, which were gated as described in Fig.1f and further analyzed for EYFP expression. Shown are tDC recovered after the adoptive transfer of pro-pDC (left), DC2 recovered after the adoptive transfer of pro-pDC (middle), and DC2 recovered after the adoptive transfer of pro-cDC (right). One representative of 3 exp. p. Clusters gated as in Extended Data Fig.4a were overlaid on the CyTOF UMAP of (h).
FIGURE 4.
FIGURE 4.. tDC convert into mouse ESAM+ DC2 and human CD5+ DC2.
a. Schematic of adoptive transfer (left). 30,000 splenic tDC (All) sorted from CX3CR1EGFP CD45.1 mice using Fig.1f gating strategy, and adoptively transferred into WT CD45.2 non-irradiated congenic mice. The percentage (mean + SD) of each DC subset recovered in the spleen of recipient mice is shown 2-8 days after transfer. N=5 at 2-days, n=6 at 4-days, and n=4 at 8-days. N represents number of mice and independent experiments. b. As in (a), but tDC were sorted from hCD2EYFP mice. Histograms of hCD2EYFP expression in sorted tDC pre-transfer (left), and CD11b and CD11b+ DC2 recovered in the spleen of recipient mice at 8-days. One representative of 2 experiments. c. Bar graphs (mean + SD) of the total number of splenic DC subsets (gated a Fig.1f) in hCD2EYFP CX3CR1DTR mice inoculated (n=4 mice) or not (n=3 mice) with DT every second day and analyzed at day 7. Statistics were determined by unpaired two-tailed t-test. Data pooled from 2 experiments. d. As in (c), but DC2 gated as in Fig.1f were further divided in EYFP+ and EYFP cells, and their frequencies were plotted. e. Splenic EYFP+ and EYFP DC2 were sorted from hCD2EYFP mice and prepared for bulk-RNAseq analysis (Extended Data Fig.1a). MA plot comparing differences between EYFP+ and EYFP DC2. Genes with 2-fold Log2 change are colored in red (up) or blue (down). f. Splenic DC2 from hCD2EYFP mice were gated as in Fig.1f and further analyzed to delineate ESAM+ and CX3CR1+ subpopulations (left). EYFP expression in ESAM+ and CX3CR1+ DC2 (right). One representative of 8 experiments. g. DC2 from the spleen of hCD2EYFP mice were gated on CX3CR1+, ESAM+ EYFP+ and EYFP as shown in (f)(left). Each DC2 subpopulation was analyzed for their relative expression of surface markers. Heatmap shows the Z-scored gMFI (right). Z-score values was determined from n ≥ 2 mice. Data pooled from 8 independent experiments. h. Dot plot of ESAM+ DC2 gated as in (f) was colored base on EYFP expression (top). Bar graph (mean + SD) showing the percentage of EYFP+ in ESAM+ CD24 and ESAM+ CD24+ (bottom)(n=5 mice in 4 experiments). Statistics were determined by unpaired two-tailed t-test. i. Freshly isolated tDC were sorted from human blood and stimulated with CD40L for 2-days. Cells were analyzed by CyTOF and Scaffold at time 0 and 2-days post-stimulation (n=3 samples in 3 independent experiments). j. As in (i), but bar graph shows the frequency (mean + SD) of tDC mapped to each scaffold landmark node at day 0 and 2 post-stimulation. N=2 at 0 days and n=3 at 2-days. N represents number of samples and independent experiments. k. Heatmap of the expression of the indicated markers in freshly isolated (day 0) and stimulated (day 2) human tDC analyzed by CyTOF and flow cytometry. The frequency of positive cells for each marker is shown (≥ 2 donors/per marker in ≥ 2 experiments).
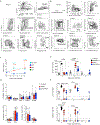
FIGURE 5.
FIGURE 5.. tDC are distinct from pre-cDC.
a. CD135-enriched splenic cells were stained for flow cytometry to identify pre-cDC. Lineage includes CD3+/CD19+/NK1.1+/Ly6G+ cells. One representative of 3 experiments. b. Populations gated as in (a) were analyzed for their percentage of EYFP+ (mean + SD) in hCD2EYFP mice (n=3 mice in 3 experiments). tDC were gated as in Fig.1f. c. Frequency of pop#4 and pop#5 within the tDC gate is shown as the mean of n=3 mice in 3 experiments. d. CD135-enriched splenocytes from hCD2EYFP mice were labeled for flow cytometry, gated as live/singlets/CD3/CD19/NK1.1/Ly6G cells and analyzed by UMAP. DC subset assignment (left) was done by gating cells as in Fig.1f. UMAP was labeled for EYFP (right). One representative of 3 experiments. e. CD135-enriched splenocytes gated as in Fig.1f were further analyzed for the identification of CD11b DC2, pre-DC2 and pre-DC1. One representative of 5 experiments. f. Splenocytes from hCD2EYFP mice gated as in Fig.1f and Fig.5e were analyzed for the frequency (mean + SD) of EYFP+ cells. N=5 mice in 5 experiments. g. CD135-enriched splenocytes were stained and analyzed by CyTOF. CD3/CD19/NK1.1/Ly6G cells were gated as in Fig.1f and Fig.5e, and overlaid into the UMAP of all cells (left)(n=3 mice in 1 exp.). Heatmap of the Z-scored expression of each marker analyzed by CyTOF or flow cytometry (right)(n=3 mice/surface marker). h. Percentage (mean + SD) of each DC subset recovered after the adoptive transfer of 10,000-30,000 CX3CR1EGFP CD45.1 cell populations (gated as described in Fig.1f and Fig.5e). Transferred cells were analyzed in the spleen of recipient mice after 2 or 4 days. tDClo and tDChi: n=3 at 2-days and n=5 at 4-days. CD11bDC2: n=3 at 2-days and n=4 at 4-days. Pre-DC2: n=3 at 2- and 4-days. Pre-DC1, n=2 at 2-days and n=4 at 4-days. N represents number of mice and independent experiments. i. As in (h), but cells were sorted from hCD2EYFP mice and adoptively transferred into congenic non-irradiated recipients. The spleen of recipient mice was analyzed for the expression of ESAM and CX3CR1 (top panels) or EYFP (bottom panels) at 4-days post-transfer. One representative of 3 experiment. j. As in (h), but splenic cells recovered following the adoptive transfer of tDClo were analyzed as tDClo and tDChi. One representative of 3 experiments. k. WT mice were pulsed with BrDU for 14 days. 6-8-days post-BrDU removal, DC subsets gated as in Fig.1f and Fig.5e were analyzed for their BrDU content by flow cytometry. The frequency of BrDU+ cells (mean + SD) is shown. N=4 mice in 2 experiments. Statistical differences were determined by one-way ANOVA with Tukey’s multiple comparison test. l. Bar graphs (mean + SD) showing the total number of splenic DC (gated a Fig.1f and Fig.5e) in hCD2EYFP CX3CR1DTR mice inoculated or not with DT every second day, and analyzed at day 10 (n=3 mice in two experiments). See also Extended Data Fig.6d-e. Statistical differences were determined by unpaired two-tailed t-test.
FIGURE 6.
FIGURE 6.. IRF4 is required for tDC transition to CD11b DC2.
a. Bar graphs (mean + SD) showing EGFP expression in splenic DC from IRF4cKO, gated as described in Fig.1f and Fig.5e. N=11 mice/subset, except n=8 mice for pre-DC2, in ≥ 4 experiments. Statistical differences were determined by one-way ANOVA followed by Tukey multiple comparison test. b. Bar graphs (mean + SD) show the frequency of DC in IRF4control mice and IRF4cKO mice analyzed for the proportion of each splenic DC population, gated as in Fig.1f and Fig.5e. pDC, DC2 and DC1: n=9 (IRF4control) and n=11 (IRF4cKO). tDC (All), tDClo and tDChi: n=9 (IRF4control) and n=11 (IRF4cKO). CD11bDC2: n=5 (IRF4control) and n=5 (IRF4cKO). Pre-DC2: n=5 (IRF4control) and n=5 (IRF4cKO). ESAM+DC2 and CX3CR1+DC2: n=7 (IRF4control) and n=8 (IRF4cKO). N represents mice in ≥4 independent experiments. Statistical differences were determined by two-way ANOVA with Sidak multiple comparison test, and t-test for CD11bDC2 and pre-DC2. c. Left shows schematic of BM chimera generated by transplanting 50% WT (CD45.1) and 50% IRF4cKO (CD45.2) BM. Right shows bar graphs (mean + SD) of the contribution (ratio) of donor cells to splenic DC populations (top) or DC2 subpopulations (bottom) in mixed BMC, normalized to NK cells (n=7 mice in 2 experiments). Statistical differences were determined by one-way ANOVA with Dunnett’s multiple comparison test. d. Schematic of adoptive transfer (left). 30,000 tDC (All) were sorted from CD45.2 IRF4control and IRF4cKO, and transferred to CD45.1 WT. Right graphs show the total # of recovered cells (mean + SD) in the spleen 2-8-days post-transfer (n=3 mice in 3 experiments/time point). Statistical differences were determined by two-way ANOVA with Sidak multiple comparison test. Colored p-values represent statistical difference between DC2 and tDCs (cyan), or DC2 and CD11b DC2 (gray).
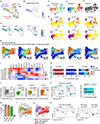
FIGURE 7.
FIGURE 7.. tDC respond to TLR stimulation and activate antigen-specific naïve T cells.
a. CD135-enriched splenic DC were activated or not with a cocktail of TLR agonists consistent on LPS/PolyIC/Resiquimod/CpGA (stimulated) for 3 hrs before sorting (as described in Extended Data Fig.1a), and prepared for bulk RNAseq (n=2 mice in 2 exp.). PCA plot of the top 500 most variable DEG in each unstimulated or stimulated DC subset. b. GSEA of selected pathways using the 500 most variable DEG. Each DC subset was compared to their respective unstimulated control. c. Heatmap of selected genes from the GSEA analysis in (b). d. Sorted CTV-labeled naïve OT-II CD4+ T cells were co-cultured with sorted splenic DC subsets (purified using the gating strategy in Fig.1f and Fig.4f) at a ratio of 5:1 (T cell:DC), in the presence of OVA protein. Four days after co-culture, cells were analyzed by flow cytometry. Left: representative flow cytometry analysis. Right: bar graphs (mean + SD) of T cell proliferation. N=5 for CD11b DC2, n=7 for tDChi, and n=8 for all the other groups. N represents biologically independent samples in ≥ 2 experiments. Statistical differences were determined by one-way ANOVA with Tukey’s multiple comparison test.
FIGURE 8.
FIGURE 8.. Secretion of IL-1β by tDC results in immunopathology in pDC-depleted mice.
a. Liver pDC and tDC numbers (mean + SD) at 2- and 5-days following M-CoV infection of pDCΔ and pDCΔtDCΔ (n=3/group at 2-days and n=5/group at 5-days) vs control mice (n=11 at 2-days and n=9 at 5-days). pDCΔ mice are BDCA2-DTR+/− mice inoculated with DT one day before M-CoV infection. pDCΔtDCΔ are hCD2EYFP CX3CR1DTR mice inoculated with DT every other day for 5-days before M-CoV infection. Control mice are a combination of BDCA2-DTR+/− or hCD2EYFP CX3CR1DTR mice inoculated with PBS, and DTR−/− mice inoculated with DT (no difference in control mice was observed). N represents mice. Data pooled from ≥ 3 experiments. b. Percent weight loss (left, mean + SD) and survival curve (right) of control (n=12), IFNAR1KO (n=8), pDCΔ (n=7) and pDCΔtDCΔ (n=8) mice. Health status was monitored twice daily, and moribund mice were euthanized. N represents mice. Data pooled from 4 experiments. c. Serum ALT levels (mean + SD) determined 5-days post-M-CoV infection (n=4 mice for control; n=6 mice for pDCΔ; n=7 mice for pDCΔtDCΔ). Data pooled from 3 independent experiments. d. The number of liver monocytes and neutrophils (mean + SD) were evaluated by flow cytometry 2- and 5-days post-M-CoV infection as in (a). Day 2: n=14 for control, n=4 for pDCΔ and n=6 mice for pDCΔtDCΔ. Day 5: n=10 for control, n=5 mice for pDCΔ and n= 6 mice for pDCΔtDCΔ. N represents mice. Data pooled from 3 or more exp. e. Liver viral titers (log10 pfu / gr. tissue) were determined 5-days post-M-CoV infection (n=10 mice for control, n=7 mice/group for pDCΔ and pDCΔtDCΔ). Violin plots show data pooled from 4 experiments. f. Serum levels of IL-1β were determined 2-days post-M-CoV infection by Luminex (n=7 mice for control, n=8 mice/group for pDCΔ and pDCΔtDCΔ). Data pooled from 4 experiments. g. pDCΔ mice were inoculated with anti-IL-1β Ab 2-days post-M-CoV-infection, and the percent weight loss (mean + SD) was measured over time. N=5 mice for pDCΔ + control Ab, and n=6 mice for pDCΔ + α-IL1-β Ab. Data pooled from 3 experiments. h. As in (g), but serum ALT levels (mean + SD) were evaluated at 5-days post-infection. N=4 mice for control, n=7 mice for pDCΔ + control Ab, and n=6 mice for pDCΔ + α-IL1-β Ab. Data pooled from 3 experiments. i. As in (g), but numbers of liver monocytes and neutrophils (mean + SD) were quantified by flow cytometry at 5-days post-M-CoV infection. N=4 mice for control, n=5 mice for pDCΔ + control Ab, and n=6 mice for pDCΔ + α-IL1-β Ab. Data pooled from 3 independent experiments. j. As in (g), but liver viral titers (log10 pfu / gr. tissue) were evaluated 5-days post-M-CoV infection. N=4 mice for control, n=7 mice for pDCΔ + control Ab, and n=6 mice for pDCΔ + α-IL1-β Ab. Violin plots show data pooled from 3 experiments. k. DC subsets gated as in Fig.1f and Fig.4g were sorted and incubated with M-CoV or mock (supernatant from non-infected L929 cells) using an MOI of 1. Culture supernatant was analyzed by CBA 14-16 hrs later (n=5 samples in 3 experiments). Minimum and maximum values are indicated via whiskers, while the interquartile range and median are marked with the box. l. Human blood enriched DCs were left unstimulated (control) or stimulated with CpG-A for 6-9 hrs, and then analyzed for intracellular IL-1β by flow cytometry (circles) or CyTOF (square). N=5 donors for tDC and pDC and n=3 donors for DC1 and DC2. Data pooled from 4 experiments. Minimum and maximum values are indicated via whiskers, while the interquartile range and median are marked with the box. m. As in (l), but cells were stimulated with CpG-A or influenza virus, and analyzed by CyTOF in one experiment. n. As in (l), but pDC and tDC were sorted and incubated with MRC5 fibroblast cell line alone or MRC5 infected with CMV (CMV-MRC5) for 6 hrs, and analyzed for intracellular IL-1β by flow cytometry in one experiment. Statistical differences were determined by Two-way ANOVA with Tukey’s multiple comparisons test (a-c,g), by One-way ANOVA with Tukey’s multiple comparisons test (d-f,h-l) or Mantel-Cox test for survival curves (b).

Comment in

Similar articles

Cited by

References

    1. Guilliams M. et al. Dendritic cells, monocytes and macrophages: a unified nomenclature based on ontogeny. Nat Rev Immunol 14, 571–578 (2014). - PMC - PubMed
    1. Reizis B. Plasmacytoid Dendritic Cells: Development, Regulation, and Function. Immunity 50, 37–50 (2019). - PMC - PubMed
    1. Alcántara-Hernández M. et al. High-Dimensional Phenotypic Mapping of Human Dendritic Cells Reveals Interindividual Variation and Tissue Specialization. Immunity 47, 1037–1050.e6 (2017). - PMC - PubMed
    1. Leylek R. et al. Integrated Cross-Species Analysis Identifies a Conserved Transitional Dendritic Cell Population. Cell Reports 29, 3736–3750.e8 (2019). - PMC - PubMed
    1. See P. et al. Mapping the human DC lineage through the integration of high-dimensional techniques. Science 356, eaag3009 (2017). - PMC - PubMed

METHODS-ONLY REFERENCES

    1. Persson EK et al. IRF4 Transcription-Factor-Dependent CD103+CD11b+ Dendritic Cells Drive Mucosal T Helper 17 Cell Differentiation. Immunity 38, 958–969 (2013). - PubMed
    1. Alcántara-Hernández M & Idoyaga J Mass cytometry profiling of human dendritic cells in blood and tissues. Nat Protoc 16, 4855–4877 (2021). - PMC - PubMed
    1. Diggins KE, Greenplate AR, Leelatian N, Wogsland CE & Irish JM Characterizing cell subsets using marker enrichment modeling. Nat Methods 14, 275–278 (2017). - PMC - PubMed
    1. Spitzer MH et al. An interactive reference framework for modeling a dynamic immune system. Science 349, 1259425 (2015). - PMC - PubMed
    1. Love MI, Huber W & Anders S Moderated estimation of fold change and dispersion for RNA-seq data with DESeq2. Genome Biol 15, 550 (2014). - PMC - PubMed

Publication types