. 2023 Aug;37(8):1611-1625.
doi: 10.1038/s41375-023-01951-8. Epub 2023 Jul 6.

The ribosomal protein S6 kinase alpha-1 (RPS6KA1) induces resistance to venetoclax/azacitidine in acute myeloid leukemia

Affiliations

The ribosomal protein S6 kinase alpha-1 (RPS6KA1) induces resistance to venetoclax/azacitidine in acute myeloid leukemia

Katharina Weidenauer et al. Leukemia. 2023 Aug.

Abstract

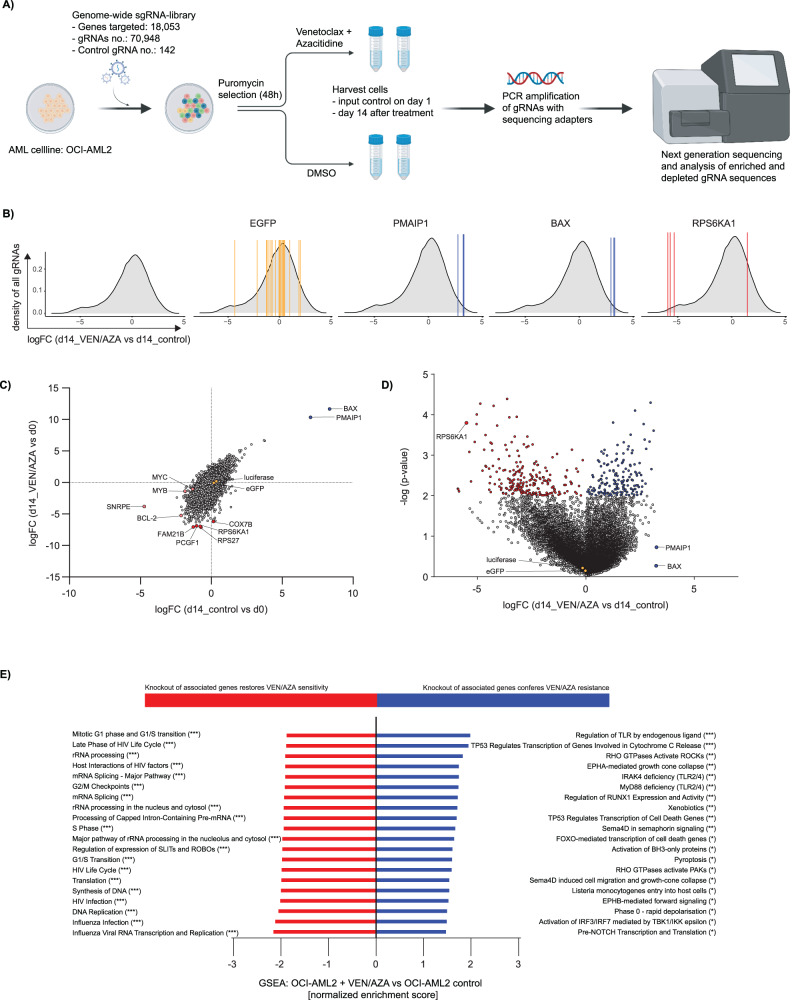
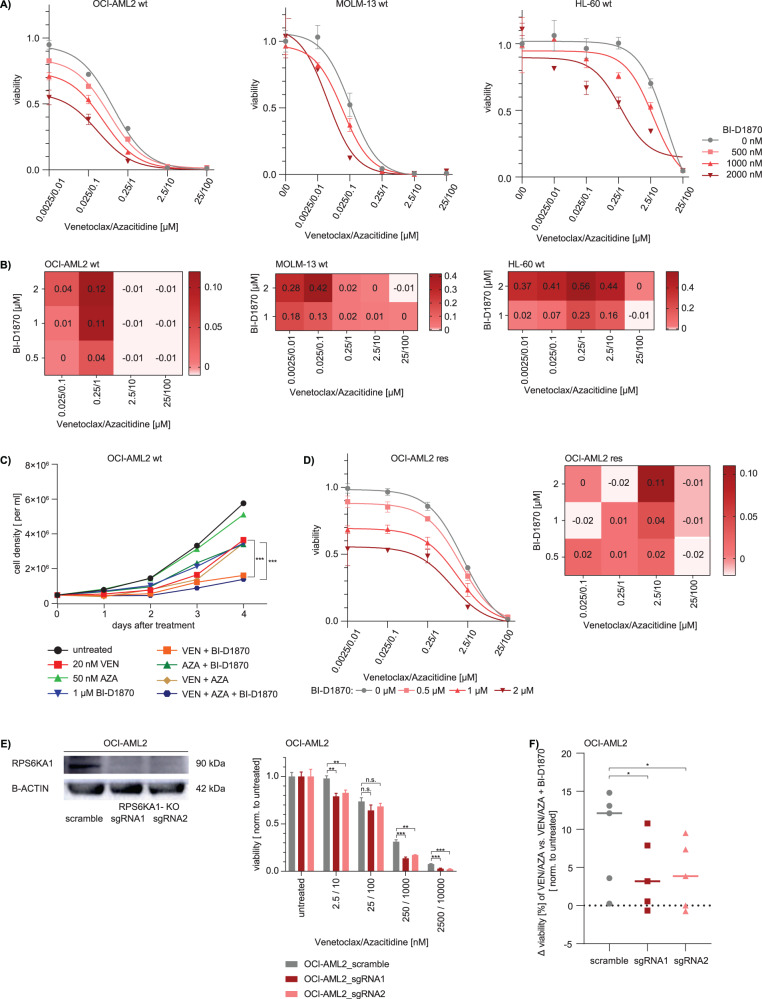
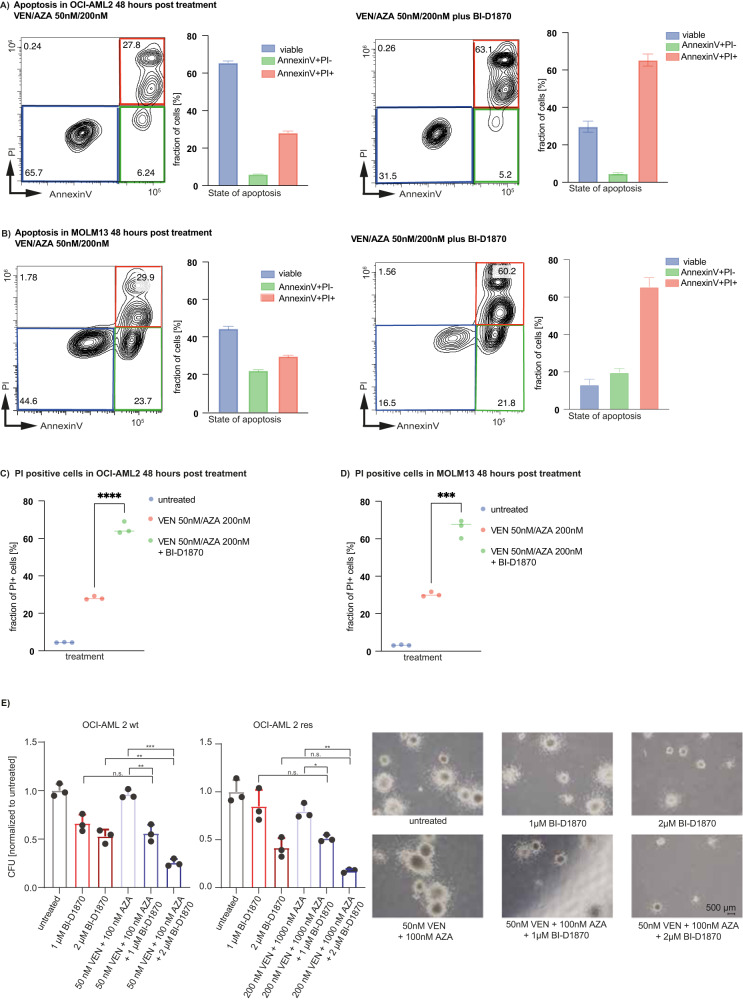
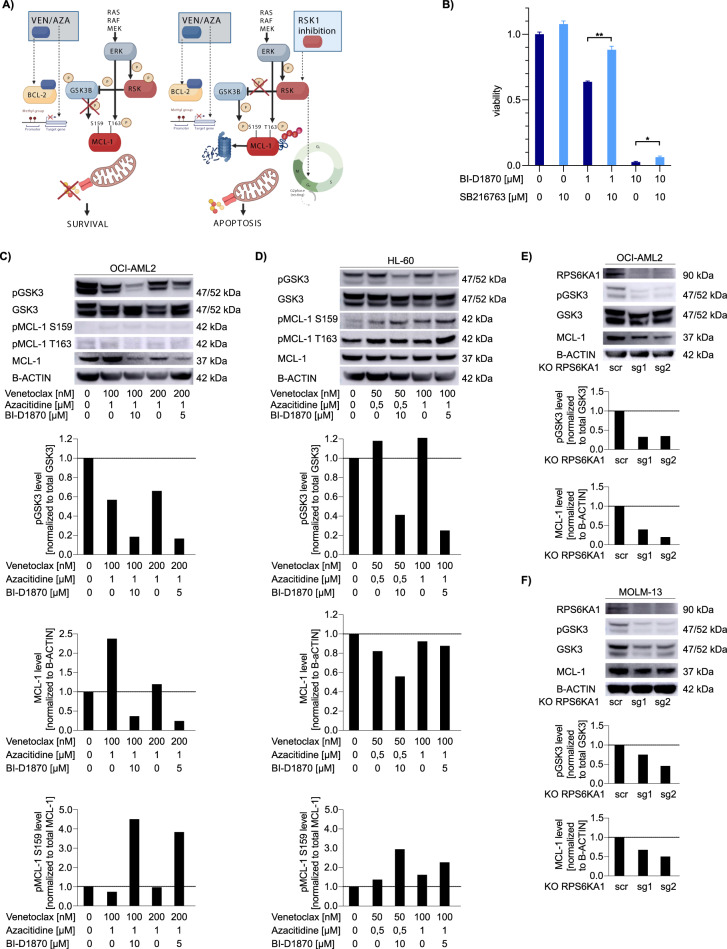
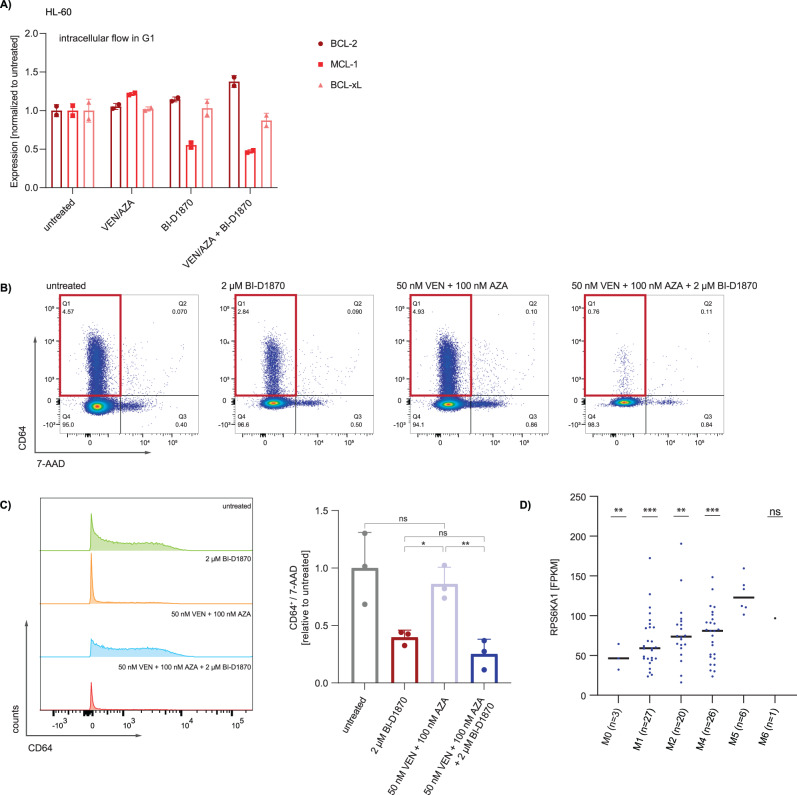
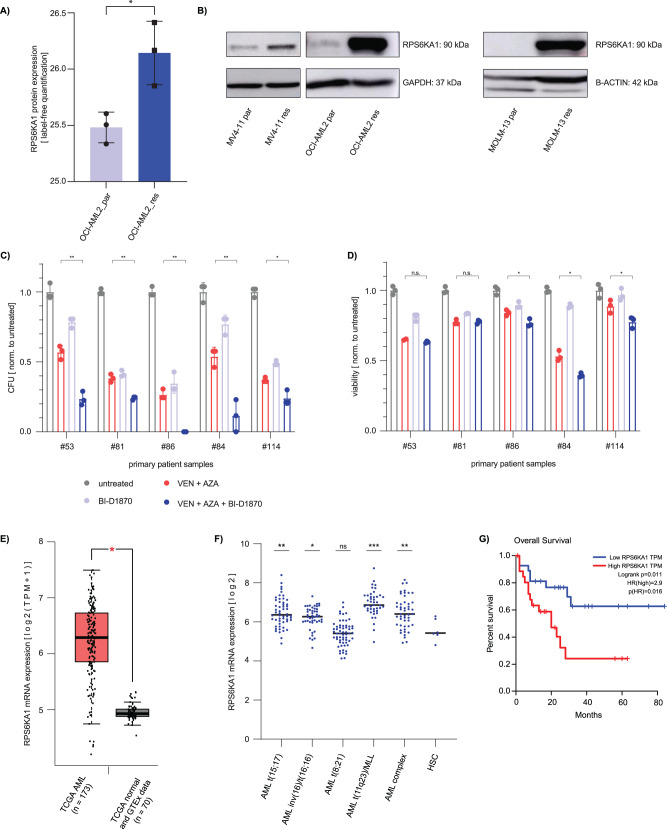
Venetoclax/azacitidine combination therapy is effective in acute myeloid leukemia (AML) and tolerable for older, multimorbid patients. Despite promising response rates, many patients do not achieve sustained remission or are upfront refractory. Identification of resistance mechanisms and additional therapeutic targets represent unmet clinical needs. By using a genome-wide CRISPR/Cas9 library screen targeting 18,053 protein- coding genes in a human AML cell line, various genes conferring resistance to combined venetoclax/azacitidine treatment were identified. The ribosomal protein S6 kinase A1 (RPS6KA1) was among the most significantly depleted sgRNA-genes in venetoclax/azacitidine- treated AML cells. Addition of the RPS6KA1 inhibitor BI-D1870 to venetoclax/azacitidine decreased proliferation and colony forming potential compared to venetoclax/azacitidine alone. Furthermore, BI-D1870 was able to completely restore the sensitivity of OCI-AML2 cells with acquired resistance to venetoclax/azacitidine. Analysis of cell surface markers revealed that RPS6KA1 inhibition efficiently targeted monocytic blast subclones as a potential source of relapse upon venetoclax/azacitidine treatment. Taken together, our results suggest RPS6KA1 as mediator of resistance towards venetoclax/azacitidine and additional RPS6KA1 inhibition as strategy to prevent or overcome resistance.


Conflict of interest statement

The authors declare no competing interests.

Figures

Fig. 1
Fig. 1. A genome-wide CRISPR/Cas9 library screen identified genes associated with resistance and sensitivity towards venetoclax/azacitidine in AML cells.
A Overview of the experimental design and workflow of the CRISPR/Cas9 library screen: OCI-AML2 cells were infected with the genome-wide Toronto KnockOut sgRNA library v3 and treated either with 20 nM venetoclax and 50 nM azacitidine or DMSO. Samples were taken at day 1 and 14 after start of treatment. Genomic DNA was PCR- amplified and the relative abundance of sgRNAs was determined by next generation sequencing. This figure was created with BioRender.com. B Density plots showing the average distribution of log-fold change values for all sgRNAs (left) between treatment and control group on day 14, and single sgRNAs (middle to right) demonstrating the concordance among different sgRNAs targeting a given gene. The single sgRNAs were highlighted for eGFP as non-targeting control, PMAIP1 and BAX as positively enriched sgRNA-genes and RPS6KA1 as negatively enriched sgRNA-gene. C Log-fold change values of all sgRNA-genes from day 14 to day 0. The comparison of sgRNA abundance in venetoclax/azacitidine vs. DMSO treated samples revealed genes associated with resistance or sensitivity towards venetoclax/azacitidine treatment. Blue and red color encodes positive and negative enrichment, respectively. Orange color denotes non-targeting sgRNA-genes. D Volcano plot showing log-fold change values and significance of all sgRNA-genes from day 14 in venetoclax/azacitidine vs. DMSO treated cells. RPS6KA1 is among the strongest depleted sgRNA-genes in venetoclax/azacitidine- treated cells while PMAIP1 and BAX are positively enriched. Non-targeting sgRNAs for luciferase and eGFP are not altered by drug stimulation. E Gene set enrichment analysis of sgRNA-genes ranked by their LFC values. The top 20 significantly upregulated (filtered for a gene set size larger than 100 genes) or downregulated gene sets in venetoclax/azacitidine- treated OCI-AML2 cells vs. untreated control cells (T14) are shown. *p < .05, **p .01, ***p .001. Statistical significance was determined by a two-sided unpaired Student`s t test. The variance was similar between the groups.
Fig. 2
Fig. 2. Pharmacological inhibition of RPS6KA1 as well as RPSKA1 knockout decreases cell proliferation in different AML cell lines and RPS6KA1 inhibition resensitizes resistant AML cells to venetoclax/azacitidine treatment.
A Viability assay and IC50 measurements. Parental (wt) OCI-AML2, MOLM-13, HL-60 cells were treated with a premixed combination of venetoclax/azacitidine in serial dilutions and different concentrations of the RPS6KA1 inhibitor BI-D1870. Cell viability was assessed upon drug exposure for 72 h and normalized to DMSO control. Depicted are means ± SD from three technical replicates. Data are representative for 3 independent experiments. B Synergism was calculated for different drug combinations of venetoclax/azacitidine with BI-D1870 in parental (wt) OCI-AML2, MOLM-13, HL-60 cells. The synergy score was computed according to the Bliss Independence Model and depicted as a heatmap. Positive and negative Bliss Scores are indicative for synergism and antagonism, respectively, while neutral Bliss Scores are often confounded by strong single drug effects. C Proliferation assay. Parental (wt) OCI-AML2 cells were seeded with a density of 0.5 × 106 per ml and treated either with venetoclax, azacitidine, BI-D1870 or different combinations of the three drugs. Cell number was quantified by serial cell counting over 4 days. Depicted are means from three technical replicates. Data are representative for 2 independent experiments. *p < 0.05, **p < 0.01, ***p < 0.001. Statistical significance was determined by a two-sided unpaired Student`s t test. The variance was similar between the groups. D Viability assay, IC50 measurements and synergy calculation. Resistant (res) OCI-AML2 cells were treated with a premixed combination of venetoclax/azacitidine in serial dilutions and different concentrations of the RPS6KA1 inhibitor BI-D1870. Cell viability was assessed upon drug exposure for 48 h and normalized to DMSO control. Depicted are means ± SD from three technical replicates. The synergy score was computed according to the Bliss Independence Model and depicted as a heatmap. Positive and negative Bliss Scores are indicative for synergism and antagonism, respectively, while neutral Bliss Scores are often confounded by strong single drug effects. Data are representative for three independent experiments. E RPS6KA1 knockout was established in OCI-AML2 cells and validated via western blot. Those cells were treated with a premixed combination of venetoclax/azacitidine in serial dilutions. Cell viability was assessed upon drug exposure for 72 h and normalized to untreated control. Depicted are means ± SD from three technical replicates. Data are representative for three independent experiments. F The difference of viability in cells treated with different doses of venetoclax/azacitidine attained upon the addition of RPS6KA1 inhibition to the treatment was calculated and compared for OCI-AML2 scramble cells versus OCI-AML2 cells with RPS6KA1 knockout. Data was calculated from means from three technical replicates.
Fig. 3
Fig. 3. Inhibition of RPS6KA1 increases apoptosis and diminishes colony formation capacity when combined with venetoclax/azacitidine.
Apoptosis assay. Parental (wt) OCI-AML2 (A) and MOLM-13 (B) cells were treated with venetoclax/azacitidine with or without BI-D1870 for 48 h. Cells were stained with Annexin V-pacific blue as an apoptosis marker and propidium iodide as a necrosis marker and analyzed by flow cytometry. The blue boxes and bars indicate the fraction of viable cells. The green boxes and bars indicate the fraction of cells undergoing apoptosis. The red boxes and bars indicate the fraction of cells undergoing necrosis. FACS plots are representative for one technical replicate out of three and two independent experiments. C Comparison of the fraction of PI positive OCI-AML2 cells in untreated cells (median: 4.44), cells treated with either venetoclax/azacitidine (median: 27.8) or venetoclax/azacitidine with BI-D 1870 (median: 63.9), ****p < 0.0001. Statistical significance was determined by a two-sided unpaired Student`s t test. The variance was similar between the groups. D Comparison of the fraction of PI positive MOLM-13 cells in untreated cells (median: 3.12), cells treated with either venetoclax/azacitidine (median: 29.9) or venetoclax/azacitidine with BI-D 1870 (median: 67), ***p 0.0003. Statistical significance was determined by a two-sided unpaired Student`s t test. The variance was similar between the groups. E Colony forming unit (CFU) assay with parental (wt) and resistant (res) OCI-AML2 cells. 300 cells were seeded in methylcellulose and treated with venetoclax/azacitidine, BI-D1870 or the combination of all three drugs with different venetoclax/azacitidine concentrations used in wildtype (wt) and resistant (res) OCI-AML2 cells. Colonies with at least 50 cells were quantified 8 days after seeding and normalized to untreated samples. Depicted are means ± SD from three technical replicates. Data are representative for three independent experiments. Representative images are shown from colonies of parental (wt) OCI-AML2 cells. *p < 0.05, **p 0.01, ***p 0.001. Statistical significance was determined by a two-sided unpaired Student`s t test. The variance was similar between the groups.
Fig. 4
Fig. 4. RPS6KA1 inhibition increases the activity of GSK3, increases phosphorylation of MCL-1 at serine 159 and reduces total MCL-1 levels.
A Schematic overview on the proposed mechanism of action of combining venetoclax/azacitidine with inhibition of RPS6KA1. B OCI-AML2 cells were treated with the RPS6KA1 inhibitor BI-D1870 and/or the GSK3 inhibitor SB216763. Depicted are means ± SD from three technical replicates. Data are representative for three independent experiments. *p < .05, **p .01, ***p .001. Statistical significance was determined by a two-sided unpaired Student`s t test. The variance was similar between the groups. OCI-AML2 (C) and HL-60 (D) cells were treated with given dose of venetoclax, azacitidine with/without BI-D1870 for 16 h. Protein expression of pGSK3, GSK3, pMCL-1 S159, pMCL-1 T163 and MCL-1 were analyzed by western blotting. B-ACTIN levels are given as loading control. Quantification was performed using ImageJ. Data are representative for two independent experiments. OCI-AML2 (E) and MOLM-13 (F) cells were transduced with plasmids for either scramble control or knockout of RPS6KA1 (two different sgRNAs). Protein expression of pGSK3, GSK3 and MCL-1 were analyzed by western blotting. B-ACTIN levels are given as loading control. Quantification was performed using ImageJ. Data are representative for two independent experiments.
Fig. 5
Fig. 5. Pharmacological inhibition of RPS6KA1 targets monocytic subpopulations which are resistant to venetoclax/azacitidine treatment.
HL-60 (A) cells were treated with venetoclax (100 nM in OCI-AML2; 50 nM in HL-60) and azacitidine (1000 nM in OCI-AML2; 500 nM in HL-60) with or without 10 µM BI-D1870 for 16 h. Levels of BCL-2, BCL-XL and MCL-1 were determined by intracellular staining and analysis via flow cytometry. Analysis was carried out for cells in G1 state. Data is shown as mean ± s.d. from three technical replicates. Data are representative for two independent experiments. B Flow cytometric analysis of cell surface markers. Parental (wt) OCI-AML2 cells were isolated after CFU assays under different treatment conditions, stained with a panel of myeloid differentiation markers (CD11b, CD64, CD117, GPR56 and CD34) and analyzed by flow cytometry. FACS plots are representative for one technical replicate out of three showing expression levels of the monocytic cell surface marker CD64 and the vital marker 7-AAD. C Fraction of CD64+/7-AAD- subpopulation in parental (wt) OCI-AML2 cells isolated from CFU assays upon treatment with venetoclax/azacitidine, BI-D1870 or the combination of all three drugs. Depicted are means ± SD from three technical replicates. *p < .05, **p .01, ***p .001. Statistical significance was determined by a two-sided unpaired Student`s t test. The variance was similar between the groups. D mRNA expression levels of RPS6KA1 in AML patient samples subdivided by the corresponding FAB category. RPS6KA1 is expressed at higher levels in monocytic AML subtype M5 compared to AML from other FAB categories. Expression data are obtained from Zhou et al. [50]. All p values involve comparison with FAB M5. *p < 0.05, **p 0.01, ***p 0.001. Statistical significance was determined by a two-sided unpaired Student`s t test. The variance was similar between the groups.
Fig. 6
Fig. 6. Increased RPS6KA1 expression is associated with resistance to venetoclax/azacitidine and a worse overall survival whereas RPS6KA1 inhibition enhances the effect of venetoclax/azacitidine in primary AML samples.
A Label-free mass spectrometric analysis of RPS6KA1 protein expression in parental (wt) and resistant (res) OCI-AML2 cells. Depicted are means ± SD from three technical replicates. *p < 0.05, **p 0.01, ***p 0.001. Statistical significance was determined by a two-sided unpaired Student`s t test. The variance was similar between the groups. B RPS6KA1 western blot in three different cell lines with acquired resistance to venetoclax/azacitidine. GAPDH and B-ACTIN expression, respectively, served as loading control. Blots are representative for three independent experiments. C Colony forming unit (CFU) assay from primary AML patient samples. 4000 cells were seeded in methylcellulose and treated with venetoclax/azacitidine, BI-D1870 or the combination of all three drugs. Colonies with at least 50 cells were quantified 8 days after seeding and normalized to untreated samples. Depicted are means ± SD from three technical replicates. *p < 0.05, **p 0.01, ***p 0.001. Statistical significance was determined by a two-sided unpaired Student`s t test. The variance was similar between the groups. D Viability assay from primary AML patient samples. Two samples from newly diagnosed AML patients (#84, #114) who responded to venetoclax/azacitidine treatment and three samples from relapsed AML patients (#53, #81, #86) after venetoclax/azacitidine treatment were treated with venetoclax/azacitidine, BI-D1870 or the combination of all three drugs. Cell viability was assessed upon drug exposure for 48 h and normalized to untreated control. Depicted are means ± SD from three technical replicates. *p < 0.05, **p 0.01, ***p 0.001. Statistical significance was determined by a two-sided unpaired Student`s t test. The variance was similar between the groups. E RPS6KA1 mRNA expression levels in AML and healthy bone marrow. RPS6KA1 mRNA expression data are derived from the TCGA-AML dataset and the TCGA and GTEx data set of normal tissue [39] *p < 0.05. Statistical significance was determined by a two-sided unpaired Student`s t test. The variance was similar between the groups. F RPS6KA1 mRNA expression levels in AML with different cytogenetical aberrations [40]. Compared to healthy hematopoietic stem cells (HSC), RPS6KA1 expression was increased in AML with the mutations t(15;17), inv(16)/t(16;16), t(11q23)/MLL and in AML with complex karyotype. *p < 0.05, **p 0.01, ***p 0.001. Statistical significance was determined by a two-sided unpaired Student`s t test. The variance was similar between the groups. G Kaplan-Meier-Plot showing overall survival. High RPS6KA1 mRNA expression in AML patients correlates with a shorter overall survival compared to patients with low RPS6KA1 mRNA expression. For survival analysis the TCGA-AML dataset was used and the quartile with the highest RPS6KA1 expression (n = 27) was compared to the quartile with the lowest RPS6KA1 expression (n = 27) [39]. Log-rank test.

References

    1. Almeida AM, Ramos F. Acute myeloid leukemia in the older adults. Leuk Res Rep. 2016;6:1–7. - PMC - PubMed
    1. DiNardo CD, Pratz K, Pullarkat V, Jonas BA, Arellano M, Becker PS, et al. Venetoclax combined with decitabine or azacitidine in treatment-naive, elderly patients with acute myeloid leukemia. Blood. 2019;133:7–17. doi: 10.1182/blood-2018-08-868752. - DOI - PMC - PubMed
    1. Lagadinou ED, Sach A, Callahan K, Rossi RM, Neering SJ, Minhajuddin M, et al. BCL-2 inhibition targets oxidative phosphorylation and selectively eradicates quiescent human leukemia stem cells. Cell Stem Cell. 2013;12:329–41. doi: 10.1016/j.stem.2012.12.013. - DOI - PMC - PubMed
    1. DiNardo CD, Jonas BA, Pullarkat V, Thirman MJ, Garcia JS, Wei AH, et al. Azacitidine and venetoclax in previously untreated acute myeloid leukemia. N Engl J Med. 2020;383:617–29. doi: 10.1056/NEJMoa2012971. - DOI - PubMed
    1. Döhner H, Weisdorf DJ, Bloomfield CD. Acute myeloid leukemia. N. Engl J Med. 2015;373:1136–52. doi: 10.1056/NEJMra1406184. - DOI - PubMed

Publication types

MeSH terms

Substances