. 2023 Jul;5(7):1188-1203.
doi: 10.1038/s42255-023-00834-7. Epub 2023 Jul 6.

Human resident liver myeloid cells protect against metabolic stress in obesity

Affiliations

Human resident liver myeloid cells protect against metabolic stress in obesity

Emelie Barreby et al. Nat Metab. 2023 Jul.

Abstract

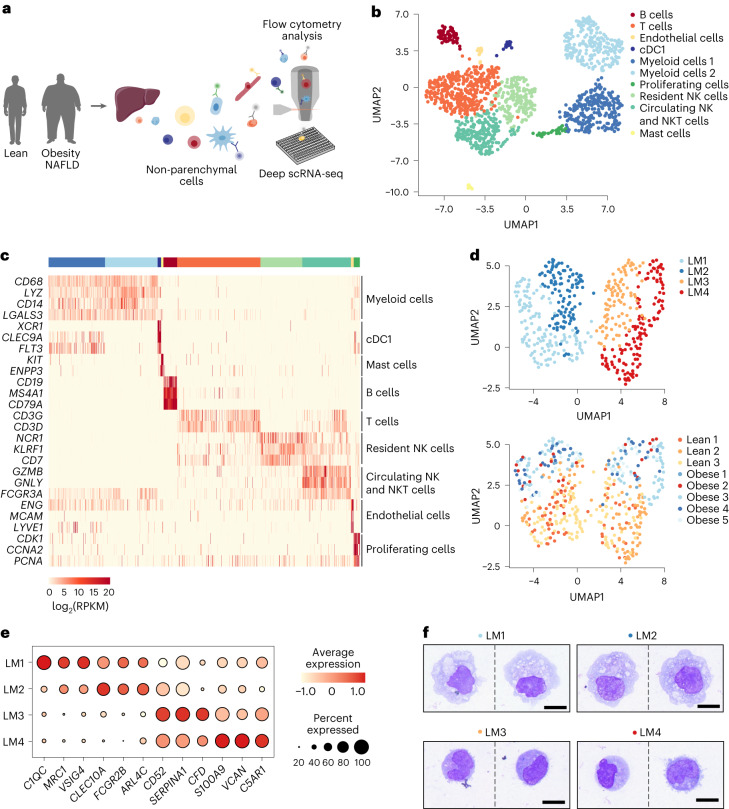
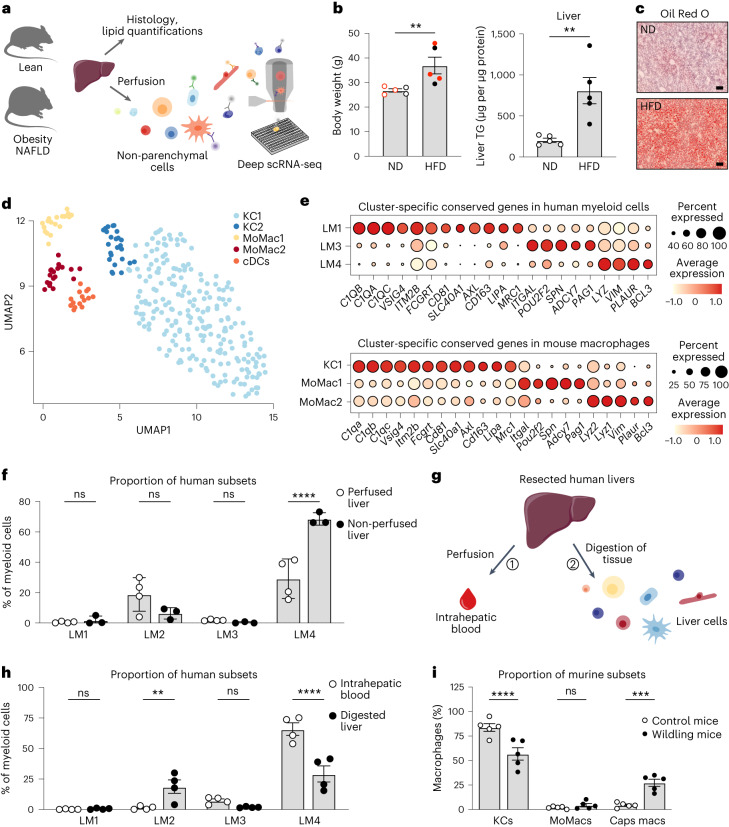
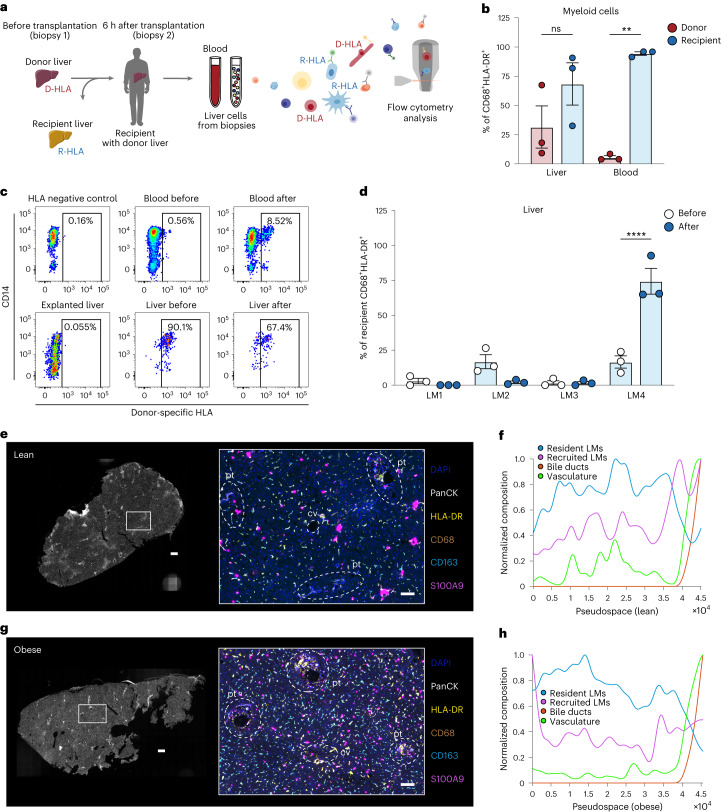
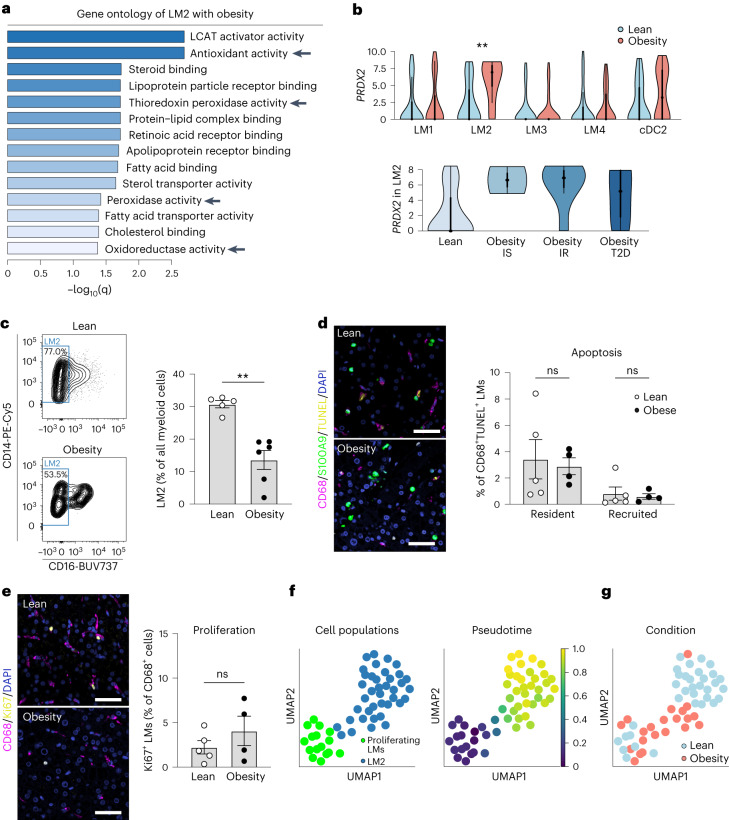
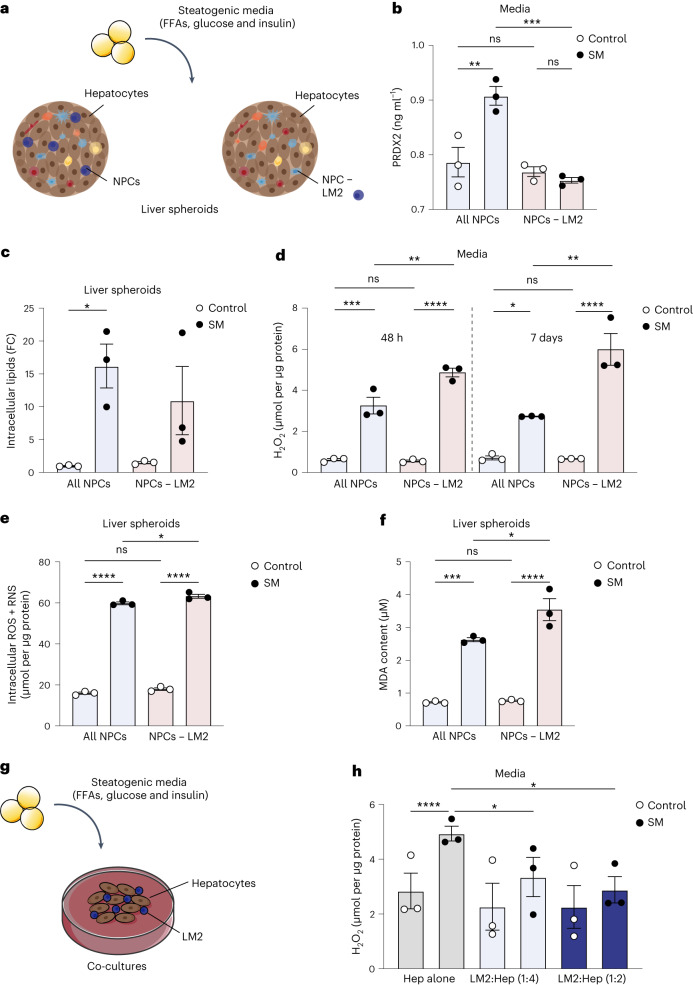
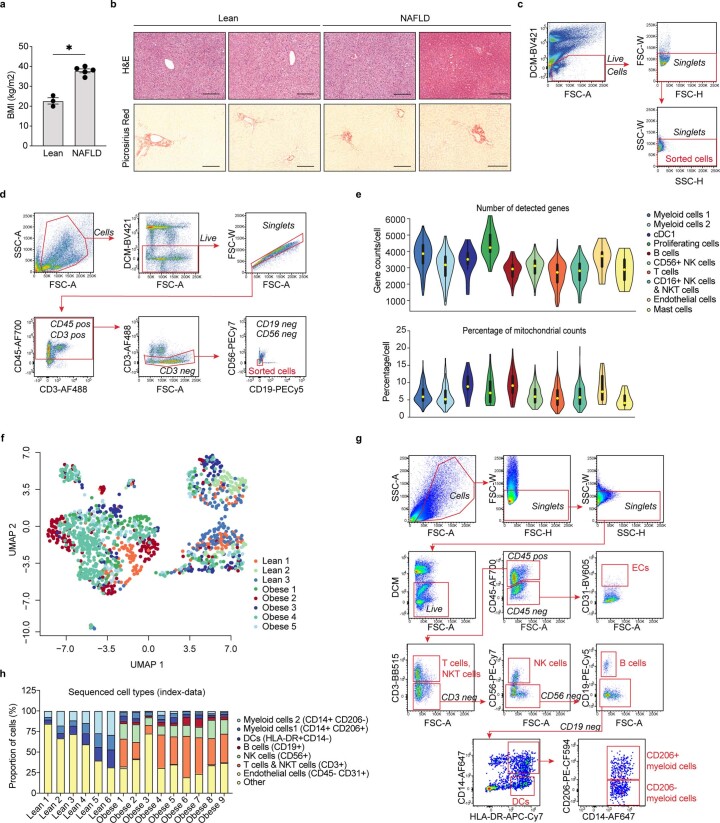
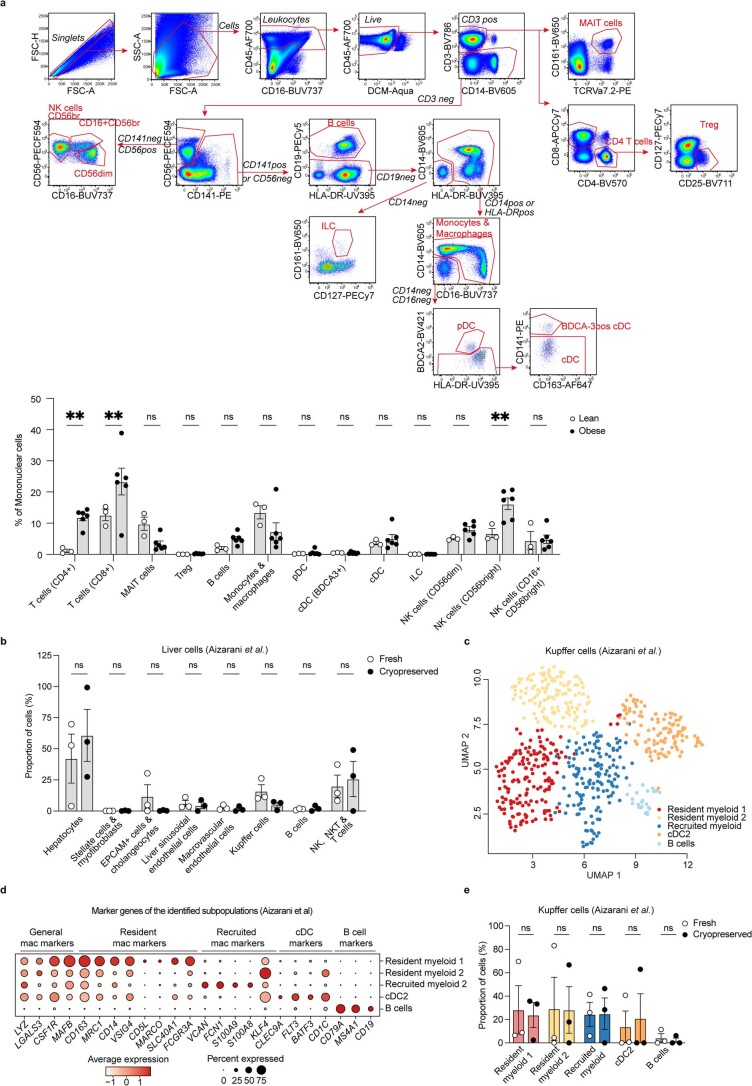
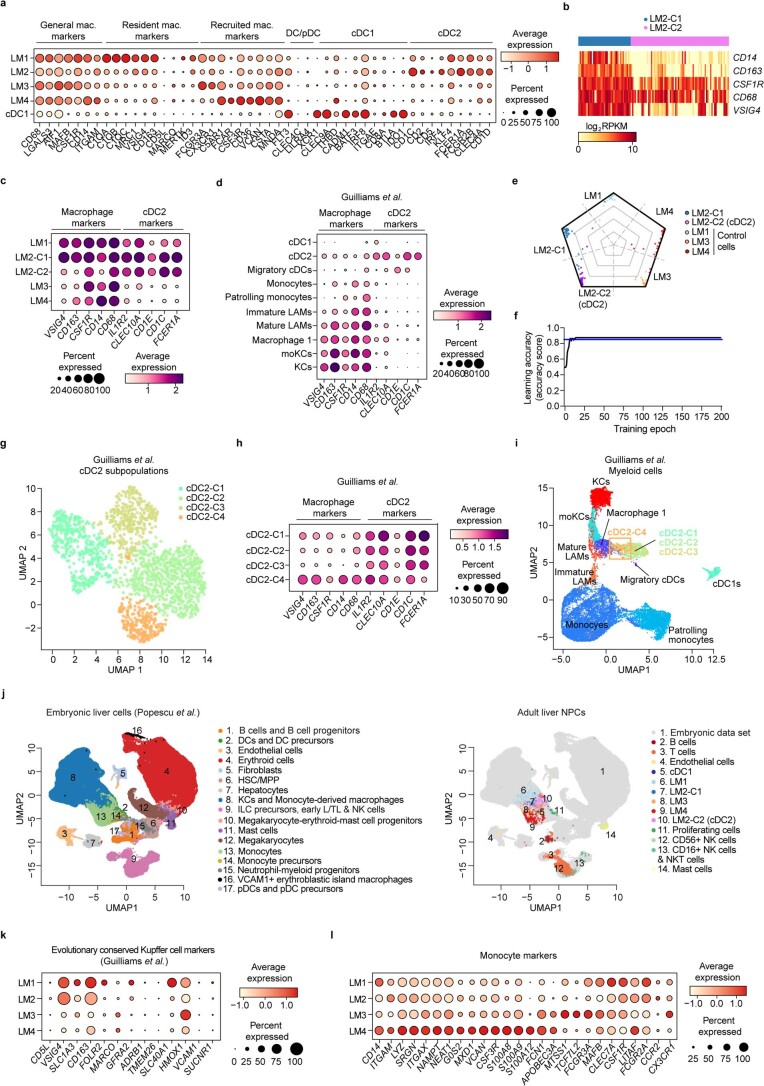
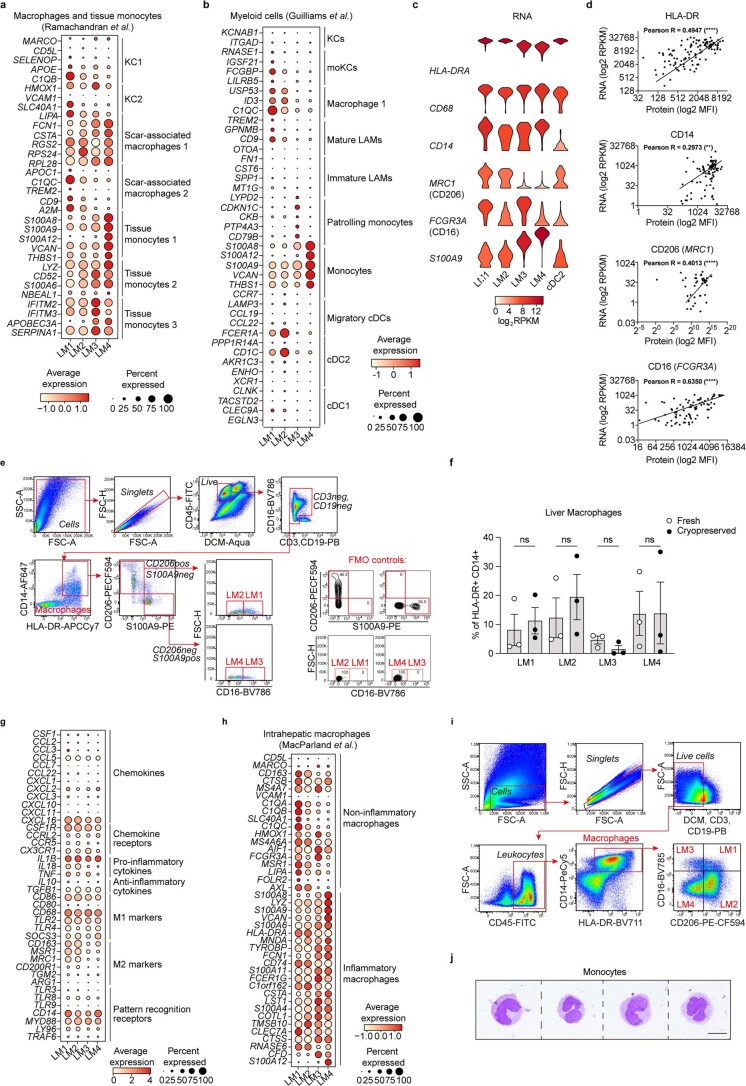
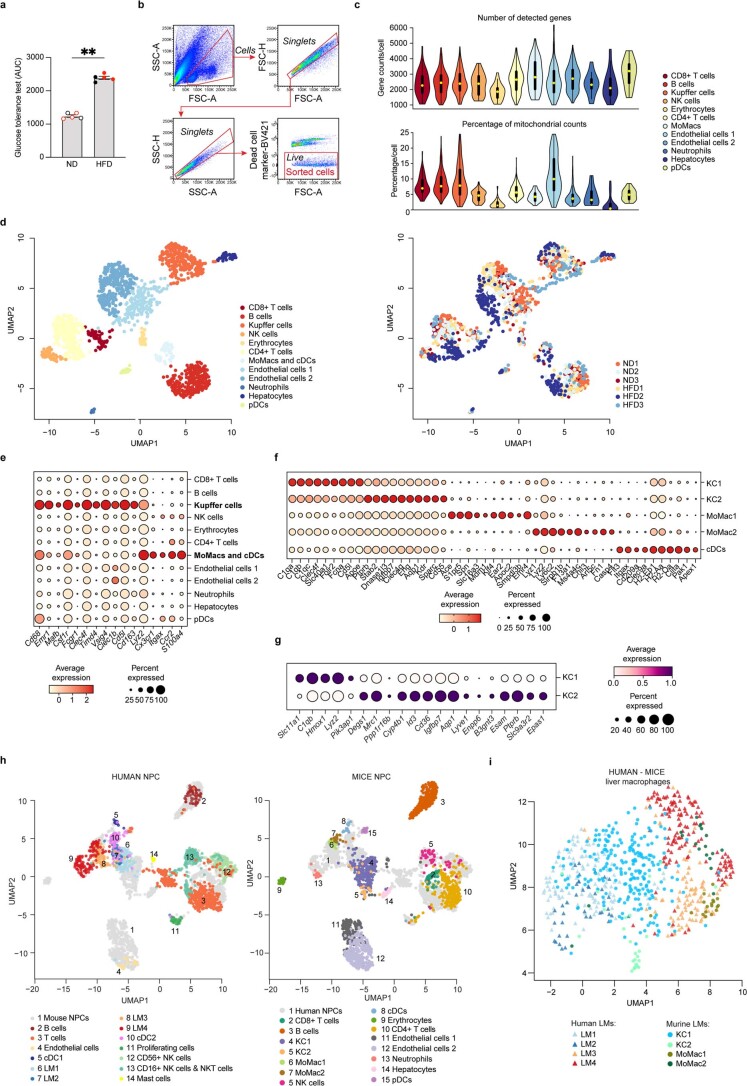
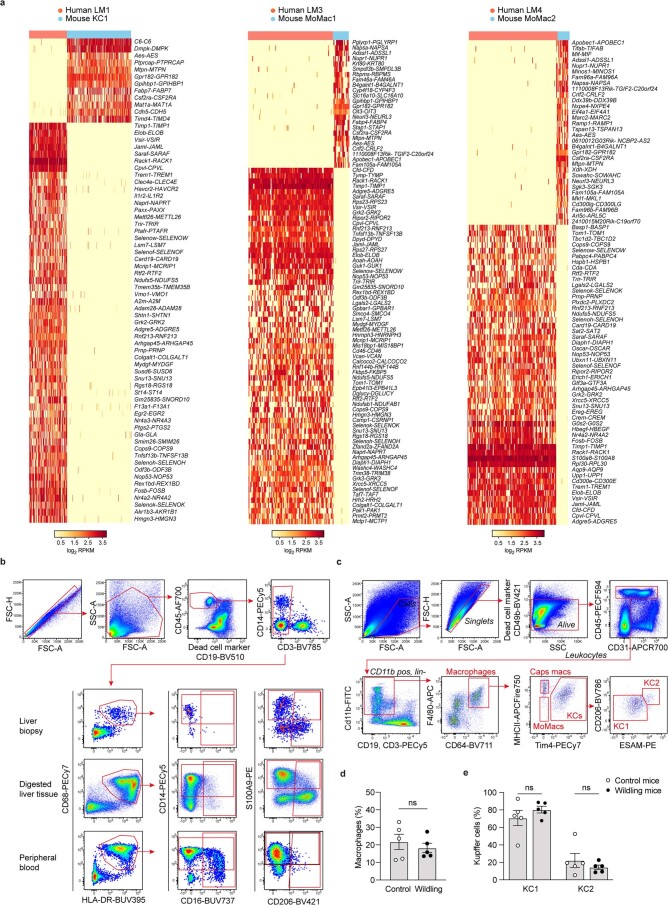
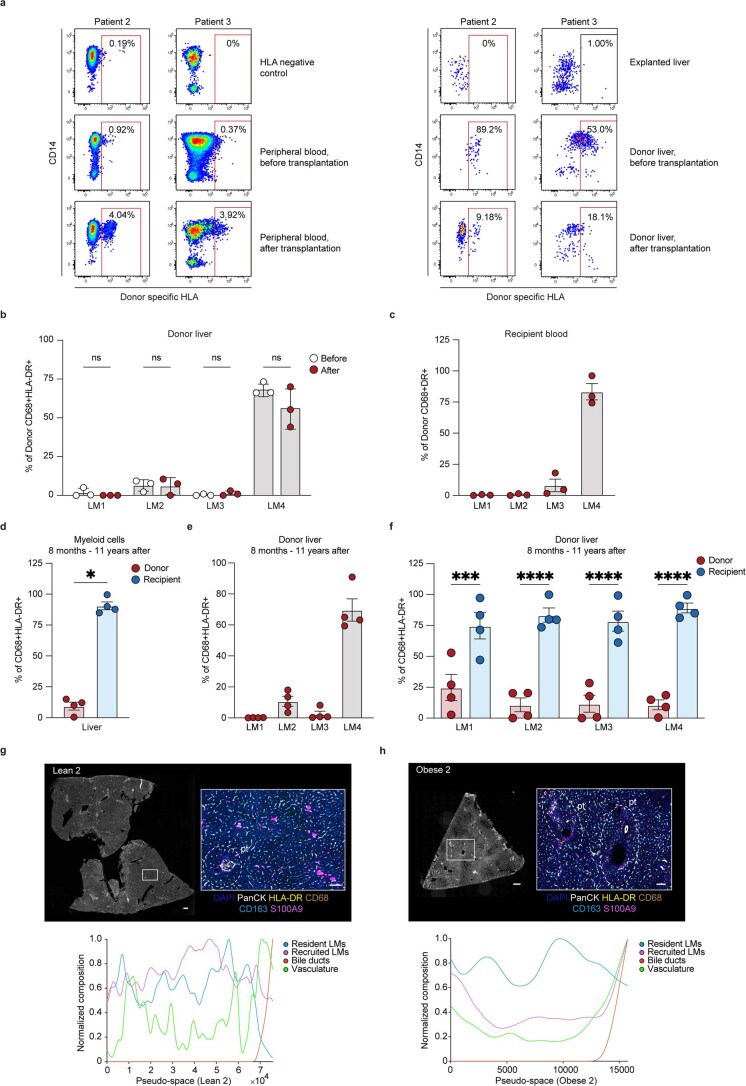
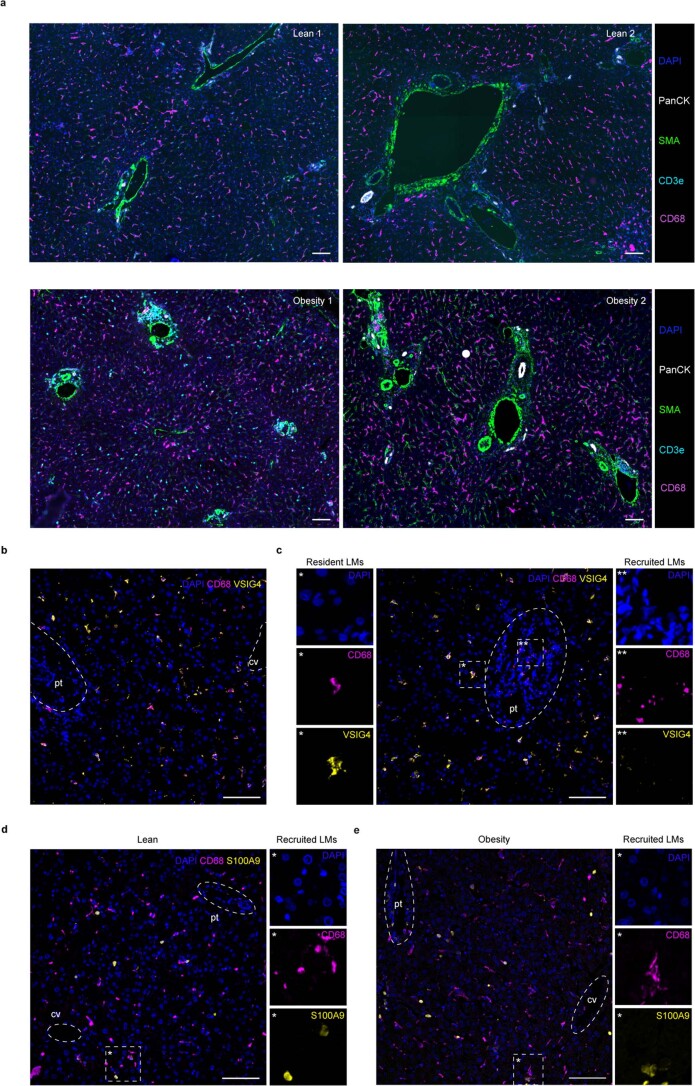
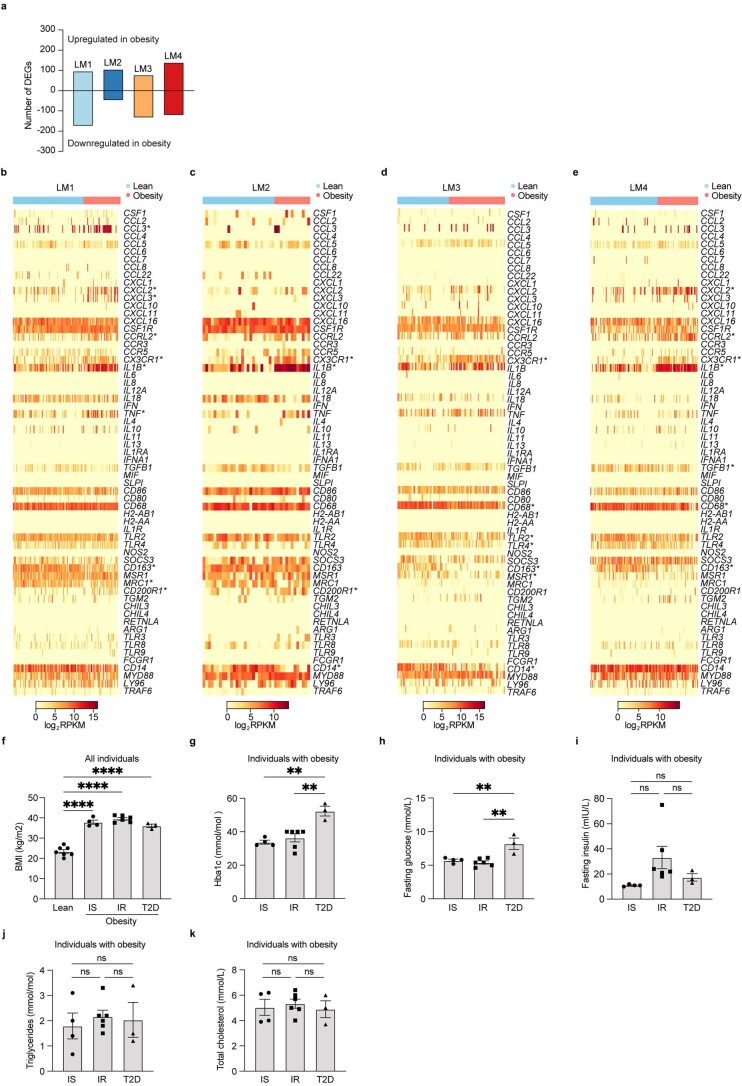
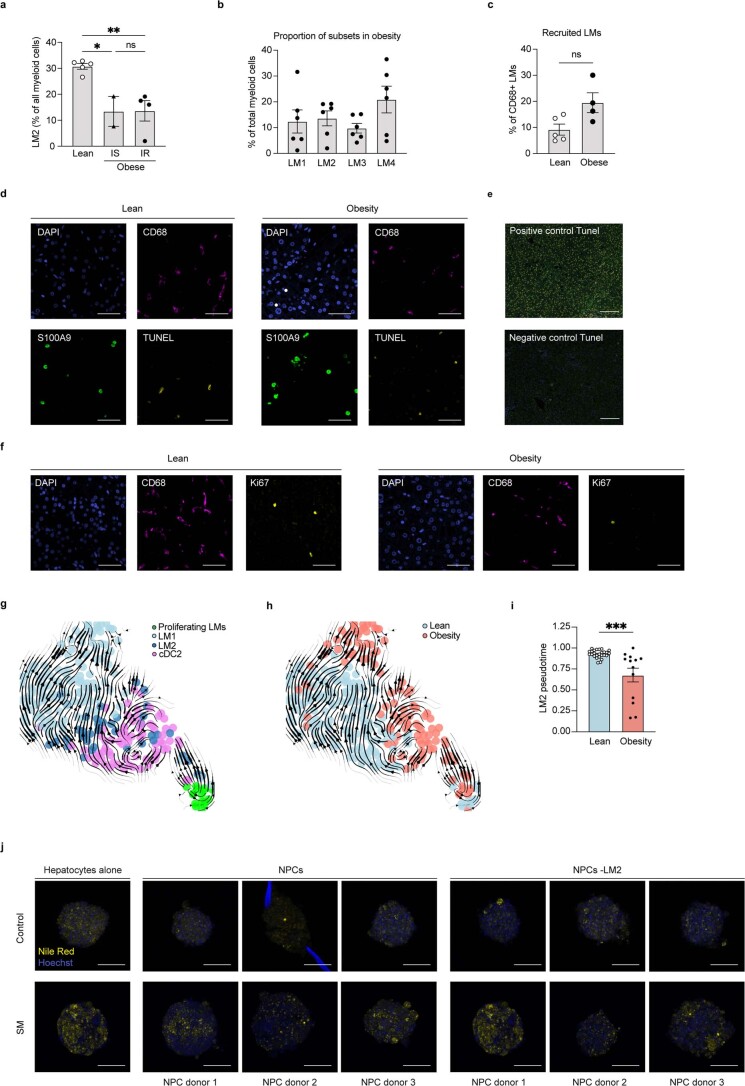
Although multiple populations of macrophages have been described in the human liver, their function and turnover in patients with obesity at high risk of developing non-alcoholic fatty liver disease (NAFLD) and cirrhosis are currently unknown. Herein, we identify a specific human population of resident liver myeloid cells that protects against the metabolic impairment associated with obesity. By studying the turnover of liver myeloid cells in individuals undergoing liver transplantation, we find that liver myeloid cell turnover differs between humans and mice. Using single-cell techniques and flow cytometry, we determine that the proportion of the protective resident liver myeloid cells, denoted liver myeloid cells 2 (LM2), decreases during obesity. Functional validation approaches using human 2D and 3D cultures reveal that the presence of LM2 ameliorates the oxidative stress associated with obese conditions. Our study indicates that resident myeloid cells could be a therapeutic target to decrease the oxidative stress associated with NAFLD.


Conflict of interest statement

V.M.L. is founder, CEO and shareholder of HepaPredict AB. In addition, V.M.L. discloses consultancy work for EnginZyme AB. The remaining authors declare no competing interests.

Figures

Fig. 1
Fig. 1. Identification of distinct LM cell populations in livers of lean humans and humans with obesity.
a, Experimental outline: human NPCs are isolated from livers of lean patients and patients with obesity. NPCs are then single-cell sorted using an antibody panel with 11 markers to record the expression of cell-surface proteins for individual cells, followed by single-cell transcriptomic profiling. b, Uniform manifold approximation and projection (UMAP) visualization of NPCs from lean (n = 3) individuals and individuals with obesity (n = 5); colors indicate cell cluster. Each symbol represents a single cell. c, Gene expression (log2(RPKM)) of markers for each cell type. RPKM, reads per kilobase of exon model per million mapped reads. d, UMAP visualization of LM cells from lean individuals (n = 3) and individuals with obesity (n = 5) colored by subpopulations (top) and colored by individual donors (bottom). e, Dot plot of marker genes significantly differentially expressed by each individual myeloid cell subpopulation. Color intensity indicates expression level, and dot size indicates gene expression frequency (percentage of cells expressing the gene). f, Representative images of cytospins stained with Wright-Giemsa of respective LM cell population, sorted from one lean individual. Scale bar, 10 µm. Illustrations in a were partly created using components adapted from Servier Medical Art, provided by Servier, licensed under a Creative Commons Attribution 3.0 unported license. Source data
Fig. 2
Fig. 2. Human–mouse conservation of the LM cell populations.
a, Experimental outline: livers from lean and obese mice on a high-fat diet for 9 weeks were either collected for histology and lipid quantifications or perfused to isolate murine NPCs. NPCs were single-cell sorted using an antibody panel with ten markers to record the expression of cell-surface proteins for individual cells and used for single-cell transcriptomic profiling. b, Body weight (n = 5 per group; P = 0.0079) and lipid (triglyceride, TG) content in murine livers (n = 5 per group; P = 0.0079). Red indicates mice used for scRNA-seq. ND, normal diet; HFD, high-fat diet. c, Representative images of lipid staining with Oil Red O of murine livers (n = 3 per group). Scale bar, 50 µm. d, UMAP visualization of liver myeloid cells from lean (n = 3) and obese mice (n = 3); colors indicate cell cluster. Each symbol represents a single cell. e, Dot plot of conserved genes between humans (top) and mice (bottom) specifically expressed by each macrophage cluster. Color intensity indicates expression level, and dot size indicates gene expression frequency (percentage of cells expressing the gene). f, Proportion of human LM subsets among all living CD45+CD68+HLA-DR+ myeloid cells in perfused (n = 4) and non-perfused livers (n = 3) (LM4 perfused versus non-perfused, P < 0.0001). ns, not significant. g, Experimental outline: (1) resected livers were perfused to flush out the intrahepatic blood; (2) livers were then digested and cells from the intrahepatic blood and the digested liver tissues were compared using flow cytometry. h, Proportion of LM subsets among all living CD45+CD68+HLA-DR+ myeloid cells in intrahepatic blood and digested liver tissue from the same donors (n = 4) (LM2 blood versus liver, P = 0.0084; LM4 blood versus liver, P < 0.0001). i, Proportion of murine LM cells in livers from wildling (n = 5) and control (n = 5) mice (KCs control versus wildling, P < 0.0001; Caps macs control versus wildling, P = 0.0003). Caps macs, capsular macrophages. Data are presented as mean ± s.e.m. P values were calculated by two-tailed Mann–Whitney U-test (b) or two-way ANOVA with adjustment for multiple comparisons (f, h, i). **P < 0.01; ***P < 0.001; ****P < 0.0001. Illustrations in a and g were partly created using components adapted from Servier Medical Art, provided by Servier, licensed under a Creative Commons Attribution 3.0 unported license. Source data
Fig. 3
Fig. 3. Human LM cells are mostly monocyte-derived.
a, Experimental outline: liver biopsies and peripheral blood samples were collected before and 6 h after liver transplantation (n = 3 per group). Liver cells and PBMCs were then isolated and used for flow cytometric analysis to assess the proportion of recipient-derived and donor-derived cells. D-HLA, donor HLA; R-HLA, recipient HLA. b, Proportion of donor-derived or recipient-derived macrophages among all living CD45+CD68+HLA-DR+ myeloid cells after transplantation (n = 3 per group; blood donor versus recipient, P = 0.0024). c, Representative analysis of proportion of donor-derived cells as assessed by flow cytometric staining for donor-specific HLA. d, Proportion of LM subsets among all living CD45+CD68+HLA-DR+ myeloid cells in livers before (recipient, n = 3) and after (donor, n = 3) transplantation (LM4 before versus after, P < 0.0001). LM1 was defined as CD14+CD16+CD206+S100A9, LM2 as CD14+CD16CD206+S100A9, LM3 as CD14+CD16+CD206−S100A9+ and LM4 as CD14+CD16CD206S100A9+. e, Representative images of lean human livers imaged using PhenoCycler, displaying the imaged tissue (left) and region of interest highlighting six markers (right; DAPI, PanCK, HLA-DR, CD68, CD163 and S100A9) that are colored according to the panel on the right. Regions containing portal tracts (pt) and central vein (cv) are highlighted in the image by dashed white lines. Images are representative of two individuals. Scale bar, 400 µm (left; entire tissue) and 100 µm (right; region of interest). f, Pseudospace plot visualizing the composition of resident and recruited myeloid cells sorted by tissue regions containing bile ducts (sorted to the right) in one lean donor. g, Representative images of livers of humans with obesity imaged using PhenoCycler. Images are representative of two individuals. Scale bar, 400 µm (left; entire tissue) and 100 µm (right; region of interest). h, Corresponding pseudospace plot. Data are presented as mean ± s.e.m. P values were calculated by two-way ANOVA with adjustment for multiple comparisons. **P < 0.01; ****P < 0.0001. Illustrations in a were partly created using components adapted from Servier Medical Art, provided by Servier, licensed under a Creative Commons Attribution 3.0 unported license. Source data
Fig. 4
Fig. 4. A distinct population of LM cells expresses increased levels of antioxidative genes.
a, Gene ontology analysis of enriched molecular functions in LM2 with obesity compared with lean. LCAT, lecithin–cholesterol acyltransferase. b, Gene expression distribution (log2(RPKM)) of PRDX2 in lean and obese LM subpopulations (top) or in LM2 stratified by obesity states (bottom). Dot indicates the median expression, thick line indicates the interquartile range, and thin line displays 1.5× interquartile range (LM2 lean versus obesity, P = 0.0025). IS, insulin sensitivity; IR, insulin resistance. c, Representative analysis of proportion of human LM2 cells among all myeloid cells (live CD45+CD14+HLA-DR+ cells; left) and proportion of LM2 in lean individuals (n = 5) and individuals with obesity (n = 6; right) (lean versus obese, P = 0.0043). d, Representative immunofluorescence images of CD68 (purple), S100A9 (green) and TUNEL (yellow) in human livers from lean individuals (n = 5) and individuals with obesity (n = 4) (left), and quantification of apoptotic CD68+S100A9 resident and CD68+S100A9+ recruited LM cells (right). Scale bar, 50 µm. e, Representative immunofluorescence images of CD68 (purple) and Ki67 (yellow) in human livers from lean individuals (n = 5) and individuals with obesity (n = 4) (left), and quantification of proliferating CD68+ LM cells (right). Scale bar, 50 µm. f, UMAP visualization of proliferating macrophages and LM2 cells colored by cell cluster (left) and by differentiation of proliferating myeloid cells to the LM2 cluster from pseudotime analysis (right). g, UMAP visualization of proliferating macrophages and LM2 cells colored by condition. Data are presented as mean ± s.e.m. P values were calculated by one-way (b) or two-way (d) ANOVA with adjustment for multiple comparisons or by two-tailed Mann–Whitney U-test (c, e). **P < 0.01. Source data
Fig. 5
Fig. 5. LM2 is protective by reducing oxidative stress associated with obesity.
a, Experimental outline: human liver spheroids of hepatocytes and NPCs or with hepatocytes and NPCs where LM2 have been depleted (NPCs − LM2) using FACS were treated with high levels of FFAs, glucose and insulin (steatogenic media, SM) for 1 week. b, Protein quantification of PRDX2 levels in the media of liver spheroids after 7 days of treatment with SM (SM all NPCs versus NPCs − LM2, P = 0.0008; all NPCs SM versus control, P = 0.0040). c, Quantification of intracellular lipids in liver spheroids upon treatment with SM for 7 days (all NPCs SM versus control, P = 0.0339). FC, fold change. d, ROS (H2O2) content in media after 48 h and 7 days of treatment with SM (all NPCs SM versus control, P = 0.0002 (48 h) and P = 0.0263 (7 days); NPCs − LM2 SM versus control, P < 0.0001 (48 h) and P < 0.0001 (7 days); SM all NPC versus NPCs − LM2, P = 0.0050 (48 h) and P = 0.0016 (7 days)). e, Intracellular ROS and RNS in liver spheroids after 7 days of treatment with SM (all NPCs SM versus control, P < 0.0001; NPCs − LM2 SM versus control, P < 0.0001; SM all NPC versus NPCs − LM2, P = 0.0415). f, Lipid peroxidation by-product (MDA) content in liver spheroids after 7 days of treatment with SM (all NPCs SM versus control, P = 0.0002; NPCs − LM2 SM versus control, P < 0.0001; SM all NPC versus NPCs − LM2, P = 0.0213). g, Experimental outline: human primary hepatocytes were co-cultured with LM2 cells at a 1:2 or 1:4 ratio (LM2:Hep) and treated with SM for 48 h. h, ROS (H2O2) content in media after treatment with SM (Hep alone SM versus control, P < 0.0001; SM Hep alone versus LM2:Hep (1:4), P = 0.0346; SM Hep alone versus LM2:Hep (1:2), P = 0.0243). n = pooled liver spheroids from 1 hepatocyte donor and 3 NPC donors (af) or from 3 hepatocyte donors and 1 NPC donor (g, h). Data are presented as mean ± s.e.m. P values were calculated by one-way (bf) or two-way (h) ANOVA with adjustment for multiple comparisons. *P < 0.05; **P < 0.01; ***P < 0.001; ****P < 0.0001. Illustrations in g were partly created using components adapted from Servier Medical Art, provided by Servier, licensed under a Creative Commons Attribution 3.0 unported license. Source data
Extended Data Fig. 1
Extended Data Fig. 1. Characterisation of human liver non-parenchymal cells.
a, Average BMI of sequenced individuals (n=3 lean and n=5 with obesity; P=0.0357). b, Representative images of H&E and picrosirius red staining of livers from lean individuals and individuals with obesity and NAFLD. Scale bar, 200µm. Images are representative of 5 individuals per condition (cohort 1). c, Gating scheme for sorting of NPCs from patients with obesity. Sorted cells were gated as live, single cells. d, Gating scheme for sorting of myeloid cells from lean individuals. Sorted cells were gated as live, single cells, CD45+CD3-CD19-CD56- cells. e, Violin plots of the number of detected genes (top) and the percentage of mitochondrial genes (bottom) across non-parenchymal cells from lean (n=3) and NAFLD (n=5) livers. Yellow dot indicates the median, bold line indicates the interquartile range and thin line displays the 1.5x interquartile range. f, UMAP visualization of single NPCs coloured by individual donors. g, Gating scheme for flow cytometric analysis of all sequenced NPCs (from the FACS-index data) gated using fluorescence minus one (FMO) controls and h, proportion of cell types from all sequenced plates from livers of lean individuals (n=6 plates) compared to individuals with obesity (n=9 plates). Data are presented as mean ± s.e.m. P values were calculated two-tailed Mann-Whitney test. *p < 0.05, **p < 0.01, ***p < 0.001, and ****p < 0.0001. ns, not significant. BMI, body mass index; NAFLD, Non-alcoholic fatty liver disease; H&E, haematoxylin and eosin; DCM, dead cell marker. Source data
Extended Data Fig. 2
Extended Data Fig. 2. Characterisation of human liver non-parenchymal cells.
a, Top: Gating scheme for flow cytometric analysis of human NPCs from lean individuals and individuals with obesity. Black regular text indicates markers used for each gating, black italic text indicates the selected population and red text the final subset. Several clean up steps have been implemented that are not displayed here, such as clean-up of staining artefacts, removal of cells expressing CD14/CD19/CD4 for final NK cell population, and removal of TCRVa7.2/CD4 for final ILC population. Bottom: Proportion of immune cell subsets among all live CD45+ cells after flow cytometry analysis. Results are from lean perfused liver samples (n=3) and obese non-perfused liver samples (n=6) (CD4 T cells lean vs obese P=0.0010, CD8 T cells lean vs obese P=0.0012 and CD56bright NK cells lean vs obese P=0.0067). b, Proportion of sequenced human liver cells from fresh (n=3) and cryopreserved (n=3) samples by scRNA-seq from the previously published data set (GSE124395) by Aizarani et al. c, UMAP visualization of the Kupffer cell cluster annotated by Aizarani et al.; colours indicate subpopulations from reanalysis. Each symbol represents a single cell. d, Dot plot of marker genes for each subpopulation. Colour intensity indicates expression level and dot size indicates gene expression frequency (percentage of cells expressing the gene) by Aizarani et al. e, Proportion of fresh and cryopreserved cells for each subpopulation in the Kupffer cell cluster (n=3 liver samples per group) from Aizarani et al. Data are presented as mean ± s.e.m. P values were calculated by two-way ANOVA with adjustment for multiple comparisons. **p < 0.01. ILC, innate lymphoid cells; Treg, regulatory T cells; Classic. mono, classical monocyte; Interm. mono, intermediate monocyte; nonclassic. mono, nonclassical monocyte; conv. mDC, conventional mDC; CD56br, CD16-CD56bright NK cells; CD16+CD56br, CD16+CD56bright NK cells; CD56dim, CD56dim NK cells. Mac, macrophages. Source data
Extended Data Fig. 3
Extended Data Fig. 3. Characterisation and annotation of human liver myeloid cells.
a, Dot plot of gene expression (log2 RPKM) of macrophage and dendritic cell markers. Colour intensity indicates expression level and dot size indicates gene expression frequency (percentage of cells expressing the gene). b, Heatmap of gene expression (log2 RPKM) of macrophage markers in the LM2 and cDC2 subclusters. c, Dot plot of gene expression of macrophage and cDC2 marker in our human myeloid cell data and d, in a published data set (GSE192742) of human myeloid cells by Guilliams et al. e, Radar plot visualization of the assigned cell-type score by the neural network classifier for each individual cell in the LM2/cDC2 subclusters and control cells; colours indicate cell cluster. f, Accuracy of the neural-network classifier in learning 261 single cells of LM2, cDC2 and the control cell types (LM1, LM3 and LM4) visualized as a learning curve. g, Subcluster analysis of cDC2 cells from the published data set of human myeloid cells by Guilliams et al. and h, dot plot of macrophage and cDC2 markers for each subcluster. i, UMAP visualisation of the cDC2 subclusters from g in relation to other myeloid populations. Orange rectangle indicates position of cluster cDC2-4. j, Integration of the human NPC data with a published data set (E-MTAB-7407) of human embryonic liver cells by Popescu et al. k, Dot plot of gene expression of previously published evolutionary conserved marker genes of Kupffer cells in mice and humans by Guilliams et al. l, Dot plot of gene expression (log2 RPKM) of monocyte markers. Data are presented as mean ± s.e.m. P values were calculated by two-way ANOVA with adjustment for multiple comparisons. RPKM, Reads per kilobase of exon model per million mapped reads; pDC, plasmacytoid dendritic cells; cDC1, type 1 dendritic cells; cDC2, type 2 dendritic cells; KC, Kupffer cells; moKCs, monocyte-derived KCs; LAMs, lipid-associated macrophages; HSC/MPP, hematopoietic stem cells and multipotent progenitors; early L/TL, early lymphoid/T lymphocyte.
Extended Data Fig. 4
Extended Data Fig. 4. Characterisation and annotation of human liver myeloid cells.
a, Dot plot of gene expression (log2 RPKM) of previously published liver macrophage markers (top DEG for each cluster) by Ramachandran et al. Colour intensity indicates expression level and dot size indicates gene expression frequency (percentage of cells expressing the gene). b, Dot plot of previously published myeloid cell markers (top DEG for each cluster) by Guilliams et al. c, Violin plot of gene expression distribution (log2 RPKM; colours indicate mean expression) of signature markers used to define each LM cell population by flow cytometry analysis or sorting. Myeloid cells were defined as HLA-DR+CD68+ and LM1 was defined as CD14+CD206+CD16+S100A9low, LM2 was defined as CD14+CD206+CD16-S100A9low, LM3 was defined as CD14+CD206-CD16+S100A9high, LM4 was defined as CD14+CD206-CD16-S100A9high and cDC2 was defined as CD14-CD206+CD16-S100A9low. d, Correlation between RNA (log2 RPKM) and protein expression (log2 MFI; from indexed data) of selected signature markers on single LMs (HLA-DR P<0.0001, CD4 P=0.0011, CD206 P<0.0001, CD16 P<0.0001). Data are from 5 individuals with obesity. e, Gating scheme for flow cytometry analysis of human NPCs (representative gating plots are from a lean individual) gated using FMO controls and f, proportion of human LM subset in lean individuals and individuals with obesity before (fresh, n=3) and after cryopreservation (n=3). g, Dot plot of gene expression (log2 RPKM) of chemokines, chemokine-receptors, cytokines, M1 and M2 markers, and pattern recognition receptors in LM subsets. h, Dot plot of gene expression (log2 RPKM) of previously published liver macrophage marker genes by MacParland et al. i, Gating scheme for sorting of each individual LM subset (LM1-LM4) from human NPCs by FACS, gated using FMO controls. Representative gating plots are from a lean individual. j, Representative images of cytospins stained with Wright-Giemsa of isolated monocytes from peripheral blood mononuclear cells from one individual. Scale bar, 10µm. Data are presented as mean ± s.e.m. P values were calculated by two-way ANOVA with adjustment for multiple comparisons (f) or by two-tailed Pearson correlation (confidence interval: 95%). *p < 0.05. RPKM, Reads per kilobase of exon model per million mapped reads; MFI; mean fluorescence intensity; ns, not significant; KC, Kupffer cells; moKCs, monocyte-derived KCs; LAMs, lipid-associated macrophages. Source data
Extended Data Fig. 5
Extended Data Fig. 5. Characterisation and annotation of murine liver macrophages.
a, Glucose tolerance in murine livers (n=5 per condition; P=0.0079), red colour indicates mice used for scRNA-seq. b, Gating scheme for sorting of NPCs from lean mice (n=3) and mice with obesity (n=3) for scRNA-seq. Sorted cells were gated as live, single cells. c, Violin plots of the number of detected genes (left) and the percentage of mitochondrial genes (right) across non-parenchymal cells from lean (n=3) and NAFLD (n=3) murine livers. Yellow dot indicates the median, bold line indicates the interquartile range and thin line displays the 1.5x interquartile range. d, UMAP visualization of NPCs from lean mice (n=3) and mice with obesity (n=3); colours indicate cell cluster (left) and individual mouse donors (right). Each symbol represents a single cell. e, Dot plot of gene expression of previously published markers of Kupffer cells and monocyte-derived macrophages. Colour intensity indicates expression level and dot size indicates gene expression frequency (percentage of cells expressing the gene). f, Dot plot of differentially expressed genes for each myeloid cell subpopulation. g, Dot plot of differentially expressed genes for the Kupffer cell 1 (KC1) and Kupffer cell 2 (KC2) subpopulations. h, Single cell integration of human and mouse scRNA-seq data of NPCs and i, LM cells. Data are presented as mean ± s.e.m. P values were calculated by two-tailed Mann-Whitney test. **p < 0.01. AUC, area under the curve; ND, normal diet; HFD, high fat diet; MoMacs, monocyte-derived macrophages.
Extended Data Fig. 6
Extended Data Fig. 6. Human-mouse conservation of the LM cell populations.
a, Heatmaps of genes specifically expressed (log2 RPKM) by humans or by mice for each matched LM cell subpopulation present in both mice and humans. b, Gating scheme for flow cytometry analysis of human livers and intrahepatic blood, where cells were gated amongst all live CD45+CD68+HLA-DR+ myeloid cells. LM1 was defined as CD14+CD16+CD206+S100A9-, LM2 as CD14+CD16-CD206+S100A9-, LM3 as CD14+CD16+CD206-S100A9+, and LM4 as CD14+CD16-CD206-S100A9+. c, Gating scheme for flow cytometry analysis of macrophage subpopulations in murine livers of wildling and specific pathogen-free (SPF) control mice, gated using FMO controls. d, Proportion of murine liver macrophages in wildling (n=5) and SPF control (n=5) livers. Liver macrophages are gated as live CD45+ lineage-(CD49b, CD3, CD19) CD11b+ F4/80+ CD64+. e, Proportion of murine KC subsets in wildling (n=5) and SPF control (n=5) livers. KC1 is gated as live CD45+ lineage-(CD49b, CD3, CD19) CD11b+ F4/80+ CD64+ Tim4+ CD206- ESAM- and KC2 is gated as CD45+ lineage-(CD49b, CD3, CD19) CD11b+ F4/80+ CD64+ Tim4+ CD206+ ESAM+. Data are presented as mean ± s.e.m. P values were calculated by two-tailed Mann-Whitney test (d) or two-way ANOVA with adjustment for multiple comparisons (e). *p < 0.05. RPKM, Reads per kilobase of exon model per million mapped reads; LM, liver myeloid cells; KC, Kupffer cell; MoMacs, monocyte-derived macrophages; Caps macs, capsular macrophages. Source data
Extended Data Fig. 7
Extended Data Fig. 7. Characterisation of human liver myeloid cell turnover and tissue localisation.
a, Proportion of donor-derived cells in the two other patients after undergoing transplantation, as assessed by flow cytometric staining for donor-specific HLA. b, Proportion of donor-derived LM subsets in the liver (donor, n=3) before and after (donor, n=3) transplantation into the recipient. c, Proportion of donor-derived LM subsets in the blood (recipient, n=3) after transplantation. d, Proportion of donor- or recipient-derived myeloid cell subsets among all live CD45+CD68+HLA-DR+ myeloid cells 8 months or 11 years post-transplantation (n=4; P=0.0286). e, Proportion of human LM subsets among all live CD45+CD68+HLA-DR+ myeloid cells in individuals 8 months or 11 years post-transplantation (n=4). LM1 was defined as CD14+CD16+CD206+, LM2 as CD14+CD16-CD206+, LM3 as CD14+CD16+CD206-, and LM4 as CD14+CD16-CD206-. f, Proportion of donor- or recipient-derived cells for each LM subset in individuals 8 months or 11 years post-transplantation (n=4; LM1 donor vs recipient P=0.0003 and LM2-LM4 donor vs recipient P<0.0001). g-h, Top: Images of lean human liver (Lean 2) or obese human liver (Obese 2) imaged with Phenocycler, displaying the imaged tissue (left) and region of interest highlighting six markers that are coloured according to the panel below. Regions containing portal tracts (pt) and central vein (cv) are highlighted in the image by dashed white lines. Scale bar, 400µm (left; entire tissue) and 100µm (right; region of interest). Bottom: Pseudo-space plot visualising the composition of resident and recruited macrophages sorted by tissue regions containing bile ducts (sorted to the right). Data are presented as mean ± s.e.m. P values were calculated by two-way ANOVA with adjustment for multiple comparisons (b, f) or by two-tailed Mann-Whitney test (d). *p < 0.05, ***p < 0.001, and ****p < 0.0001. Source data
Extended Data Fig. 8
Extended Data Fig. 8. Characterisation of human liver myeloid cell localisation.
a, Representative immunofluorescence images of human livers from lean (n=2) and individuals with obesity (n=2) imaged with Phenocycler, displaying region of interest highlighting five markers (DAPI, PanCK, SMA, CD3e, CD68) that are coloured according to the panel to the right. Scale bar, 100µm. b-c, Representative immunofluorescence image of tissue localization of resident (CD68+VSIG4+) and recruited (CD68+VSIG4-) myeloid cells in human livers. Regions containing portal tracts (pt) and central vein (cv) are highlighted in the image by dashed white lines. Images are representative of 4 individuals. Scale bar, 100µm. d-e, Representative immunofluorescence image of tissue localization of recruited (CD68+S100A9+) myeloid cells in livers from lean and individuals with obesity. Regions containing portal tracts (pt) and central vein (cv) are highlighted in the image by dashed white circles. Scale bar, 100µm. Images are representative of 5 lean individuals and 4 individuals with obesity. LMs, liver myeloid cells; cv, central vein; pt, portal tract.
Extended Data Fig. 9
Extended Data Fig. 9. Characterisation of liver myeloid cells in obesity.
a, Number of significantly regulated genes with obesity in each LM cell subpopulation (Supplementary Table 9). b-e, Heatmap of gene expression (log2 RPKM) of chemokines, chemokine-receptors, cytokines, M1 and M2 markers, and pattern recognition receptors in LM cell populations with obesity. Symbol indicates significantly regulated genes (adjusted P < 0.01). f, Body mass index (BMI) of lean individuals (n=7) and individuals with obesity (n=13) (lean vs IS P<0.0001, lean vs IR P<0.0001 and lean vs T2D P<0.0001). g, Haemoglobin A1c (HbA1c) levels in patients with obesity (n=13; IS vs T2D P= 0.0014 and IR vs T2D P=0.0024). h, Fasting glucose (IS vs T2D P=0.0057 and IR vs T2D P=0.0015) and i, insulin levels in patients with obesity (n=13). j, Triglyceride levels in the circulation of patients with obesity (n=13). k, Total cholesterol levels in patients with obesity (n=13). Data are presented as mean ± s.e.m. P values were calculated by one-way ANOVA with adjustment for multiple comparisons (f-k). **p < 0.01 and ****p < 0.0001. DEGs, differentially expressed genes; Reads per kilobase of exon model per million mapped reads, Reads Per Kilobases Million; IS, insulin sensitivity; IR, insulin resistance; T2D, type 2 diabetes; BMI, body mass index; ns, not significant. Source data
Extended Data Fig. 10
Extended Data Fig. 10. Characterisation of LM2 in obesity-induced metabolic disease.
a, Proportion of LM2 cells among all myeloid cells (live CD45+CD14+HLA-DR+ cells) in livers from lean individuals (n=5), individuals with obesity and IS (n=2) and individuals with obesity and IR (n=4) (lean vs obesity and IS P=0.0193 and lean vs obesity and IR P=0.0063). b, Proportion of LM cell populations among all myeloid cells (live CD45+CD14+HLA-DR+ cells) in livers from individuals with obesity (n=6). c, Quantification of CD68+S100A9+ recruited LM cells from immunofluorescent staining’s of livers from lean individuals (n=5) and individuals with obesity (n=4). d, Individual channels of the representative immunofluorescence image included in Fig. 4d. Scale bar, 50µm. Images are representative of 5 lean individuals and 4 individuals with obesity. e, Representative immunofluorescence images of positive and negative control for the Tunel assay. Images are representative of 5 lean individuals and 4 individuals with obesity for the negative control and one lean individual and 1 individual with obesity for the positive control. Scale bar, 50µm. f, Individual channels of the representative immunofluorescence image included in Fig. 4e. Scale bar, 50µm. Images are representative of 5 lean individuals and 4 individuals with obesity. g, RNA velocity plot displaying proliferating cells and the myeloid cell cluster 1 consisting of resident LM cells and cDC2s coloured by cell population or h, by lean and obese state. Each arrow indicates the direction and progression of transcriptional states. i, Pseudotime analysis comparing differentiation of lean (n=26) and obese (n=13) LM2 cells (P=0.0002). j, Representative immunofluorescence image of liver spheroids stained for lipids using Nile red. Scale bars, 100µm. Images are representative of multiple liver spheroids from 1 hepatocyte donor and 3 NPC donors. Data are presented as mean ± s.e.m. P values were calculated by one-way ANOVA with adjustment for multiple comparisons (a, I) or by two-tailed Mann-Whitney test (c, i). *p < 0.05, **p < 0.01, and ***p < 0.001. IS, insulin sensitivity; IR, insulin resistance; LMs, liver myeloid cells; NPC, non-parenchymal cells; ns, not significant; SM, steatogenic media; ns, not significant. Source data

Comment in

References

    1. Younossi ZM. Patient-reported outcomes for patients with chronic liver disease. Clin. Gastroenterol. Hepatol. 2018;16:793–799. - PubMed
    1. Povsic M, Wong OY, Perry R, Bottomley J. A structured literature review of the epidemiology and disease burden of non-alcoholic steatohepatitis (NASH) Adv. Ther. 2019;36:1574–1594. - PMC - PubMed
    1. Ramachandran P, et al. Resolving the fibrotic niche of human liver cirrhosis at single-cell level. Nature. 2019;575:512–518. - PMC - PubMed
    1. Guilliams M, et al. Spatial proteogenomics reveals distinct and evolutionarily conserved hepatic macrophage niches. Cell. 2022;185:379–396.e38. - PMC - PubMed
    1. MacParland SA, et al. Single cell RNA sequencing of human liver reveals distinct intrahepatic macrophage populations. Nat. Commun. 2018;9:4383. - PMC - PubMed

Publication types