. 2023 Jul;3(7):829-845.
doi: 10.1038/s43587-023-00442-w. Epub 2023 Jul 6.

Removal of senescent cells reduces the viral load and attenuates pulmonary and systemic inflammation in SARS-CoV-2-infected, aged hamsters

Affiliations

Removal of senescent cells reduces the viral load and attenuates pulmonary and systemic inflammation in SARS-CoV-2-infected, aged hamsters

Lou Delval et al. Nat Aging. 2023 Jul.

Abstract

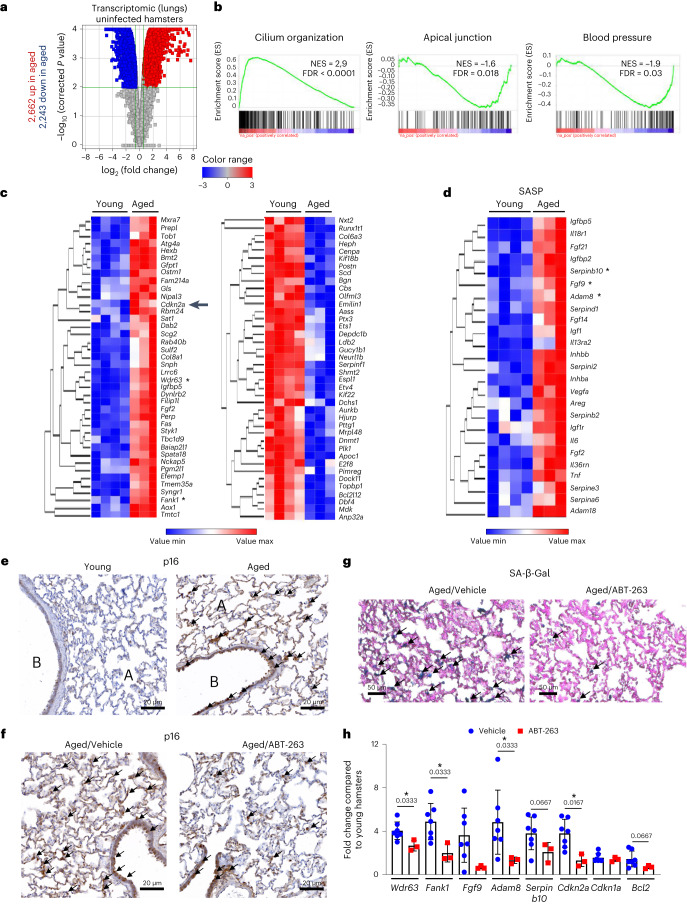
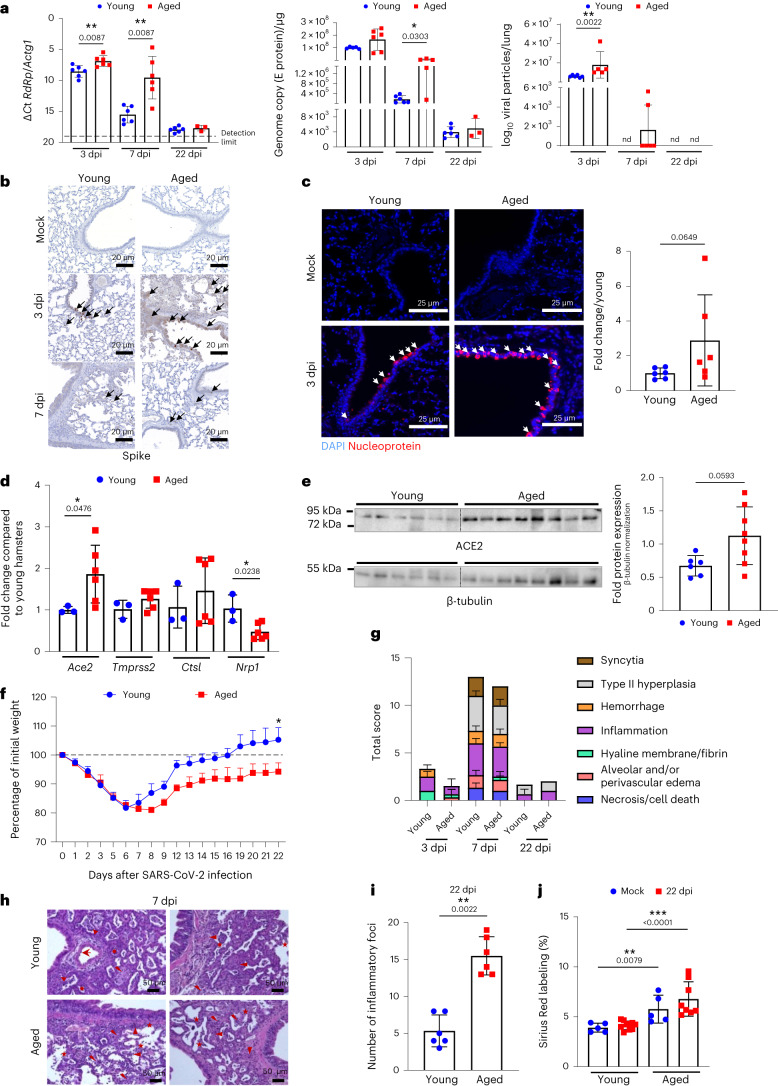
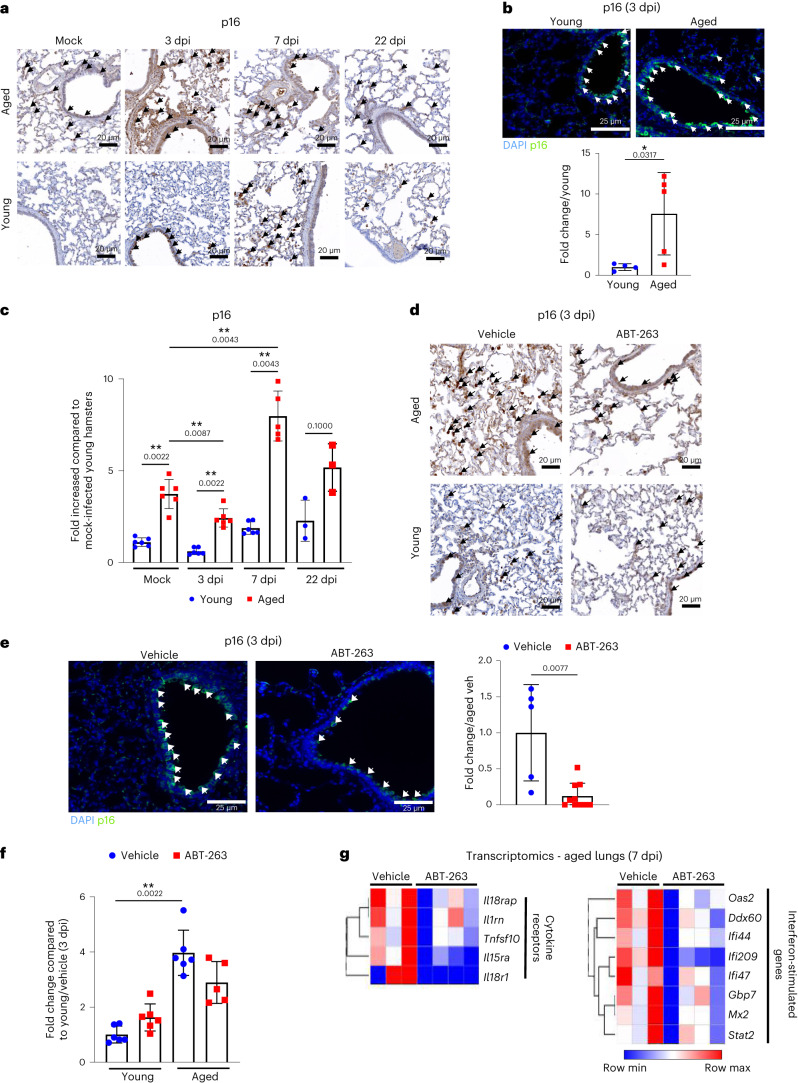
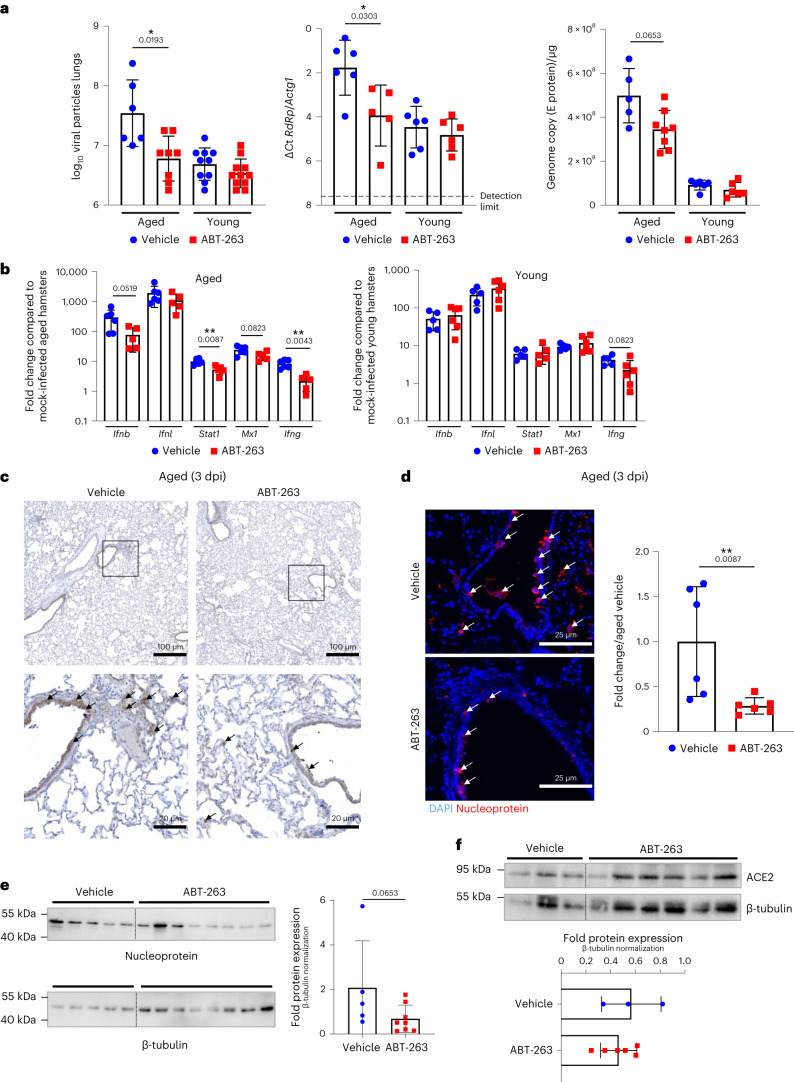
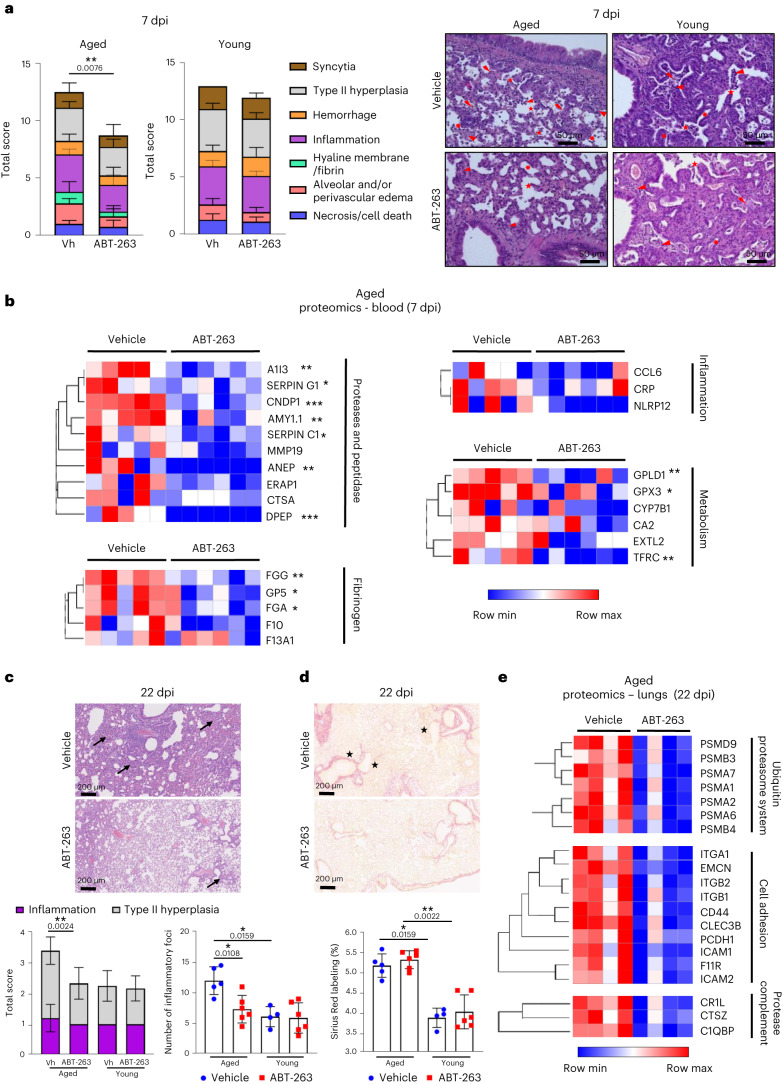
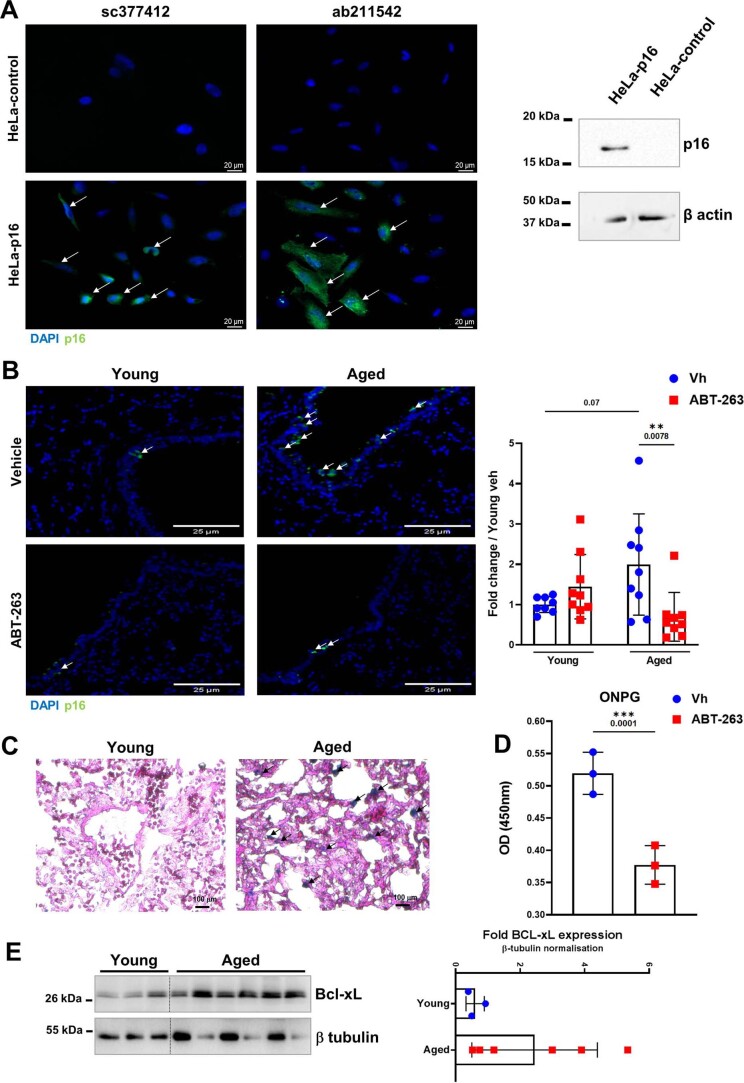
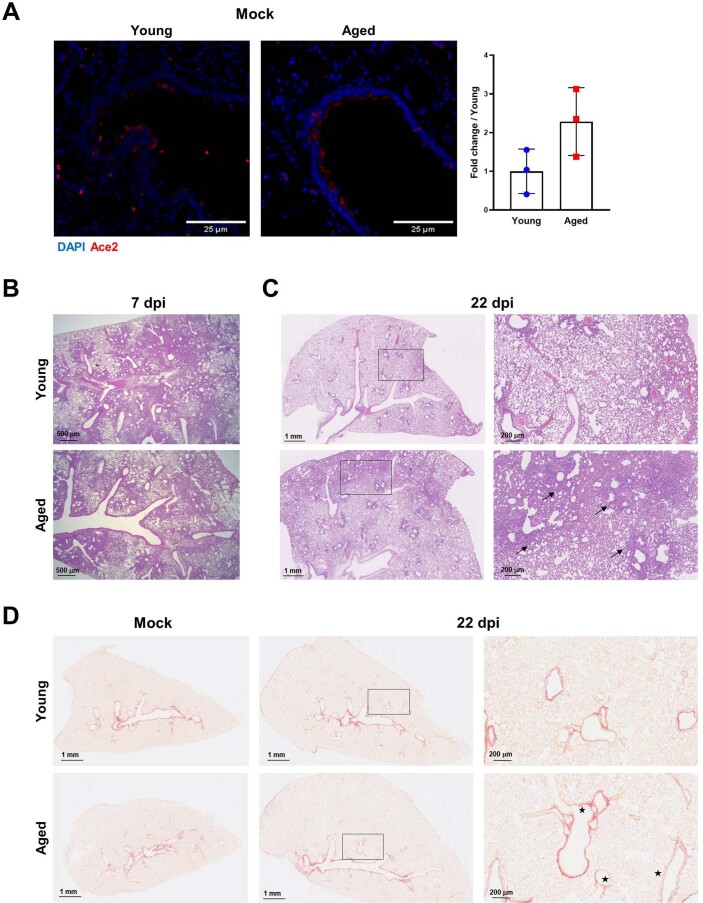
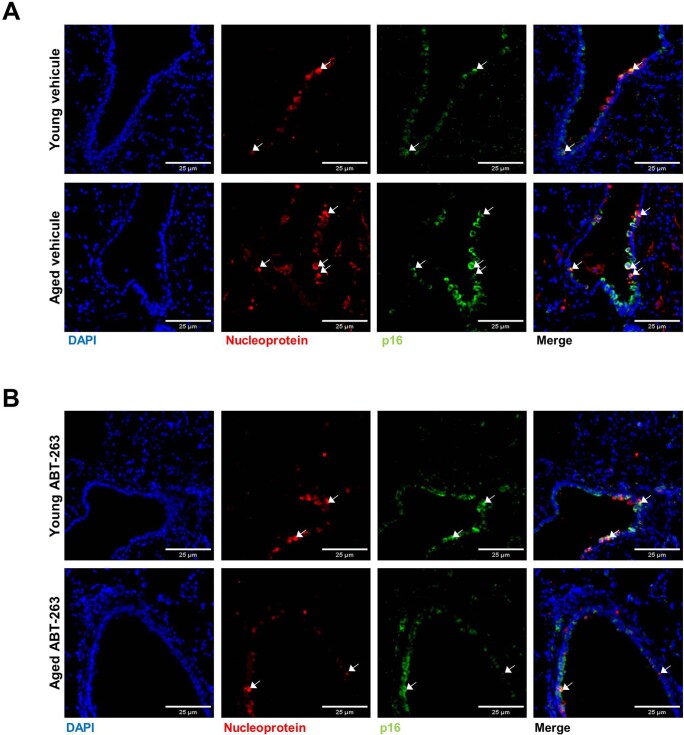
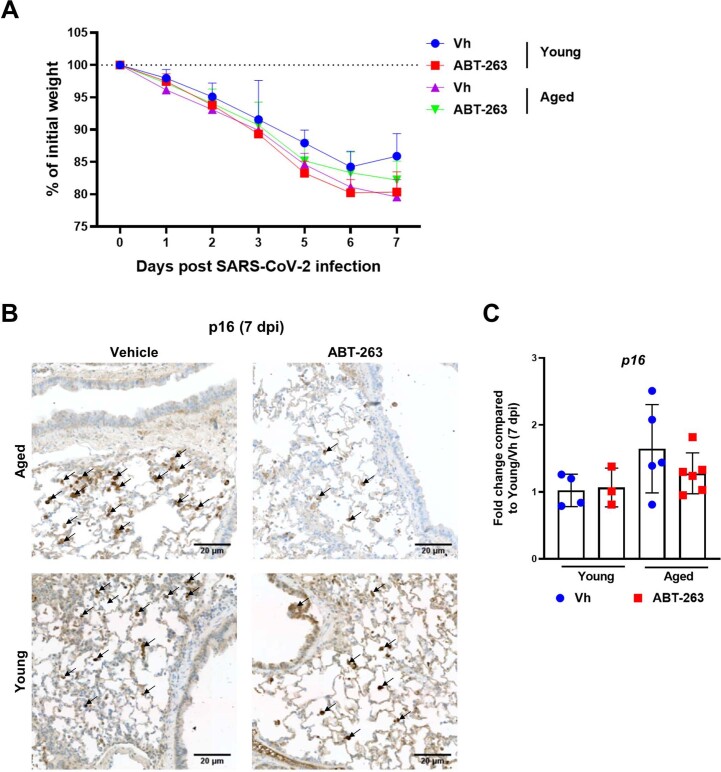
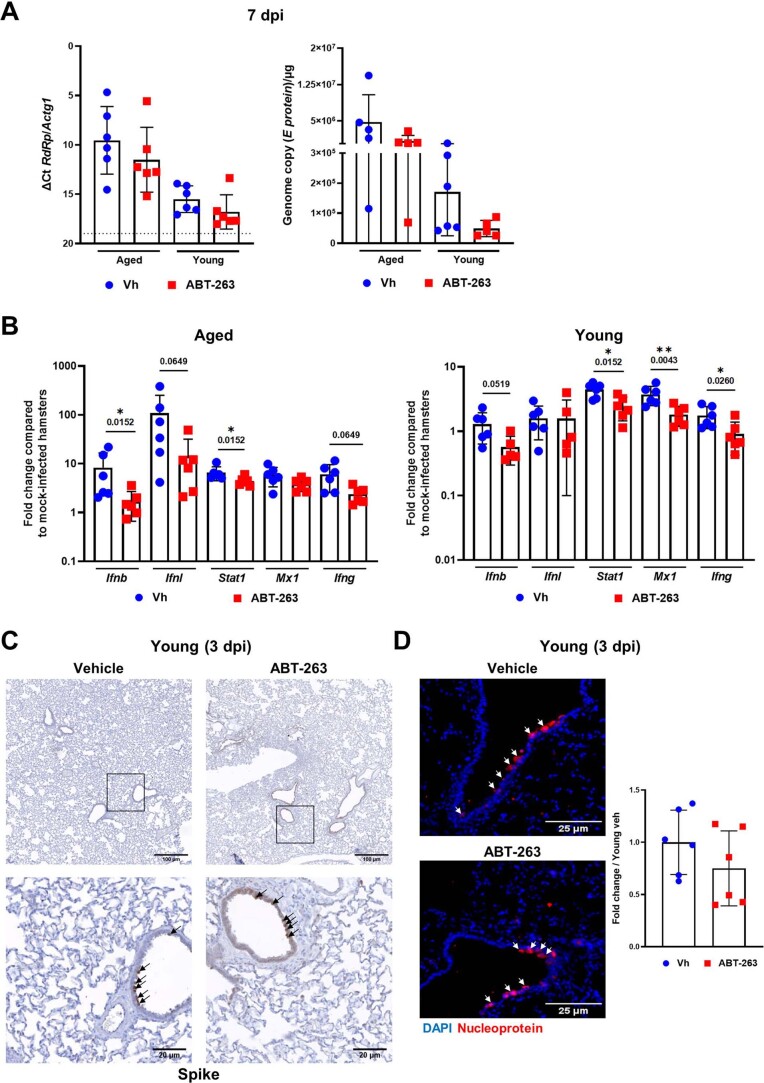
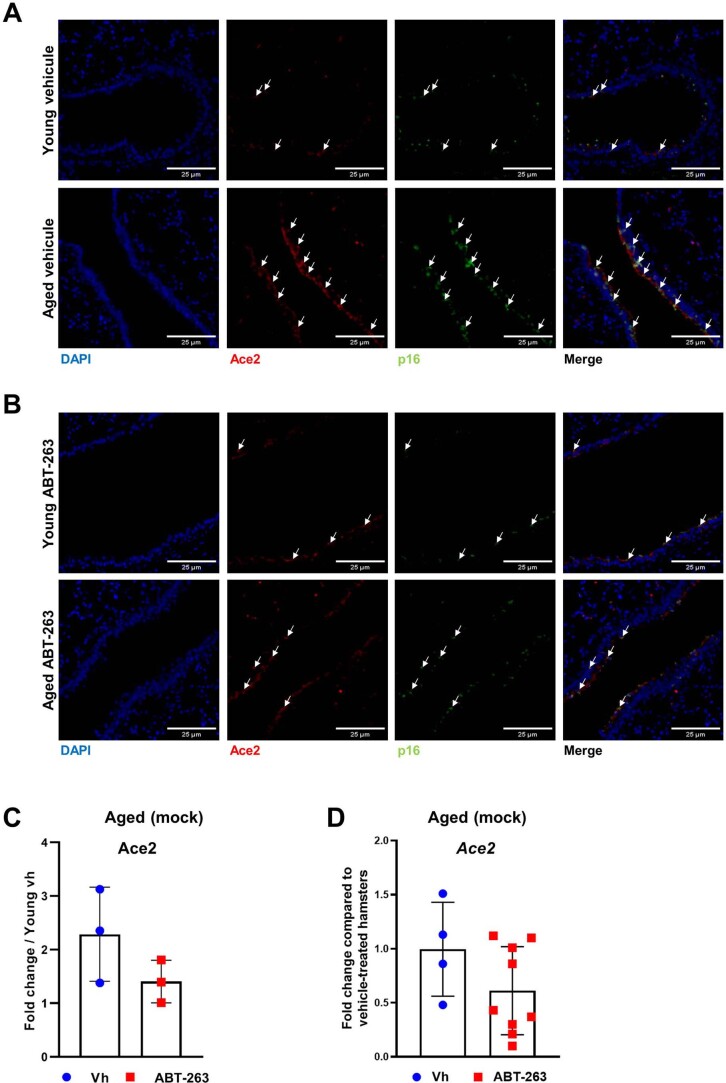
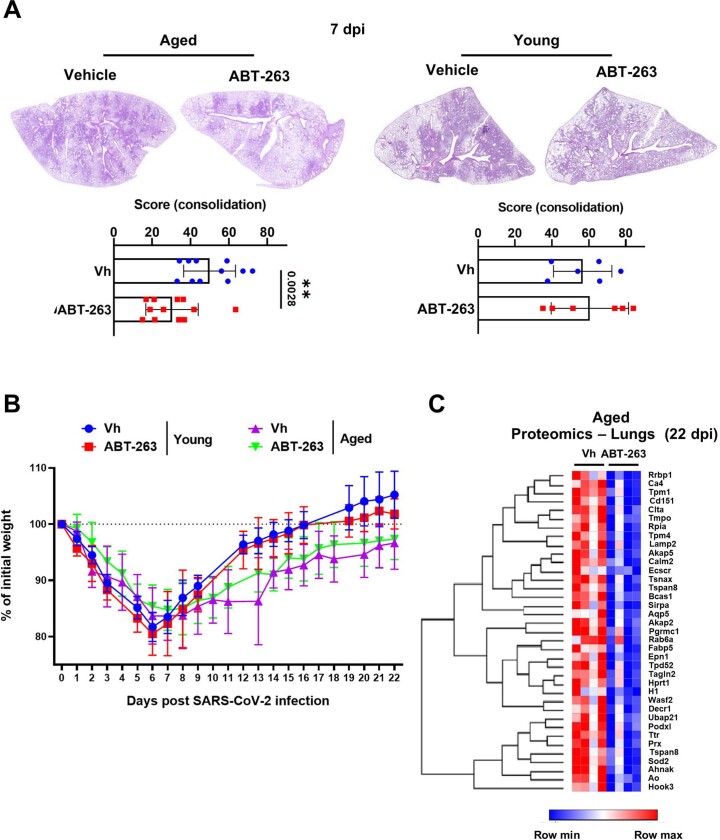
Older age is one of the strongest risk factors for severe COVID-19. In this study, we determined whether age-associated cellular senescence contributes to the severity of experimental COVID-19. Aged golden hamsters accumulate senescent cells in the lungs, and the senolytic drug ABT-263, a BCL-2 inhibitor, depletes these cells at baseline and during SARS-CoV-2 infection. Relative to young hamsters, aged hamsters had a greater viral load during the acute phase of infection and displayed higher levels of sequelae during the post-acute phase. Early treatment with ABT-263 lowered pulmonary viral load in aged (but not young) animals, an effect associated with lower expression of ACE2, the receptor for SARS-CoV-2. ABT-263 treatment also led to lower pulmonary and systemic levels of senescence-associated secretory phenotype factors and to amelioration of early and late lung disease. These data demonstrate the causative role of age-associated pre-existing senescent cells on COVID-19 severity and have clear clinical relevance.


Conflict of interest statement

The authors declare that the research was conducted in the absence of any commercial or financial relationships that could be construed as a potential conflict of interest.

Figures

Fig. 1
Fig. 1. The transcriptomic analysis of aged lungs and the effect of ABT-263 treatment on senescent cells in the lungs.
ad, Transcriptomic data were generated from whole lung tissue collected from naive aged hamsters (22 months of age) and naive young hamsters (2 months of age) (n = 3 and n = 4, respectively). Significant differentially expressed genes in aged lungs with fold change cutoffs >1.5 or <1.5 and moderated t-test P < 0.01 after Benjamani–Hochberg correction were considered. a, Volcano plot of transcriptomic data is depicted. The x axis represents the log2-transformed fold change for differentially expressed genes in aged versus young lungs, and the y axis represents the log10. b, GSEA plots showing the enrichment of upregulated genes (red) and repressed genes (blue) in aged hamsters relative to young hamsters at baseline. The y axis indicates the normalized enrichment score (NES). c,d, Heat maps showing significantly modulated genes related to ‘cellular senescence’ (c) and SASP-related factors (d) with the highest fold change in expression. The log2 expression range values are indicated by the color scale. Asterisks denote genes shown in h. e, Lungs from aged hamsters and young hamsters were stained with anti-p16. Arrows indicate p16-positive cells. A, lung alveoli; B, bronchi. f, The same procedure was repeated but this time in aged hamsters receiving (or not) ABT-263. Scale bars, 20 μm. g, SA-β-Gal staining of lung sections after ABT-263 treatment in aged hamsters. h, Relative expression levels of transcripts identified in b and c (marked with an asterisk) and transcripts moderately upregulated in aged lungs but relevant in senescence (Cdkn1a and Bcl2) as assessed by RT–PCR assays (lung) (n = 3–7). The data are expressed as the mean ± s.d. fold change relative to average gene expression in young animals. ad, One experiment performed. e,h, One representative experiment out of two is shown. h, Significant differences were determined using the two-tailed Mann–Whitney U-test. *P < 0.05.
Fig. 2
Fig. 2. Effects of SARS-CoV-2 infection on aged hamsters.
Young hamsters and aged hamsters were infected with SARS-CoV-2. Lungs were collected at 3 dpi, 7 dpi and 22 dpi (n = 3–6). Left and middle: quantification of viral RdRp and E protein transcript levels using RT–PCR assays. The data are expressed as ΔCt and genome copy per microgram of RNA. Right: number of infectious virus particles per lung (50% tissue culture infectious dose, TCID50). b, Immunohistochemistry analysis of spike. Scale bars, 20 μm. c, Leftl: immunofluorescence staining for DAPI (blue) and viral nucleoprotein (red) is shown. Scale bars, 25 μm. Right: the intensity of nucleoprotein signals was normalized by DAPI count. The histograms indicate the fold change relative to average intensity in young animals (n = 6). d, Gene expression was quantified by RT–PCR (fold change relative to average gene expression in young animals) (n = 3–6). e, Expression of AC2 and β-tubulin in young and aged whole lung homogenates as assessed by western blotting. Right: the relative protein levels normalized to β-tubulin are shown (n = 6–8). f, Body weight loss curves (four aged hamsters and six young hamsters). g, Histopathological examination of lung sections (H&E staining). The mean sum of the subscores is shown (n = 3–6). h, Representative photomicrographs at 7 dpi. Arrowhead: inflammatory cell infiltrate; star: alveolar wall rupture; sun: type II pneumocyte hyperplasia; thunderbolt: necrosis. Scale bars, 50 μm. i, Numbers of inflammatory foci per lung section (n = 6). j, Percentage of Sirius Red labeling (n = 5–10). ai, One of two representative experiments is shown. j, A pool of two independent experiments is depicted. For all graphs, errors indicate mean ± s.d. Significant differences were determined using the two-tailed Mann–Whitney U-test (a,c,d,e,g,i) and the one-way ANOVA Kruskal–Wallis test (non-parametric), followed by Dunn’s post test (j). Significance of body weight regain (area under the curve) in infected young hamsters was calculated using the Wilcoxon matched-pairs signed-rank test (f). *P < 0.05, **P < 0.01, ***P < 0.001. Source data
Fig. 3
Fig. 3. Effect of a SARS-CoV-2 infection on the frequency of pulmonary p16-positive cells and effects of ABT-263 treatment on p16 and SASP expression in lungs.
a, Lungs from mock-infected and SARS-CoV-2-infected, aged hamsters and young hamsters were stained with a p16 antibody. Representative photomicrographs showing labeling of p16 are shown at 3 dpi, 7 dpi and 22 dpi. Scale bars, 20 μm. b, p16 labeling was performed on lung sections collected at 3 dpi. Scale bars, 25 μm. Bottom: the histograms indicate the fold change relative to average intensity in young animals (n = 4–5). c, The mRNA expression level of Cdkn2a (encoding p16) was quantified by RT–PCR. The data are expressed as fold increase relative to average gene expression in mock-infected young hamsters (n = 3–6). d, Aged hamsters and young hamsters were treated (or not) with ABT-263 and then infected with SARS-CoV-2. Arrows indicate p16-positive cells (3 dpi). Scale bars, 20 μm. e, Effect of ABT-263 treatment on p16 expression as assessed by immunofluorescence (3 dpi). Scale bars, 25 μm. Right: the intensity of p16 signals was normalized by DAPI count. The histograms indicate the fold change relative to average intensity in vehicle-treated infected, aged animals (n = 5–10). f, The Cdkn2a transcript levels are indicated. The data are expressed as the fold increase relative to average gene expression in vehicle-treated infected young hamsters (n = 5–6). g, Effect of ABT-263 treatment on the expression of genes related to SASP factors in infected, aged hamsters (n = 3–4, 7 dpi). Heat map (hierarchical clustering) of the differences in expression of SASP factors, calculated using the difference between log intensity of ABT-263 and the control (fold change > 1.5, P < 0.01). af, One of two representative experiments is shown. g, One experiment performed. For all graphs, errors indicate mean ± s.d. Significant differences were determined using the two-tailed Mann–Whitney U-test (b,e), moderated t-test after Benjamani–Hochberg correction (g) and one-way ANOVA Kruskal–Wallis test (non-parametric), followed by Dunn’s post test (c,f). *P < 0.05, **P < 0.01.
Fig. 4
Fig. 4. Effect of ABT-263 treatment on viral loads and ACE2 expression in lungs.
Aged hamsters and young hamsters were treated (or not) with ABT-263 and then infected with SARS-CoV-2. Animals were euthanized at 3 dpi. a, Determination of viral loads in the lungs. Left: the number of infectious particles was determined in a TCID50 assay. The data are expressed as the number of infectious virus particles per lung (n = 6–11). Middle and right: quantification of viral RdRp and E protein transcript levels in the whole lungs, using RT–PCR. The data are expressed as ΔCt and genome copy per microgram of RNA (n = 5–8). b, mRNA copy numbers (for IFNs and ISGs) were quantified by RT–PCR. The data are expressed as the fold change relative to average gene expression in mock-infected animals (n = 5–6). c, Immunohistochemistry analysis of spike in the lung from SARS-CoV-2-infected, aged hamsters treated (or not) with ABT-263. Scale bars, 100 μm and 20 μm. d, Viral nucleoprotein labeling (immunofluorescence) was performed on lung sections. Scale bars, 25 μm. Right: the histograms indicate the fold change relative to average intensity in vehicle-treated infected, aged animals (n = 6). e,f, Expression of the viral nucleoprotein, ACE2 and β-tubulin (western blotting) in vehicle-treated and ABT-263-treated SARS-CoV-2-infected, aged hamsters (whole lung homogenates). The relative protein levels normalized to β-tubulin are shown (n = 3–8). For all graphs, errors indicate mean ± s.d. Pooled results from two independent experiments (a) and one of two representative experiments (be) are shown. Significant differences were determined using the two-tailed Mann–Whitney U-test (b,d,e,f) or one-way ANOVA Kruskal–Wallis test (non-parametric), followed by Dunn’s post test (a). *P < 0.05, **P < 0.01. Source data
Fig. 5
Fig. 5. Effect of ABT-263 treatment on pulmonary and systemic inflammation in aged hamsters.
Aged hamsters and young hamsters were treated (or not) with ABT-263 and then infected with SARS-CoV-2. Animals were euthanized at 7 dpi and 22 dpi. a, Left: histopathological examination of lung sections (H&E staining, 7 dpi). The sum of the subscores is shown (n = 11–12 aged and n = 6 young). Right: photomicrographs showing lower alveolar destruction in ABT-263-treated aged hamsters (but not ABT-263-treated young hamsters). Arrowhead: inflammatory cell infiltrate; star: alveolar wall rupture; sun: type II pneumocyte hyperplasia; thunderbolt: necrosis; arrow: activated blood vessel. Scale bars, 50 μm. b, Heat maps of the differential expressed prothrombotic and inflammatory factors in the serum of vehicle-treated and ABT-263-treated aged hamsters, in a mass spectrometry analysis of the proteome (fold change in protein level > 1.2, P < 0.05) (n = 5–6). c, Histopathological examination of lung sections (H&E staining, 22 dpi). Lower panels: The total histology score (left) and the numbers of inflammatory foci (inflammation and type II hyperplasia) per lung section (right) are shown (n = 4–6). d, Sirius Red labeling in the lungs of vehicle-treated and ABT-263-treated aged hamsters and young hamsters at 22 dpi. Top: representative images showing (stars) the destructured basal membranes in vehicle-treated aged animals. Bottom: the percentages of Sirius Red labeling are shown (n = 4–6). e, TMT-based proteomic analysis of lung extracts (vehicle-treated and ABT-263-treated aged hamsters). Heat maps of the differentially expressed components, in a mass spectrometry analysis of the proteome, are depicted (fold change in protein abundance > 2, P < 0.05) (n = 4). For all graphs, errors indicate mean ± s.d. Pooled results from two independent experiments (a, left) and one of two representative experiments (a, right, and be) are shown. Significant differences were determined using the two-tailed Mann–Whitney U-test (a,b,e) and one-way ANOVA Kruskal–Wallis test (non-parametric), followed by Dunn’s post test (c,d). *P < 0.05, **P < 0.01, ***P < 0.001.
Extended Data Fig. 1
Extended Data Fig. 1. Enhanced cellular senescence in aged lungs and effects of ABT-263 treatment.
A, Validation of the anti-p16 antibodies on transfected cells. HeLa cells were transfected with the control plasmid pcDNA3.1(+) or the plasmid pcDNA3.1(+) encoding hamster p16. Left panel, Cells were labeled with two different anti-p16 antibodies (immunofluorescence). Right panel, Expression of p16 and β actin in HeLa cells expressing or not hamster p16 as assessed by western blotting. B, Left panel, Effect of ABT-263 treatment on the number of p16-positive cells (white arrows) in young and aged lungs as assessed by immunofluorescence. Bars: 25 μm. Right panel, Quantification of p16-expressing cells. The histograms indicate the fold change relative to average intensity in vehicle-treated young animals (n = 8-9). C, SA-β-Gal staining of lung sections from young hamsters and aged hamsters. Increased blue staining (black arrows) indicates a higher number of senescent cells in aged lungs. D, ONPG-based β-Gal activity of lung extracts collected from aged hamsters treated with the vehicle or with ABT-263 (n = 3). E, Left panel, Expression of Bcl-xL and β tubulin in young and aged whole-lung homogenates as assessed by western blotting. Right panel, the relative protein levels normalized to β tubulin are shown (n = 3-6). For all graphs, errors indicate mean ± s.d. Pooled results from two experiments (B) and one of two representative experiments (A, C-E) are shown. Significant differences were determined using the two tailed Mann Whitney U test (D and E) and One-way ANOVA Kruskal-Wallis test (nonparametric), followed by the Dunn’s posttest test (B, right). ** P < 0.01, *** P < 0.001. Source data
Extended Data Fig. 2
Extended Data Fig. 2. Ace2 expression in aged lungs and consequences of a SARS-CoV-2 infection on lung pathology.
A, Immunofluorescence analysis of Ace2 in the lung from uninfected (mock) young hamsters and aged hamsters. Bars: 25 μm. Right panel, The histograms indicate the mean ± s.d fold change relative to average intensity in young animals (n = 3). Significant differences were determined using the two tailed Mann Whitney U test. B and C, Representative photomicrographs of lungs from SARS-CoV-2-infected young hamsters and aged hamsters (H&E staining) at 7 dpi (B), and 22 dpi (C). C, Arrow: inflammatory cell infiltrate; sun: type II pneumocyte hyperplasia. D, The lungs were stained with Sirius Red. Representative images are depicted (22 dpi). Stars indicate altered structure of epithelial and vascular basal membranes. B-D, Scales are indicated. One of two representative experiments is shown.
Extended Data Fig. 3
Extended Data Fig. 3. Virus antigen and p16 expression in vehicle-treated and ABT-263-treated young and aged lungs at 3 dpi.
Immunofluorescence staining for DAPI (blue), viral nucleoprotein (red) and p16 (green) is shown. Labelling was performed on lung sections collected from vehicle-treated (A) and from ABT-263-treated (B) infected animals. Scales are indicated. One of two representative experiments is shown.
Extended Data Fig. 4
Extended Data Fig. 4. Effect of ABT-263 treatment on body weight loss and p16 expression at 7 dpi.
Aged hamsters and young hamsters were treated (or not) with ABT-263 and then infected with SARS-CoV-2. A, Body weight loss of vehicle-treated and ABT-263-treated aged hamsters and young hamsters following a SARS-CoV-2 infection (n = 6). B, Effect of ABT-263 treatment on the frequency of p16-positive cells (7 dpi) as assessed by immunohistochemistry. Arrows indicate p16-positive cells. Bars: 20 μm. C, The p16 transcript levels are indicated (n = 3-6). The data are expressed as the fold increase relative to average gene expression in infected (7 dpi) vehicle-treated young hamsters (n = 3-6). For all graphs, errors indicate mean ± s.d. One of two representative experiments are shown (A-C). Significance of body weight loss between animal groups was calculated using wilcoxon matched-pairs signed rank test (A). Significant differences were determined using One-way ANOVA Kruskal-Wallis test (nonparametric), followed by the Dunn’s posttest test (C).
Extended Data Fig. 5
Extended Data Fig. 5. Effect of ABT-263 treatment on viral loads and ISGs.
Aged hamsters and young hamsters were treated (or not) with ABT-263 and infected with SARS-CoV-2. A, Quantification of viral RdRp and E protein transcript levels in the whole lungs using RT-PCR assays (7 dpi). The data are expressed as ΔCt and genome copy/μg RNA (n = 5-6). B, mRNA copy numbers of genes (interferons and ISGs), as quantified with RT-PCR. The data are expressed as the fold change, relative to average gene expression in mock-infected animals (n = 5-6). C, Immunohistochemistry analysis of spike in the lung from SARS-CoV-2-infected young hamsters treated (or not) with ABT-263 (3 dpi). Bars: 100 μm and 20 μm. D, Nucleoprotein labelling (immunofluorescence) was performed on lung sections collected at 3 dpi. Bars: 25 μm. Right panel, The histograms indicate the fold change relative to average intensity in vehicle-treated young animals (n = 6). A-D, One of two representative experiments is shown. For all graphs, errors indicate mean ± s.d. Significant differences were determined using the two tailed Mann Whitney U test (B and D) and One-way ANOVA Kruskal-Wallis test (nonparametric), followed by the Dunn’s posttest test (A). * P < 0.05, ** P < 0.01.
Extended Data Fig. 6
Extended Data Fig. 6. Ace2 and p16 expression in vehicle-treated and ABT-263-treated young and aged lungs.
Lungs were collected from uninfected animals previously treated or not with ABT-263. Immunofluorescence staining for DAPI (blue), Ace2 (red) and p16 (green) is shown. Labelling was performed on lung sections collected from vehicle-treated (A) and from ABT-263-treated (B) animals. Scales are indicated. C, The intensity of Ace2 signals was normalized by DAPI count. The histograms indicate the fold change relative to average intensity in vehicle-treated young hamsters (n = 3). D, mRNA copy numbers of Ace2 were quantified in RT-PCR assays (n = 4-9). The data are expressed as the fold change relative to average gene expression in vehicle-treated aged hamsters. A-D, One of two representative experiments is shown. For all graphs, errors indicate mean ± s.d. Significant differences were determined using the two tailed Mann Whitney U test.
Extended Data Fig. 7
Extended Data Fig. 7. Effect of ABT-263 treatment on lung pathology and body weight loss during a SARS-CoV-2 infection.
Aged hamsters and young hamsters were treated (or not) with ABT-263 and then infected with SARS-CoV-2. A, Representative micrographs showing H&E-stained lungs from aged hamsters and young hamsters treated (or not) with ABT-263 (magnification: x 2.5). The percentage of lung sections affected by subacute bronchointerstitial pneumonia (consolidation) is depicted for each group of animals (lower panel, (n = 11-12 aged and n = 6 young). B, Body weight loss curves for infected animals (n = 5-6). C, Heatmaps of the differential expressed components in the lungs of vehicle-treated and ABT-263-treated aged hamsters, in a mass-spectrometry analysis of the proteome (fold change in protein abundance >2, P < 0.05) (n = 4). Pooled results from two independent experiments (A left, B and C) and one of two representative experiments (A right) are shown. For all graphs, errors indicate mean ± SD. A and C, Significant differences were determined using the two tailed Mann Whitney U test. ** P < 0.01.

Comment in

  • Senolytics combat COVID-19 in aging.
    Zhang X, Suda M, Zhu Y. Zhang X, et al. Nat Aging. 2023 Jul;3(7):762-763. doi: 10.1038/s43587-023-00450-w. Nat Aging. 2023. PMID: 37414986 Free PMC article.

References

    1. Rea IM, Alexander HD. Triple jeopardy in ageing: COVID-19, co-morbidities and inflamm-ageing. Ageing Res. Rev. 2022;73:101494. - PMC - PubMed
    1. Ruan Q, Yang K, Wang W, Jiang L, Song J. Clinical predictors of mortality due to COVID-19 based on an analysis of data of 150 patients from Wuhan, China. Intensive Care Med. 2020;46:846–848. - PMC - PubMed
    1. Williamson EJ, et al. Factors associated with COVID-19-related death using OpenSAFELY. Nature. 2020;584:430–436. doi: 10.1038/s41586-020-2521-4. - DOI - PMC - PubMed
    1. O’Driscoll M, et al. Age-specific mortality and immunity patterns of SARS-CoV-2. Nature. 2021;590:140–145. - PubMed
    1. Bartleson JM, et al. SARS-CoV-2, COVID-19 and the aging immune system. Nat. Aging. 2021;1:769–782. - PMC - PubMed

Publication types