. 2023 Oct;46(5):1587-1601.
doi: 10.1007/s10753-023-01860-z. Epub 2023 Jul 6.

Coordinated Priming of NKG2D Pathway by IL-15 Enhanced Functional Properties of Cytotoxic CD4+CD28- T Cells Expanded in Systemic Lupus Erythematosus

Affiliations

Coordinated Priming of NKG2D Pathway by IL-15 Enhanced Functional Properties of Cytotoxic CD4+CD28- T Cells Expanded in Systemic Lupus Erythematosus

Tingting Wang et al. Inflammation. 2023 Oct.

Abstract

Systemic lupus erythematosus (SLE) is a systemic autoimmune disorder, and numerous aberrations of T cell responses have been reported and were implicated in its pathophysiology. Recently, CD4-positive T cells with cytotoxic potential were shown to be involved in autoimmune disease progression and tissue damage. However, the effector functions of this cell type and their potential molecular mechanisms in SLE patients remain to be elucidated. In this study, we find that cytotoxic CD4+CD28- T cells are expanded in SLE patients with flow cytometry analysis, and the percentage of CD4+CD28- T cells positively correlates with the Systemic Lupus International Collaborating Clinics/ACR Damage Index (SDI). Furthermore, our study suggests that interleukin-15 (IL-15) promotes the expansion, proliferation, and cytotoxic function of CD4+CD28- T cells in SLE patients through activation of the Janus kinase3-STAT5 pathway. Further study indicates that IL-15 not only mediates the upregulation of NKG2D, but also cooperates with the NKG2D pathway to regulate the activation of the phosphatidylinositol 3-kinase (PI3K)/protein kinase B (AKT) pathway. Together, our study demonstrated that proinflammatory and cytolytic CD4+CD28- T cells expand in SLE patients. The pathogenic potential of these CD4+CD28- T cells is driven by the coupling of the IL-15/IL-15R signaling pathway and the NKG2D/DAP10 signaling pathway, which may open new avenues for therapeutic intervention to prevent SLE progression.

Keywords: cytolytic function; cytotoxic CD4+CD28− T cells; inflammation; interleukin-15-NKG2D; tissue damage.


Conflict of interest statement

The authors declared no competing interests.

Figures

Fig. 1
Fig. 1
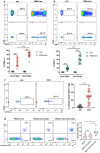
CD4+CD28 T cells with effector-memory cytotoxic phenotype are present at high frequency in SLE patients. A Flow cytometry determined the frequency of CD4+CD28 T cells in PBMCs from HC, NLN (non-lupus nephritis), and LN (Lupus nephritis). B Flow cytometry detection of GZMB expression on CD4+CD28 T cells and CD4+CD28+ T cells from SLE. C The correlation between the percentage of CD4+CD28 T cells and SDI score in SLE is shown. D Graphs showing the percentage of CD4+CD28 T cells in HC (n = 39), NLN-SLE (n = 74), LN (n = 80), and the percentage of GZMB+ cells in CD4+CD28 T cells and CD4+CD28+ T cells from SLE (n = 32). E Graphs showing the percentage of GZMA + cells (n = 24) and perforin + (n = 24) in CD4+CD28 T cells and CD4+CD28+ T cells from SLE. F Flow cytometry detection of CCR7 and CD45RA expression on CD4+CD28 T cells from SLE. G Flow cytometry detection of transcription factor Runx3 and T-bet expression on CD4+CD28 T cells and CD4+CD28+ T cells from SLE; graphs showing the percentage of Runx3 + (n = 14) and T-bet + (n = 16) cells in CD4+CD28 T cells and CD4+CD28+ T cells from SLE. H Flow cytometry detection of CX3CR1 and NKG2D expression on CD4+CD28 T cells and CD4+CD28+ T cells from SLE; graphs showing the percentage of CX3CR1 + (n = 14) and NKG2D + (n = 53) cells in CD4+CD28 T cells and CD4+CD28+ T cells from SLE. Data information: data are presented as mean ± SEM; *P < 0.05, **P < 0.01, ***P < 0.001, two-tailed Mann-Whitney U test (D, E, H) or unpaired two-tailed student’s t-test (G).
Fig. 2
Fig. 2
Cytotoxic effect and production of proinflammatory cytokines of CD4+CD28 T cells from SLE patients. PBMCs from SLE were cultured alone (w/o) or stimulated with PMA, ion, and brefeldin A for 4 h. Percentages of TNF-α (A) and IFN-γ (B) in CD4+CD28 T cells and CD4+CD28+ T cells from SLE (n = 14) were measured, respectively. C PBMCs from SLE were stimulated with an anti-CD3 antibody for 6 h, and degranulation was quantified with CD107a. Percentage of CD107a in CD4+CD28 T cells from SLE (n = 20) was determined. D HRGECs apoptosis induced by anti-CD3 treated CD4+CD28 T cells were detected using flow cytometry. Representative histograms show the percentage of apoptotic HRGECs in 48 h co-cultures, without or with CD4+CD28 T cells at a ratio of 1:1 in medium with or without anti-CD3 antibody. Graphs show the percentage of apoptotic HRGECs (n = 5). Data information: data are presented as mean ± SEM; *P < 0.05, ***P < 0.001. two-way ANOVA with Tukey’s multiple comparisons (A, B), paired two-tailed student’s t-test (C), or one-way ANOVA with Tukey’s multiple comparisons (D).
Fig. 3
Fig. 3
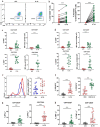
Effects of IL-15 on the expansion and function of CD4+CD28 T cells in patients with SLE. PBMCs from SLE were grown in medium alone, with anti-CD3 (1 µg/ml), IL-15 (50 ng/ml), or a combination of both, respectively. A Representative dot plots of CD4+CD28 T cells (n = 23) percentage treated with and without IL-15, respectively. B Graphs showing the percentage of CD4+CD28 T cells (n = 23) and % increase of CD4+CD28 T cells. C and D Graphs showing the percentage of Ki67+ (n = 12) and CD69+ (n = 12) cells and the MFI of Ki67 and CD69 in CD4+CD28 T cells and CD4+CD28+ T cells from SLE. E Histogram representing the MFI of GZMB on CD4+CD28 T cells, the graph shows the MFI of GZMB (n = 15) on CD4+CD28 T cells cultured without (w/o) and with IL-15. F Graphs showing the percentage of CD107a+ cells (n = 17) on CD4+CD28 T cells cultured without (w/o) and with IL-15 and the percentage of CD107a+ cells (n = 12) cultured with anti-CD3 or anti-CD3 + IL-15. E Graphs show the percentage of IFN-γ+ cells (n = 14) on CD4+CD28+ and CD4+CD28 T cells cultured without (w/o) and with IL-15. H Graphs showing the percentage of TNF-α+ cells (n = 14) on CD4+CD28 and CD4+CD28+ T cells cultured without (w/o) and with IL-15. Data information: data are presented as mean ± SEM; ***P < 0.001, paired two-tailed student’s t-test (B, C, D, E, and F) or (G, H).
Fig. 4
Fig. 4
IL-15 activates JAK3/STAT5 pathway in CD4+CD28 T cells from SLE patients. A Phosphorylation levels of STAT5 were determined in CD4+CD28 T cells cultured without (w/o) or with IL-15. Histogram and graph showing the phosphorylation levels of STAT5 (n = 12). Dark-shaded histograms indicate negative isotypic control. B Representative dot plots of CD4+CD28 T cells percentage, graphs showing the percentage of CD4+CD28 T cells (n = 9) untreated (w/o), treated with IL-15 or IL-15 plus Tofacitinib. C Representative dot plots of Ki67 expressing on CD4+CD28 T cells, graphs showing the percentage of Ki67+ (n = 5) in CD4+CD28 T cells untreated (w/o), treated with IL-15 or IL-15 plus tofacitinib. D Histogram representing the MFI of GZMB on CD4+CD28 T cells, the graph shows the MFI of GZMB (n = 9) on CD4+CD28 T cells treated with nothing (w/o), IL-15 and IL-15 plus tofacitinib. Data information: data are presented as mean ± SEM; *P < 0.05, **P < 0.01,***P < 0.001, two-tailed Wilcoxon matched-paired signed-rank test (A) or paired two-tailed student’s t-test (B, C, D).
Fig. 5
Fig. 5
IL-15 upregulates NKG2D expression and activates the NKG2D pathway in CD4+CD28 T cells from SLE patients. A Representative histogram for NKG2D expression on CD4+CD28 T cells, the graph shows the percentage of NKG2D+ cells (n = 12) on CD4+CD28 T cells cultured without (w/o) and with IL-15. Dark-shaded histograms indicate negative isotypic control. B Phosphorylation levels of Akt were determined in CD4+CD28 T cells cultured in medium alone (w/o), with IL-15 or IL-15 plus LY294002. Histogram and graph showing the phosphorylation levels of Akt (n = 6). C Phosphorylation levels of Akt were determined in CD4+CD28 T cells cultured in medium alone (w/o), with IL-15 or IL-15 plus NKG2D neutralizing antibody. Histogram and graph showing the phosphorylation levels of Akt (n = 6). D Histogram representing the MFI of GZMB on CD4+CD28 T cells, the graph shows the MFI of GZMB (n = 7) on CD4+CD28 T cells treated with nothing (w/o), IL-15 and IL-15 plus LY294002. E Representative dot plots of Ki67 expressing on CD4+CD28 T cells, graphs showing the percentage of Ki67+ (n = 7) in CD4+CD28 T cells untreated (w/o), treated with IL-15 or IL-15 plus LY294002. F Representative dot plots of CD107a expressing on CD4+CD28 T cells, graphs showing the percentage of CD107a+ (n = 7) in CD4+CD28 T cells untreated (w/o), treated with IL-15 or IL-15 plus LY294002. Data information: data are presented as mean ± SEM; **P < 0.01,***P < 0.001, paired two-tailed student’s t-test (A, B, C, D, E, and F).

References

    1. Ohl K, Tenbrock K. Inflammatory cytokines in systemic lupus erythematosus. Journal of Biomedicine & Biotechnology. 2011;2011:432595. - PMC - PubMed
    1. Dema, B., and N. Charles. 2016. Autoantibodies in SLE: specificities, isotypes and receptors. Antibodies (Basel) 5. - PMC - PubMed
    1. Crispin JC, Liossis SN, Kis-Toth K, Lieberman LA, Kyttaris VC, Juang YT, et al. Pathogenesis of human systemic lupus erythematosus: Recent advances. Trends in Molecular Medicine. 2010;16:47–57. - PMC - PubMed
    1. Almaani S, Meara A, Rovin BH. Update on lupus nephritis. Clinical Journal of the American Society of Nephrology. 2017;12:825–835. - PMC - PubMed
    1. Lipsky PE. Systemic lupus erythematosus: An autoimmune disease of B cell hyperactivity. Nature Immunology. 2001;2:764–766. - PubMed

MeSH terms